. 2022 May 23;7(10):e151849.
doi: 10.1172/jci.insight.151849.

Longitudinal analysis of T cell receptor repertoires reveals shared patterns of antigen-specific response to SARS-CoV-2 infection

Affiliations

Longitudinal analysis of T cell receptor repertoires reveals shared patterns of antigen-specific response to SARS-CoV-2 infection

Rachel M Gittelman et al. JCI Insight. .

Abstract

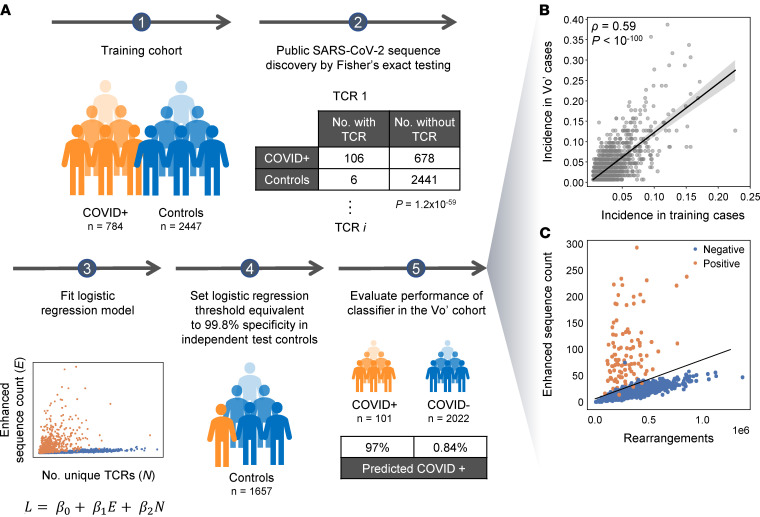
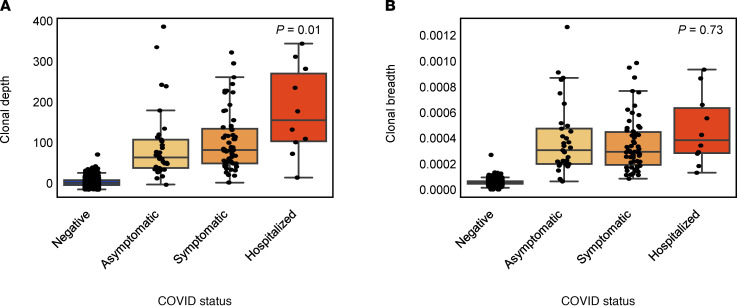
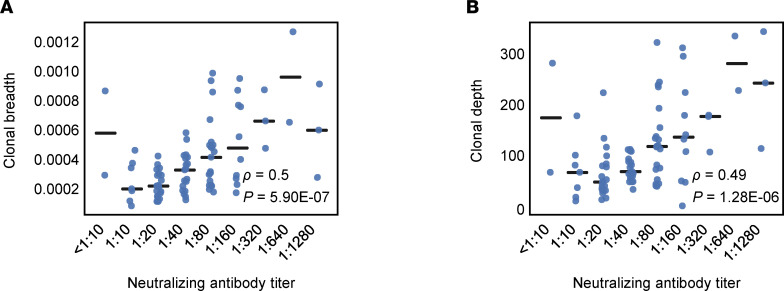
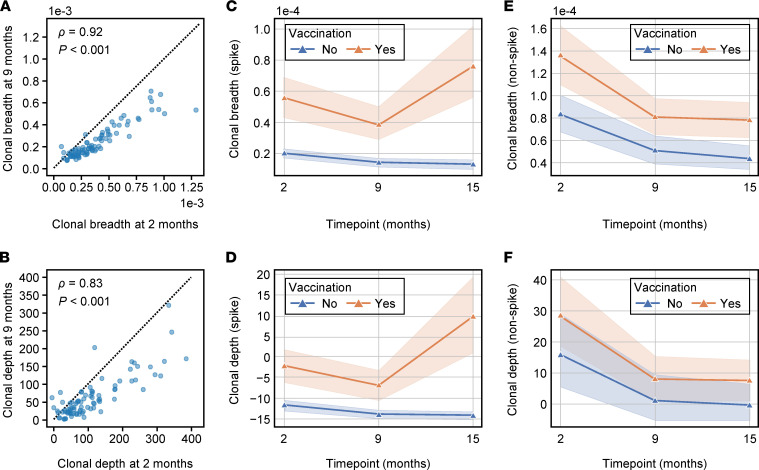
T cells play a prominent role in orchestrating the immune response to viral diseases, but their role in the clinical presentation and subsequent immunity to SARS-CoV-2 infection remains poorly understood. As part of a population-based survey of the municipality of Vo', Italy, conducted after the initial SARS-CoV-2 outbreak, we sampled the T cell receptor (TCR) repertoires of the population 2 months after the initial PCR survey and followed up positive cases 9 and 15 months later. At 2 months, we found that 97.0% (98 of 101) of cases had elevated levels of TCRs associated with SARS-CoV-2. T cell frequency (depth) was increased in individuals with more severe disease. Both depth and diversity (breadth) of the TCR repertoire were positively associated with neutralizing antibody titers, driven mostly by CD4+ T cells directed against spike protein. At the later time points, detection of these TCRs remained high, with 90.7% (78 of 96) and 86.2% (25 of 29) of individuals having detectable signal at 9 and 15 months, respectively. Forty-three individuals were vaccinated by month 15 and showed a significant increase in TCRs directed against spike protein. Taken together, these results demonstrate the central role of T cells in mounting an immune defense against SARS-CoV-2 that persists out to 15 months.

Keywords: COVID-19; Immunology; T cells.


Figures

Figure 1
Figure 1. Identification and use of public T cell receptors to characterize the SARS-CoV-2 immune response.
(A) Schema of the previously generated classification framework, also described in refs. and , starting from a case-control design and Fisher’s exact testing for each TCR on independent training data, to identify public TCR sequences that are overrepresented in cases versus controls. Following logistic regression to establish the T cell test threshold for determining recent or past infection, the receptors are applied to this Vo’ study data set. COVID+ samples include all 101 samples defined by the positive ground truth samples set from Dorigatti et al. (36), while controls included the 2022 samples that were negative by PCR and all 3 serology tests. (B) Incidence of each TCR sequence compared in the training data and in the Vo’ PCR+ cases. (C) The count of enhanced sequences is plotted versus the total number of unique TCR rearrangements for individuals in the Vo’ study data set that were positive (orange) or negative (blue).
Figure 2
Figure 2. T cell depth and breadth compared across 2022 confident COVID-19 individuals, and in 101 COVID-19+ individuals faceted by disease severity.
(A and B) Clonal depth indicates the relative proportion of T cells that are SARS-CoV-2 specific, and clonal breadth indicates the fraction of all unique TCR DNA clones that are SARS-CoV-2 specific. P values correspond to Jonckheere’s 2-sided trend test across the 3 PCR+ categories. Data are expressed as median ± IQR.
Figure 3
Figure 3. Clonal breadth and depth compared across cases.
(A and B) Clonal breadth and depth compared across 88 cases that were positive by real-time PCR and/or all 4 additional tests and faceted by neutralizing antibody titer. Spearman’s correlations are indicated by ρ and corresponding P values by P.
Figure 4
Figure 4. Longitudinal assessment of clonal depth and breadth.
(A and B) Clonal breadth (A) and depth (B) for COVID cases (n = 86) at 2 months and 9 months. The dotted line indicates the line y = x. Spearman’s correlations are indicated by ρ and corresponding P values by P. (CF) Mean clonal breadth and mean clonal depth of T cells specific to spike protein are shown across time, while E depicts mean clonal breadth and F depicts mean clonal depth of T cells specific to non-spike proteins across time. The shaded areas represent the 95% CI of the mean. Samples were grouped by vaccination status at month 15.

References

    1. Iyer AS, et al. Persistence and decay of human antibody responses to the receptor binding domain of SARS-CoV-2 spike protein in COVID-19 patients. Sci Immunol. 2020;5(52):eabe0367. doi: 10.1126/sciimmunol.abe0367. - DOI - PMC - PubMed
    1. Isho B, et al. Persistence of serum and saliva antibody responses to SARS-CoV-2 spike antigens in COVID-19 patients. Sci Immunol. 2020;5(52):eabe5511. doi: 10.1126/sciimmunol.abe5511. - DOI - PMC - PubMed
    1. Seow J, et al. Longitudinal observation and decline of neutralizing antibody responses in the three months following SARS-CoV-2 infection in humans. Nat Microbiol. 2020;5(12):1598–1607. doi: 10.1038/s41564-020-00813-8. - DOI - PMC - PubMed
    1. Boonyaratanakornkit J, et al. Clinical, laboratory, and temporal predictors of neutralizing antibodies against SARS-CoV-2 among COVID-19 convalescent plasma donor candidates. J Clin Invest. 2021;131(3):e144930. doi: 10.1172/JCI144930. - DOI - PMC - PubMed
    1. Gilbert PB, et al. Immune correlates analysis of the mRNA-1273 COVID-19 vaccine efficacy clinical trial. Science. 2022;375(6576):43–50. doi: 10.1126/science.abm3425. - DOI - PMC - PubMed

Publication types

Substances