. 2022 Jun 3;10(6):745-756.
doi: 10.1158/2326-6066.CIR-21-0171.

Neoadjuvant Intravenous Oncolytic Vaccinia Virus Therapy Promotes Anticancer Immunity in Patients

Affiliations

Neoadjuvant Intravenous Oncolytic Vaccinia Virus Therapy Promotes Anticancer Immunity in Patients

Adel Samson et al. Cancer Immunol Res. .

Abstract

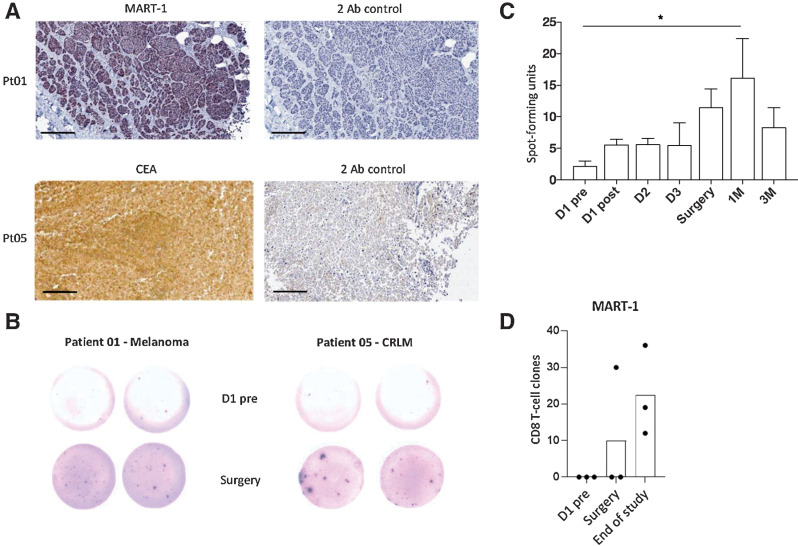
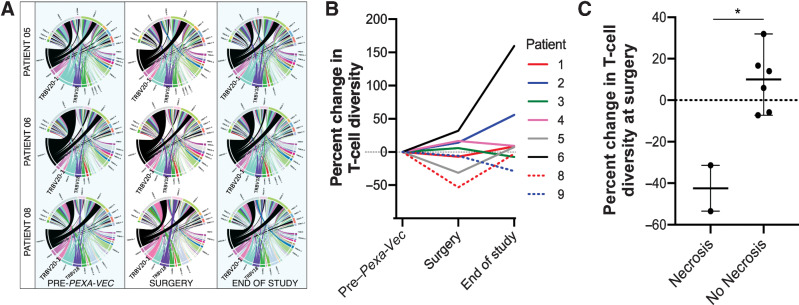
Improving the chances of curing patients with cancer who have had surgery to remove metastatic sites of disease is a priority area for cancer research. Pexa-Vec (Pexastimogene Devacirepvec; JX-594, TG6006) is a principally immunotherapeutic oncolytic virus that has reached late-phase clinical trials. We report the results of a single-center, nonrandomized biological end point study (trial registration: EudraCT number 2012-000704-15), which builds on the success of the presurgical intravenous delivery of oncolytic viruses to tumors. Nine patients with either colorectal cancer liver metastases or metastatic melanoma were treated with a single intravenous infusion of Pexa-Vec ahead of planned surgical resection of the metastases. Grade 3 and 4 Pexa-Vec-associated side effects were lymphopaenia and neutropaenia. Pexa-Vec was peripherally carried in plasma and was not associated with peripheral blood mononuclear cells. Upon surgical resection, Pexa-Vec was found in the majority of analyzed tumors. Pexa-Vec therapy associated with IFNα secretion, chemokine induction, and resulted in transient innate and long-lived adaptive anticancer immunity. In the 2 patients with significant and complete tumor necrosis, a reduction in the peripheral T-cell receptor diversity was observed at the time of surgery. These results support the development of presurgical oncolytic vaccinia virus-based therapies to stimulate anticancer immunity and increase the chances to cure patients with cancer.


Figures

Figure 1. Pexa-Vec peripheral blood carriage. A, Trial schema showing the timing [day (d); month (M)] of Pexa-Vec infusion and collection of translational blood samples. B, H&E staining of tumor sections from patients 05 and 08 showing areas of necrosis. “L” indicates lymphocytic infiltrate. Bars, 400 μm. C, qPCR quantification of Pexa-Vec in the plasma or PBMCs of three healthy donors following ex vivo addition of virus to whole blood. Data are shown as mean + SEM ng DNA in PBMCs or plasma extracted from an initial 5 mL peripheral blood. **, P < 0.01; ***, P < 0.001 by unpaired t tests; n = 9. D, Neutralizing antibodies to Pexa-Vec in patient serum following intravenous infusion. Plot shows mean + SEM pre-virus, peak at surgery/1M after and end of study titers in n = 9 patients.
Figure 1.
Pexa-Vec peripheral blood carriage. A, Trial schema showing the timing [day (D); month (M)] of Pexa-Vec infusion and collection of translational blood samples. B, H&E staining of tumor sections from patients 05 and 08 showing areas of necrosis. “L” indicates lymphocytic infiltrate. Bars, 400 μm. C, qPCR quantification of Pexa-Vec in the plasma or PBMCs of three healthy donors following ex vivo addition of virus to whole blood. Data are shown as mean + SEM ng DNA in PBMCs or plasma extracted from an initial 5 mL peripheral blood. **, P < 0.01; ***, P < 0.001 by unpaired t tests; n = 9. D, Neutralizing antibodies to Pexa-Vec in patient serum following intravenous infusion. Plot shows mean + SEM previrus, peak at surgery/1M after and end of study titers in n = 9 patients.
Figure 2. Pexa-Vec detection in resected CRLM specimens. A, The presence of Pexa-Vec in surgical tissue was assessed by IHC following intravenous infusion. Representative slides from 4 patients shows vaccinia protein (brown), secondary antibody-alone controls (2 Ab), and H&E stains in consecutive sections. B, Tissue core biopsies taken from resected CRLM and background liver samples from patients undergoing standard surgery outside the clinical trial. Patient samples were treated with Pexa-Vec-GFP or PBS prior to confocal fluorescent imaging. Images shown are for 1 of 10 representative patients. All bars indicate 200 μm.
Figure 2.
Pexa-Vec detection in resected CRLM specimens. A, The presence of Pexa-Vec in surgical tissue was assessed by IHC following intravenous infusion. Representative slides from 4 patients shows vaccinia protein (brown), secondary antibody-alone controls (2 Ab), and H&E stains in consecutive sections. B, Tissue core biopsies taken from resected CRLM and background liver samples from patients undergoing standard surgery outside the clinical trial. Patient samples were treated with Pexa-Vec-GFP or PBS prior to confocal fluorescent imaging. Images shown are for 1 of 10 representative patients. All bars indicate 200 μm.
Figure 3. Innate immune response to Pexa-Vec. A, Peripheral blood plasma IFNα concentration following Pexa-Vec infusion was determined by multiplex analysis. Data are shown as fold change from baseline [day (D)1 pre] samples. *, P < 0.05 by paired t tests; n = 4. B, Differential ISG expression analysis of mRNA isolated from CRLM trial patient PBMCs at D1 pre, D2, and surgery. Data are expressed as log2 (CPM). Padj value was determined after using the Benjamini and Hochberg (1995) method for controlling the FDR; *, P < 0.05; **, P < 0.01; n = 6. C, Patient PBMCs were collected at the indicated timepoints. Patient NK-cell activation was determined via (i) CD69 expression and (ii) NK degranulation against Mel888 cells (for patients with melanoma) or SW620 cells (for patients with CRLM) and shown as percent positive CD107 expression. *, P < 0.05 by paired t tests; n = 9 for both. D, NK-cell activation (CD69 expression) (i) and NK degranulation (ii) of healthy donor PBMCs following stimulation with Pexa-Vec in the presence of IFNα/β blockade or isotype control. *, P < 0.05 by unpaired t tests; n = 4. E, NK-cell activation (i) and degranulation (ii) of healthy donor PBMCs ± monocyte depletion (CD14−) prior to stimulation with Pexa-Vec. *, P < 0.05 by unpaired t tests; n = 4. All data are shown as mean ± SEM.
Figure 3.
Innate immune response to Pexa-Vec. A, Peripheral blood plasma IFNα concentration following Pexa-Vec infusion was determined by multiplex analysis. Data are shown as fold change from baseline [day (D)1 pre] samples. *, P < 0.05 by paired t tests; n = 4. B, Differential ISG expression analysis of mRNA isolated from CRLM trial patient PBMCs at D1 pre, D2, and surgery. Data are expressed as log2 (CPM). Padj value was determined after using the Benjamini and Hochberg (1995) method for controlling the FDR; *, P < 0.05; **, P < 0.01; n = 6. C, Patient PBMCs were collected at the indicated time points. Patient NK-cell activation was determined via (i) CD69 expression and (ii) NK degranulation against Mel888 cells (for patients with melanoma) or SW620 cells (for patients with CRLM) and shown as percent positive CD107 expression. *, P < 0.05 by paired t tests; n = 9 for both. D, NK-cell activation (CD69 expression) (i) and NK degranulation (ii) of healthy donor PBMCs following stimulation with Pexa-Vec in the presence of IFNα/β blockade or isotype control. *, P < 0.05 by unpaired t tests; n = 4. E, NK-cell activation (i) and degranulation (ii) of healthy donor PBMCs ± monocyte depletion (CD14) prior to stimulation with Pexa-Vec. *, P < 0.05 by unpaired t tests; n = 4. All data are shown as mean ± SEM.
Figure 4. Chemokine expression and CD8+ T-cell tumor infiltration. A, Trial patient peripheral blood lymphocyte concentrations prior to [day (D)1 pre] and post-Pexa-Vec infusion [M: month(s)]. *, P < 0.05 by paired t test; n = 9. B, Cell death of healthy donor PBMC populations treated with Pexa-Vec or PBS (n = 3). C, Pexa-Vec–treated trial patient PBMCs were assessed for (i) mRNA expression of CXCL10. Padj value was determined after using the Benjamini and Hochberg method for controlling FDR; ****, P < 0.0001; n = 7). (ii) Multiplex quantification of CXCL10 protein (IP-10) in trial patient plasma. *, P < 0.05 by paired t tests; n = 9. All data are shown as mean ± SEM. D, IHC staining (brown) of CD8-expressing cells within representative trial patient tumors following Pexa-Vec infusion. Bars, 100 μm.
Figure 4.
Chemokine expression and CD8+ T-cell tumor infiltration. A, Trial patient peripheral blood lymphocyte concentrations prior to [day (D)1 pre] and post–Pexa-Vec infusion [M: month(s)]. *, P < 0.05 by paired t test; n = 9. B, Cell death of healthy donor PBMC populations treated with Pexa-Vec or PBS (n = 3). C,Pexa-Vec–treated trial patient PBMCs were assessed for (i) mRNA expression of CXCL10. Padj value was determined after using the Benjamini and Hochberg method for controlling FDR; ****, P < 0.0001; n = 7. (ii) Multiplex quantification of CXCL10 protein (IP-10) in trial patient plasma. *, P < 0.05 by paired t tests; n = 9. All data are shown as mean ± SEM. D, IHC staining (brown) of CD8-expressing cells within representative trial patient tumors following Pexa-Vec infusion. Bars, 100 μm.
Figure 5. T-cell functional anticancer responses. A, Representative IHC of patient tumors showing MART-1 (patient 01) and CEA (patient 05) expression (purple and brown, respectively), with corresponding secondary antibody controls (2 Ab). Bars, 200 μm. B, Representative ELISpot images from patients 01 and 05 at the indicated timepoints. PBMCs were stimulated using MART-1 and CEA overlapping peptide pools, respectively. Duplicate wells are shown for each timepoint. Data are shown as SFU per well; each spot represents an IFNγ-secreting T cell. C, Cumulative CEA and MART-1 IFNγ responses from all 9 patients via ELISpot. Data are shown as mean + SEM SFU/well. *, P < 0.05 by paired t tests; n = 7–9, depending on sample availability. D, Estimated numbers of CD8 T cells that belong to specific MART-1 TAA clones. Data shown for melanoma patients 01, 03, and 04.
Figure 5.
T-cell functional anticancer responses. A, Representative IHC of patient tumors showing MART-1 (patient 01) and CEA (patient 05) expression (purple and brown, respectively), with corresponding secondary antibody controls (2 Ab). Bars, 200 μm. B, Representative ELISpot images from patients 01 and 05 at the indicated time points. PBMCs were stimulated using MART-1 and CEA overlapping peptide pools, respectively. Duplicate wells are shown for each time point. Data are shown as SFU per well; each spot represents an IFNγ-secreting T cell. C, Cumulative CEA and MART-1 IFNγ responses from all 9 patients via ELISpot. Data are shown as mean + SEM SFU/well. *, P < 0.05 by paired t tests; n = 7–9, depending on sample availability. D, Estimated numbers of CD8 T cells that belong to specific MART-1 TAA clones. Data shown for melanoma patients 01, 03, and 04.
Figure 6. TCR sequencing of trial patient PBMCs. A, Circos plots showing the association of V-gene (lower half of plot) and J-gene (upper half of plot) segments at different timepoints for patients 05, 06, and 08. Width of the ribbon is indicative of the relative usage of each segment at each timepoint. B, Percent change in TCR diversity as calculated by inverse Simpson index. C, Percent change in the diversity of T-cell clones at surgery to compare patients with defined necrosis and patients with no tumor necrosis. *, P < 0.05 by one-tailed Mann–Whitney test (n = 8). Data are shown as mean ± SEM.
Figure 6.
TCR sequencing of trial patient PBMCs. A, Circos plots showing the association of V-gene (lower half of plot) and J-gene (upper half of plot) segments at different time points for patients 05, 06, and 08. Width of the ribbon is indicative of the relative usage of each segment at each time point. B, Percent change in TCR diversity as calculated by inverse Simpson index. C, Percent change in the diversity of T-cell clones at surgery to compare patients with defined necrosis and patients with no tumor necrosis. *, P < 0.05 by one-tailed Mann–Whitney test (n = 8). Data are shown as mean ± SEM.

References

    1. Nordlinger B, Sorbye H, Glimelius B, Poston GJ, Schlag PM, Rougier P, et al. Perioperative FOLFOX4 chemotherapy and surgery versus surgery alone for resectable liver metastases from colorectal cancer (EORTC 40983): long-term results of a randomised, controlled, phase 3 trial. Lancet Oncol 2013;14:1208–15. - PubMed
    1. Eggermont AMM, Chiarion-Sileni V, Grob J-J, Dummer R, Wolchok JD, Schmidt H, et al. Prolonged survival in stage III melanoma with ipilimumab adjuvant therapy. N Engl J Med 2016;375:1845–55. - PMC - PubMed
    1. Russell L, Peng K-W. The emerging role of oncolytic virus therapy against cancer. Chinese Clin Oncol 2018;7:16. - PMC - PubMed
    1. Kim JH, Oh JY, Park BH, Lee DE, Kim JS, Park HE, et al. Systemic armed oncolytic and immunologic therapy for cancer with JX-594, a targeted poxvirus expressing GM-CSF. Mol Ther 2006;14:361–70. - PubMed
    1. Transgene. Jennerex and transgene enter into an exclusive partnership for the development and commercialization of JX-594 for the treatment of cancers; 2010. Available from: http://www.transgene.fr/index.php?option=com_press_release&task=download....

Publication types

Associated data