Comment
. 2022 Jun 8;30(6):809-823.e6.
doi: 10.1016/j.chom.2022.03.030. Epub 2022 Apr 18.

High-fat diet disrupts REG3γ and gut microbial rhythms promoting metabolic dysfunction

Affiliations
Comment

High-fat diet disrupts REG3γ and gut microbial rhythms promoting metabolic dysfunction

Katya Frazier et al. Cell Host Microbe. .

Abstract

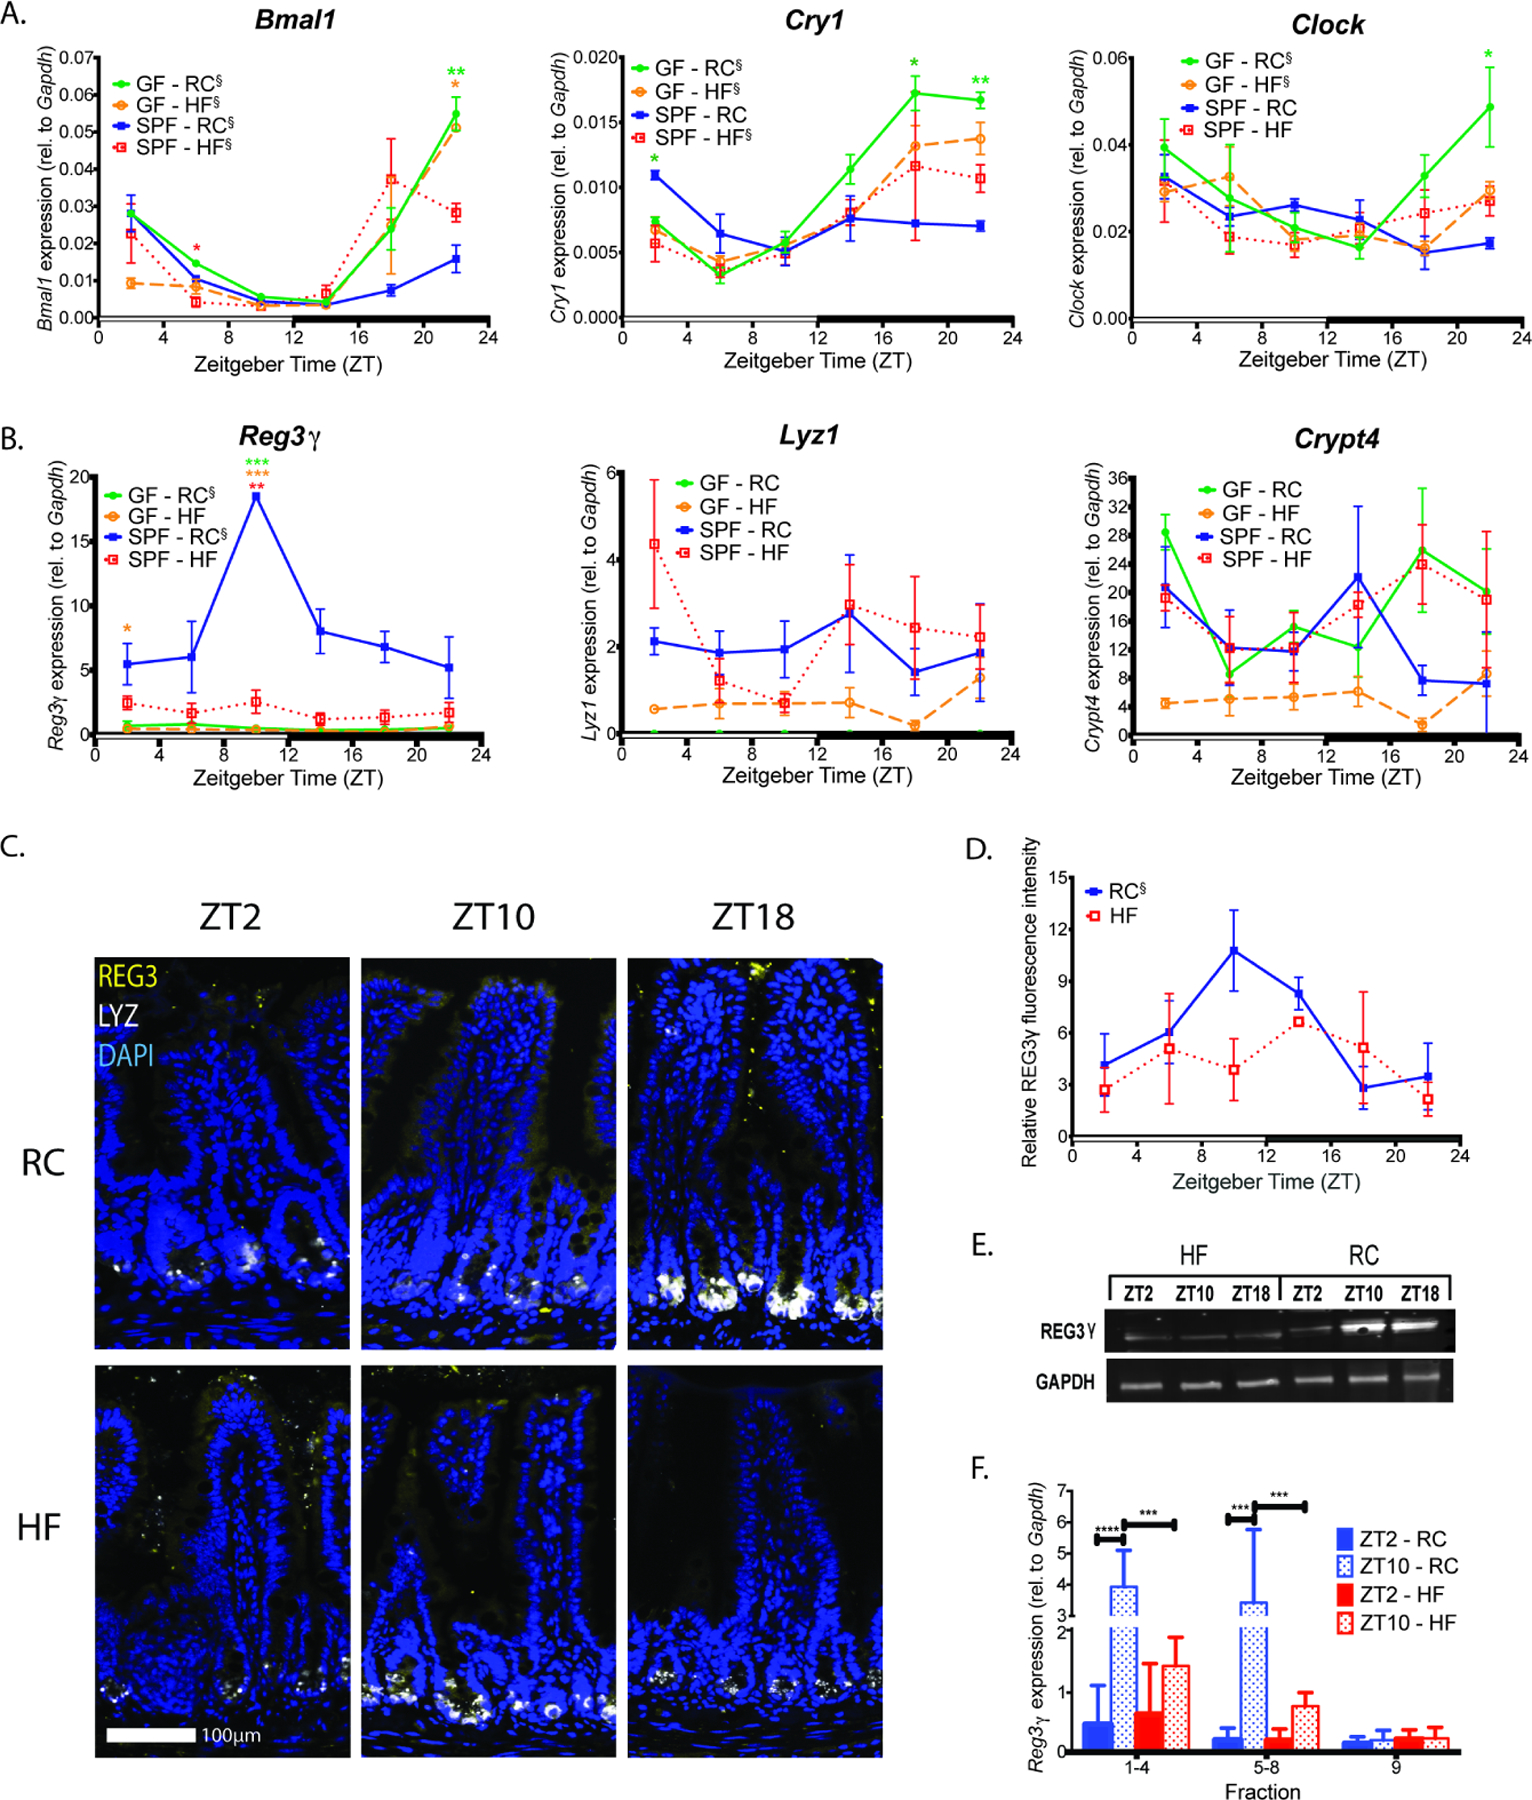
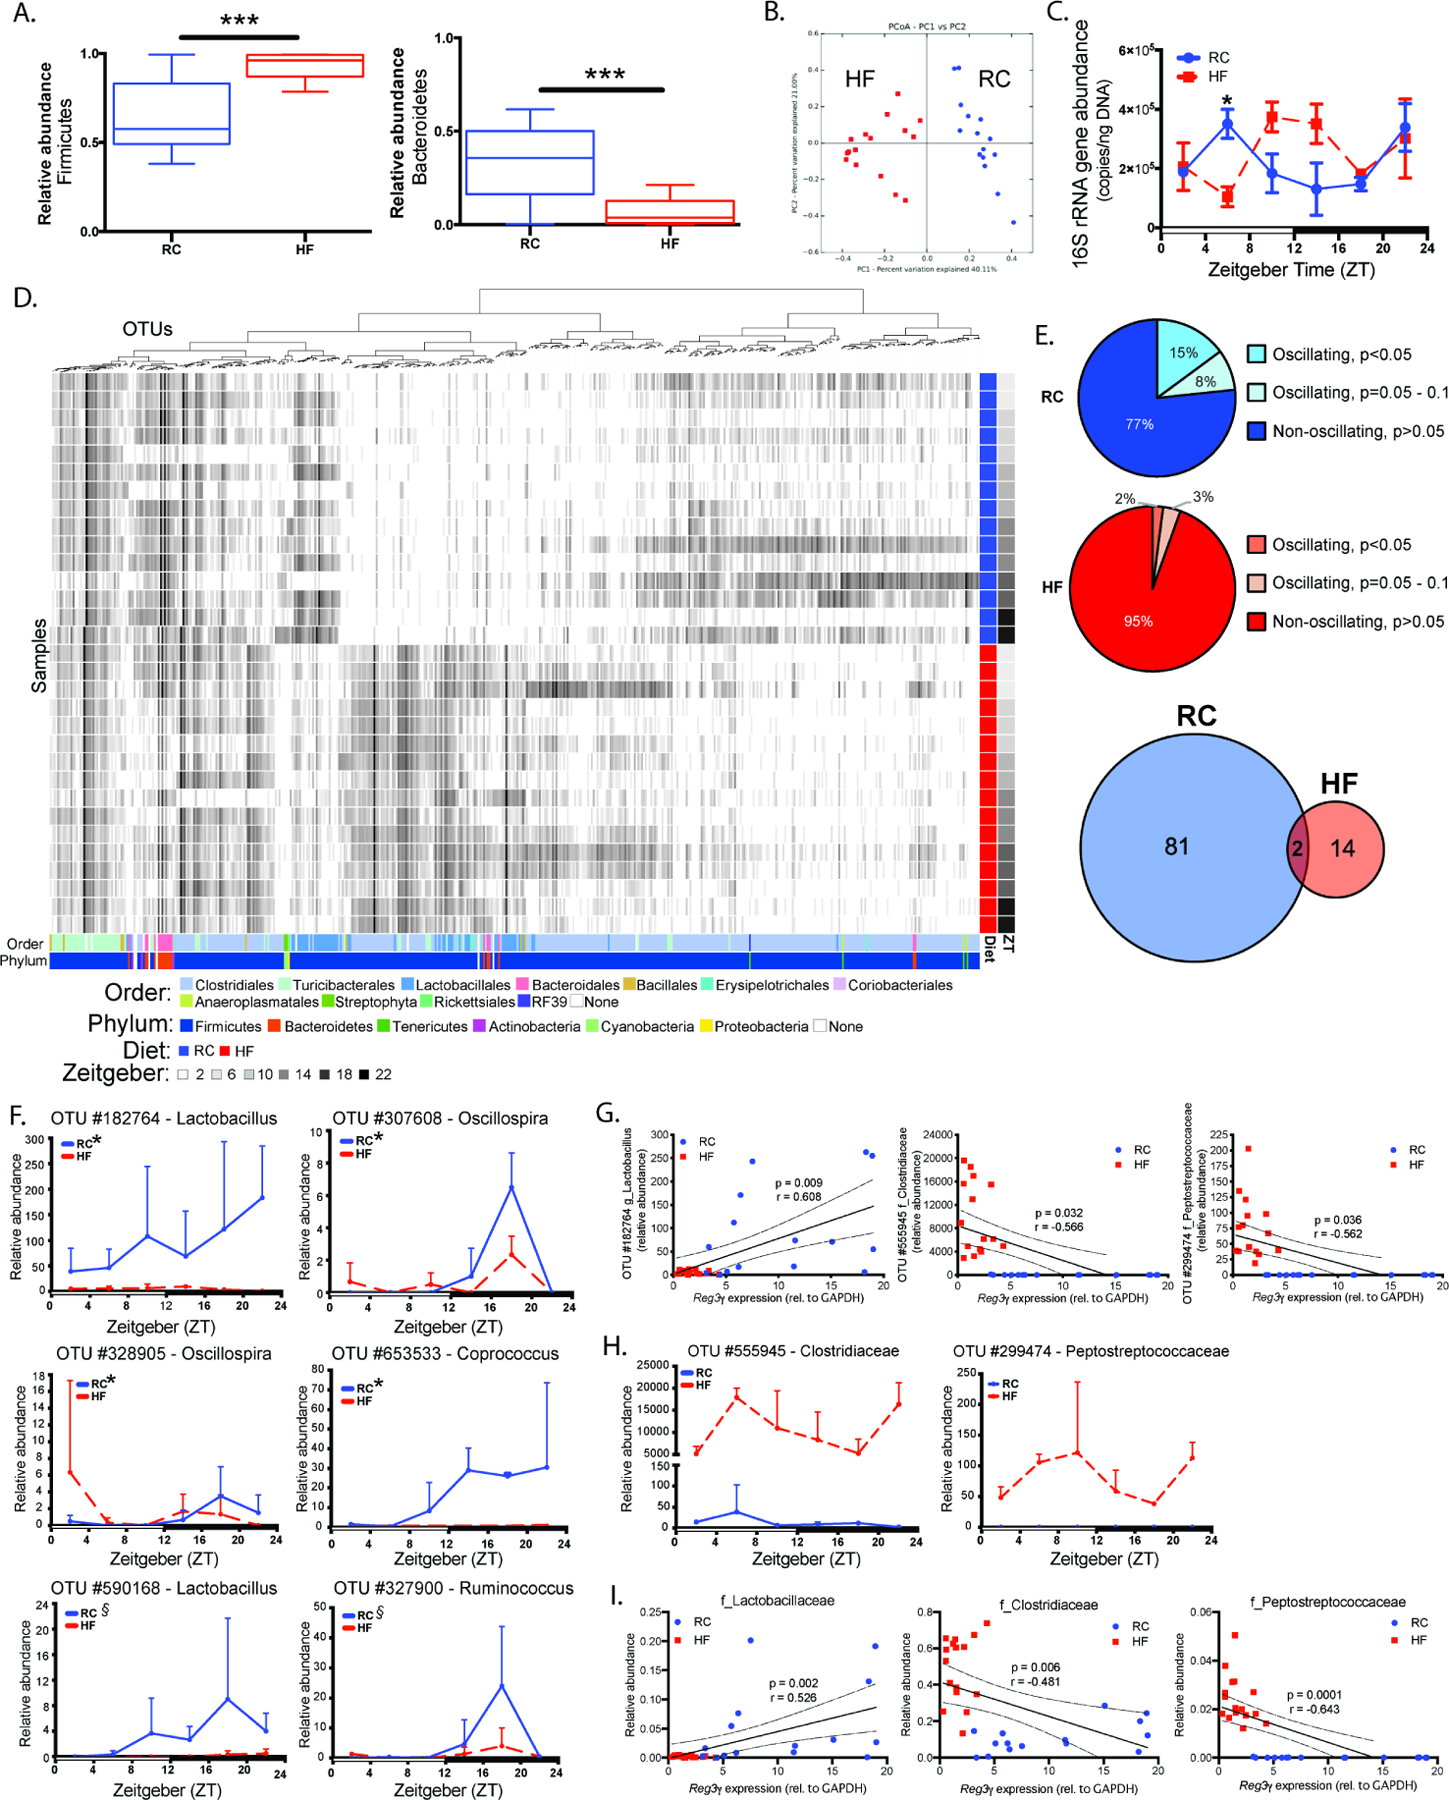
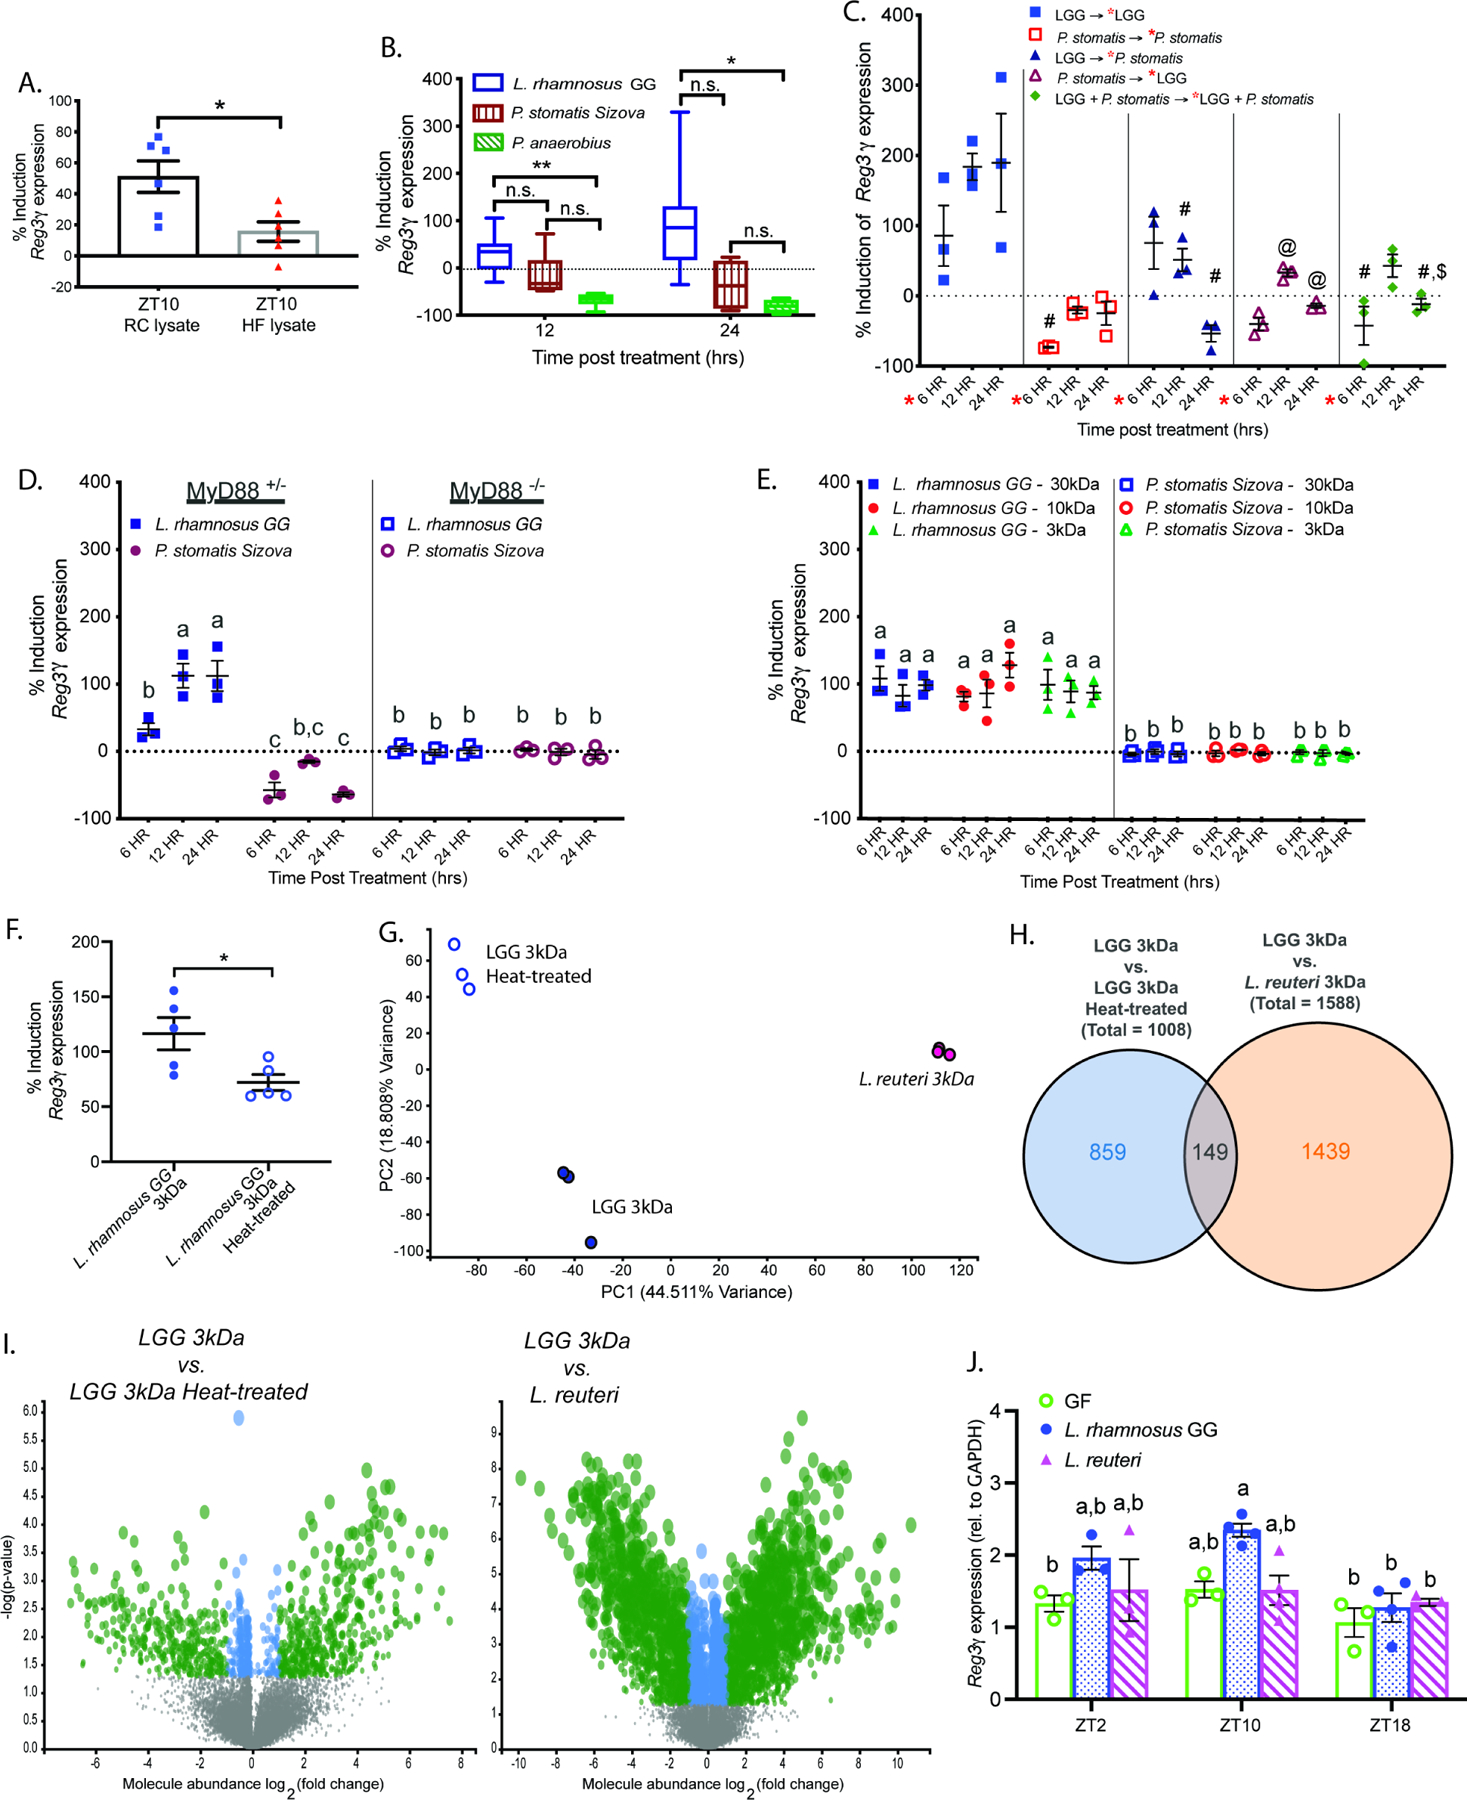
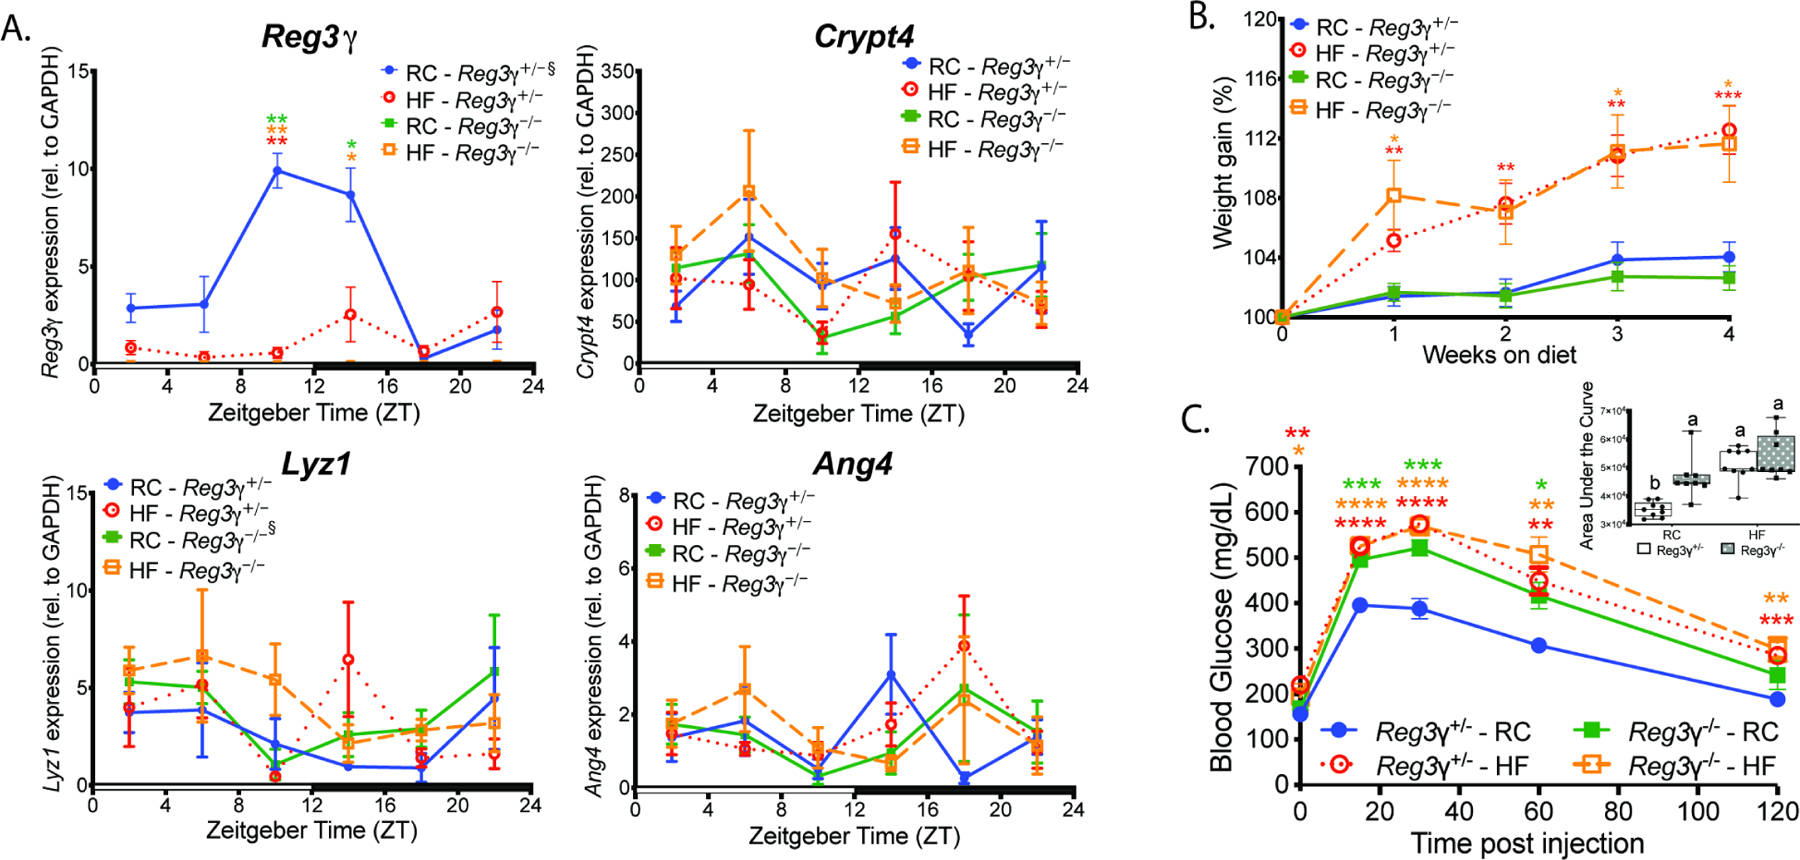
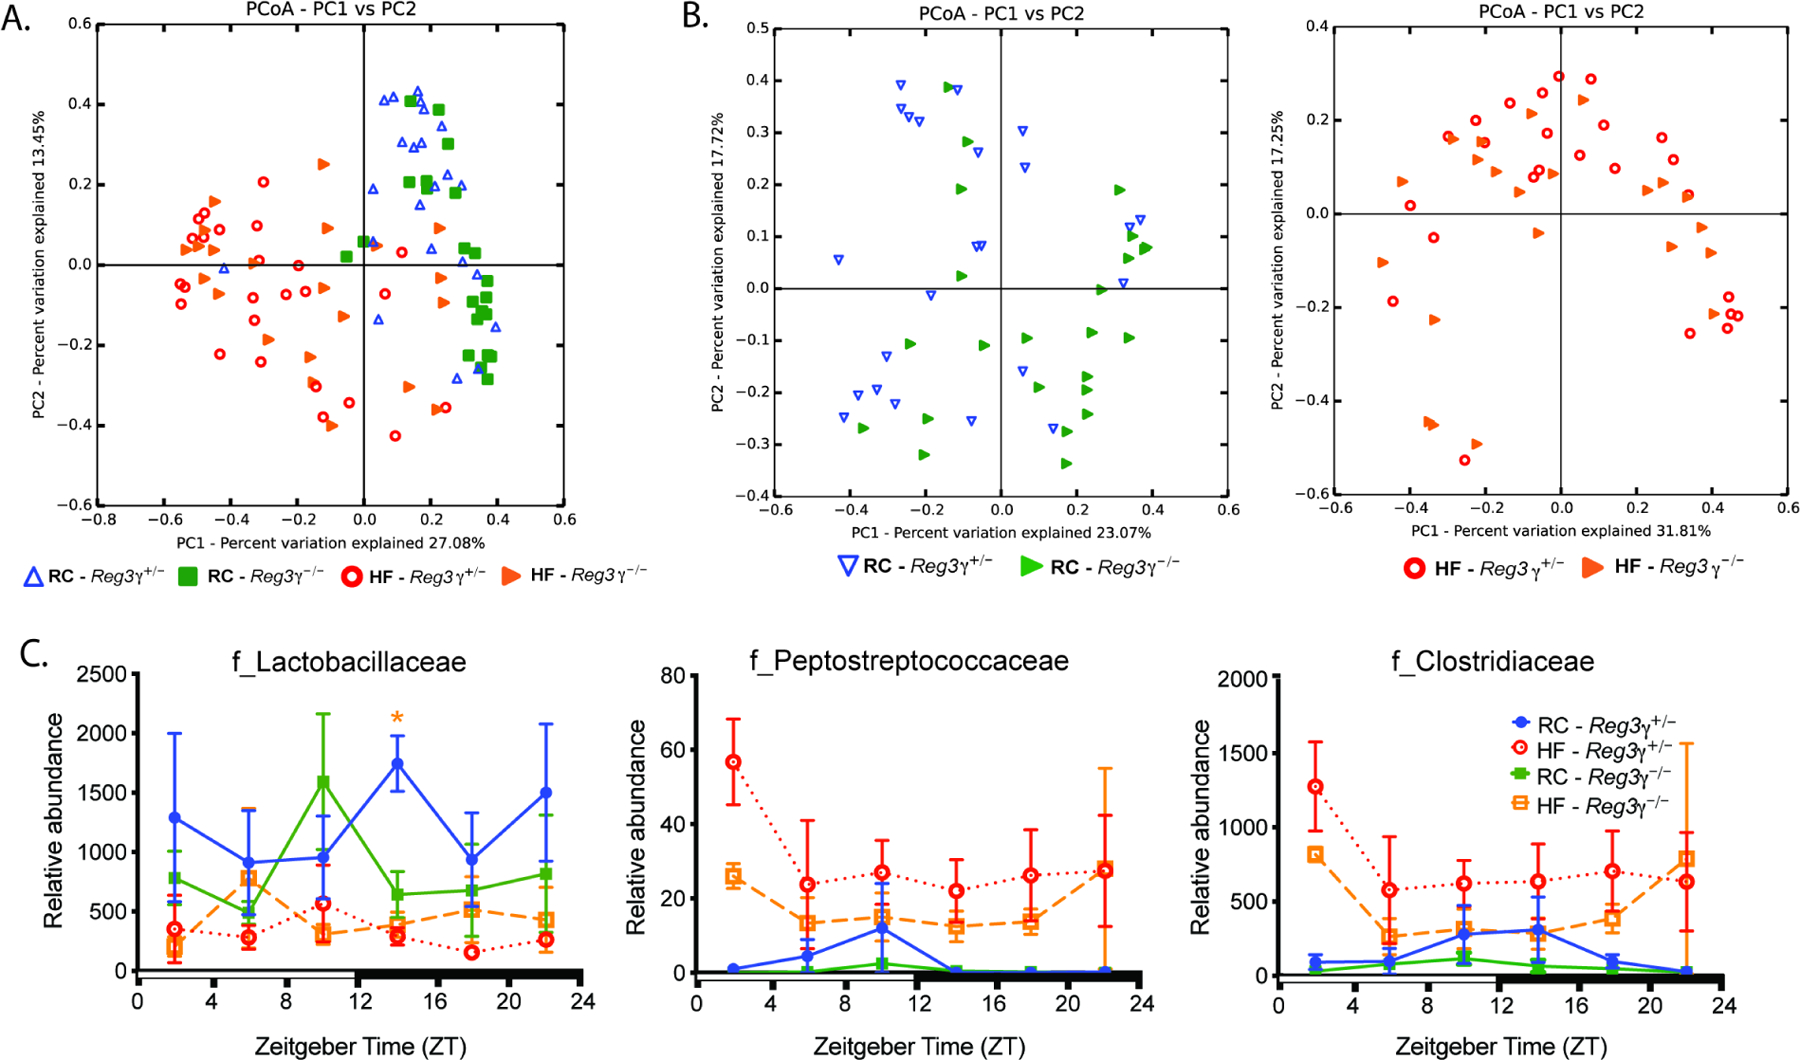
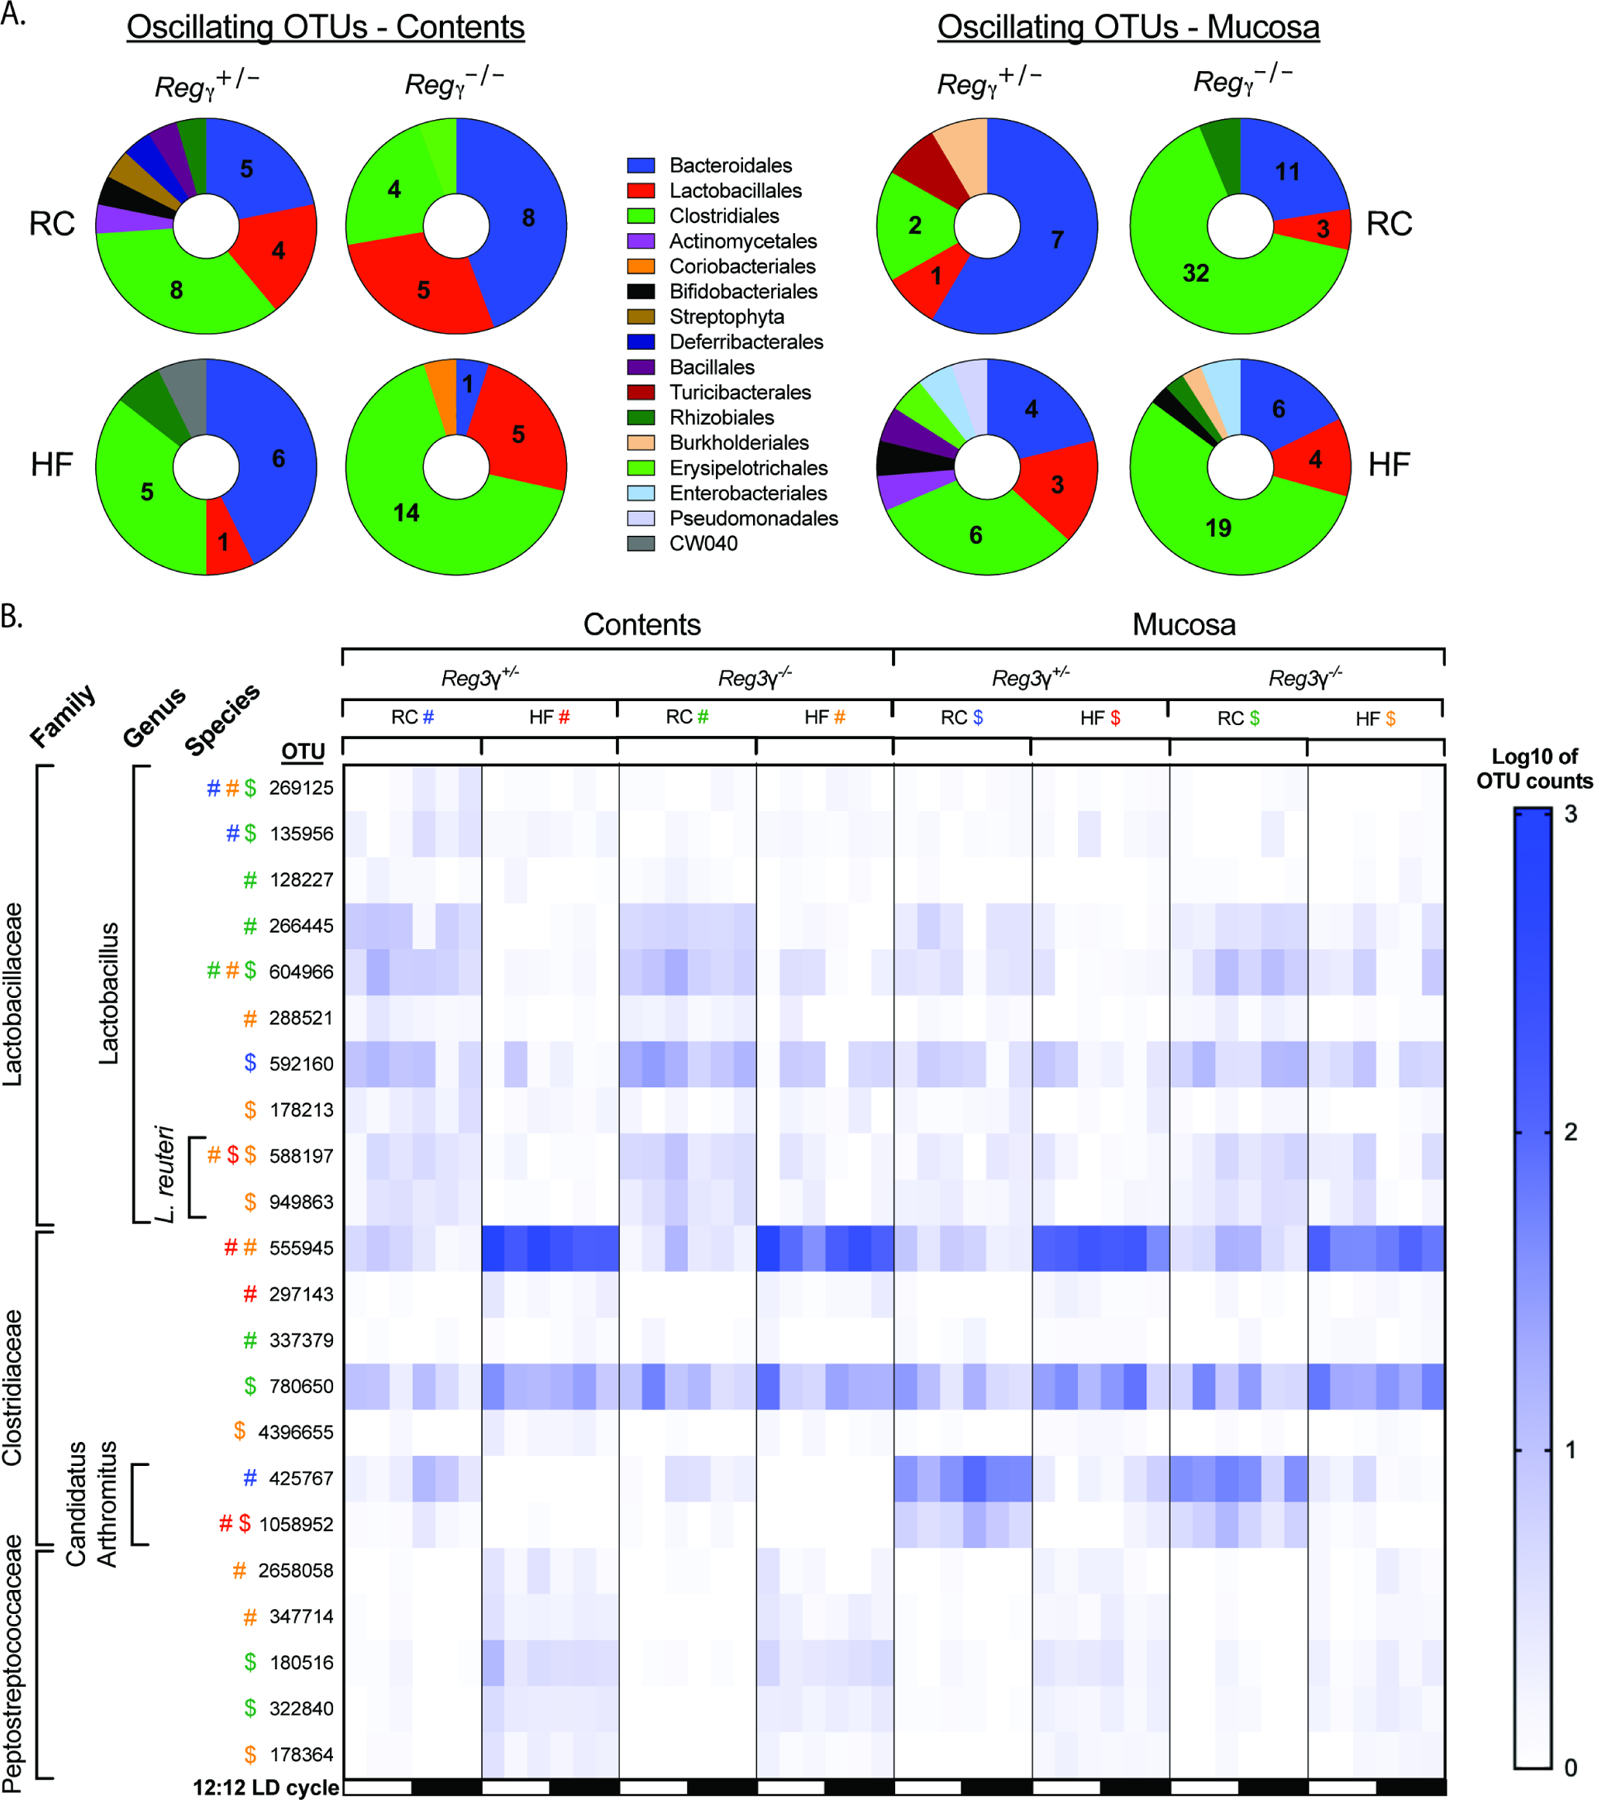
Gut microbial diurnal oscillations are important diet-dependent drivers of host circadian rhythms and metabolism ensuring optimal energy balance. However, the interplay between diet, microbes, and host factors sustaining intestinal oscillations is complex and poorly understood. Here, using a mouse model, we report the host C-type lectin antimicrobial peptide Reg3γ works with key ileal microbes to orchestrate these interactions in a bidirectional manner and does not correlate with the intestinal core circadian clock. High-fat diet is the primary driver of microbial oscillators that impair host metabolic homeostasis, resulting in arrhythmic host Reg3γ expression that secondarily drives abundance and oscillation of key gut microbes. This illustrates transkingdom coordination of biological rhythms primarily influenced by diet and reciprocal sensor-effector signals between host and microbial components, ultimately driving metabolism. Restoring the gut microbiota's capacity to sense dietary signals mediated by specific host factors such as Reg3γ could be harnessed to improve metabolic dysfunction.

Keywords: Reg3γ; circadian rhythms; diurnal oscillation; germ free; gut microbiota; high-fat diet; host-microbe interactions; innate immunity; organoid; small intestine.


Conflict of interest statement

Declaration of interests J.J.C. is a consultant for Thermo Fisher Scientific.

Figures

Figure 1.
Figure 1.. Diurnal patterns of SI Reg3γ expression does not correlate with the core CC network and requires presence of diet-induced gut microbes
(A, B) Circadian (A) and antimicrobial peptide (B) gene expression in mucosal scrapings collected every 4hrs from RC or HF-fed GF and SPF mice (n=2 to 3 mice per treatment per timepoint) maintained in 12:12 light:dark (indicated by open and closed bars on the x-axis). (C, D) Representative immunostaining images (C) for REG3γ (yellow) and LYZ1 (white) in distal ileum sections from RC and HF-fed SPF mice at ZT 2, 10, and 18, and corresponding REG3γ fluorescence intensity quantification (D). (E) REG3γ protein levels by Western blot in mucosal scrapings from RC and HF-fed SPF mice at ZT 2, 10, and 18. (F) Reg3γ expression in distal ileum epithelial fractions from RC or HF-fed SPF mice at ZT2 and 10. Fractions 1–4,5–8=absorptive enterocytes, fraction 9=crypts harboring stem cells and Paneth cells. Data represent mean±SEM. ξ indicates significant (p<0.05) co-sinor expression patterns detected via CircWave. Figures 1A and B were analyzed via Brown-Forsythe and Welch ANOVA followed by Dunnett’s test; Figure 1F was analyzed via two-way ANOVA followed by Tukey’s test. *p<0.05, **p<0.01, ***p<0.001, ****p<0.0001; star color indicates group exhibiting significance relative to SPF-RC.
Figure 2.
Figure 2.. Diet shapes distal small intestine luminal gut microbe community membership and oscillations that correlate with Reg3γ expression
16S rRNA gene amplicon sequencing of distal ileum luminal contents from RC or HF-fed SPF mice collected at ZT 2, 6, 10, 14, 18, and 22 (n=2–3 mice/treatment/ZT). (A) Relative abundances of dominant phyla averaged across timepoints within diet treatment. (B) Bray-Curtis PCoA of 16S rRNA sequences. (C) Absolute 16S rRNA gene copy number determined via qPCR. (D) anvi’o heatmap of 16S rRNA relative abundances. Columns = OTUs, rows = samples. Colored bars at the bottom represent taxonomy; blue and red bars to the right represent diet; gray bars represent ZT. (E) Percentage (pie charts) of oscillating and non-oscillating OTUs determined via eJTK, and numbers (venn diagram) of unique and shared oscillating OTUs. (F) Relative abundances of significantly oscillating OTUs annotated to genus only in RC-fed mice.* indicates p<0.05, ξ indicates p=0.05 – 0.1 significant oscillation detected via eJTK. (G) Reg3γ expression vs. relative abundances of OTUs exhibiting significant Pearson correlations (Bonferroni p<0.05). Linear regression lines with 95% confidence bands shown. (H) Relative abundance of OTUs exhibiting significant negative correlation with Reg3γ mucosal expression. (I) Reg3γ expression vs. relative abundances of OTUs at the family level that exhibit significant Pearson correlations. Linear regression lines with 95% confidence bands shown. Data points represent mean±SEM, box plots represent median±min/max. *p<0.05, ***p<0.001.
Figure 3.
Figure 3.. Diet-induced Gram-positive bacteria drive host Reg3γ expression in a MyD88-dependent manner mediated by microbe-specific small molecules
(A-F) Induction of Reg3γ expression in: (A) WT enteroids following 24hr exposure to lysate of ileal luminal contents obtained from RC or HF-fed SPF WT mice at ZT10, relative to PBS vehicle control (n=6 technical replicates/treatment, representative of 3 independent experiments), (B) WT enteroids following 12 or 24hr exposure to conditioned media from cultured bacteria strains, relative to blank media control (n=3–6 technical replicates/treatment, representative of 3 independent experiments), (C) WT enteroids following 6, 12 or 24hr exposure to conditioned media from cultured bacteria strains, relative to blank media control; red star indicates that after 6 hrs, enteroids were either collected or exposed to a second treatment (n=3 technical replicates/treatment, representative of 2 independent experiments, symbols indicate significant differences relative to: #−12hr LGG; @−6hr P. stomatis; $−12hr P. stomatis → LGG), (D) MyD88+/− or MyD88−/− enteroids 6, 12 or 24hr exposure to conditioned media from cultured bacteria strains, relative to blank media control (n=3 technical replicates/treatment, representative of 2 independent experiments), (E) WT enteroids following exposure to size-fractionated conditioned media from LGG or P. stomatis for 6, 12, or 24hrs (n=3 technical replicates/treatment, representative of 2 independent experiments), (F) WT enteroids following exposure to size-fractionated LGG conditioned media ± heat treatment after 12hr exposure (n=5 technical replicates/treatment, representative of 2 independent experiments). (G-I) Unbiased LC-MS/MS analysis of 3kDa size fractionated L. reuteri BBA15, LGG, and heat-treated LGG conditioned medias (3 technical replicates/strain). (G) Principal component analysis (PCA) based on the relative abundance of MS features (fold-change of peak areas). (H) Summary of differentially abundant (p<0.05 & |log2(fold change (FC))|>1) MS features between comparisons. (I) Volcano plots comparing log2(FC) and -log(p-value); gray dots indicate p>0.05 and |log2(FC)|<1, blue dots indicate p<0.05 and |log2(FC)|<1, and green dots indicate p<0.05 and |log2(FC)|>1. (J) Reg3γ expression in mucosal scrapings of GF, LGG-monoassociated, or L. reuteri-monoassociated WT mice fed RC (n=3–4 mice/treatment/ZT). Data points represent mean±SEM, box plots represent median±min/max. Figure 3B was analyzed via Brown-Forsythe and Welch ANOVA followed by Dunnett’s test; figures 3C–E, and G were analyzed via two-way ANOVA followed by Tukey’s test. *p<0.05, **p<0.01, ***p<0.001, ****p<0.0001, n.s.=not significant. Data with the same letter are not significantly different (p>0.05).
Figure 4.
Figure 4.. Reg3γ deficiency impacts glucose homeostasis in a diet-dependent manner
(A) Antimicrobial peptide gene expression in mucosal scrapings from RC or HF-fed SPF Reg3γ+/− or Reg3γ−/− mice harvested every 4 hrs over a 12:12 light:dark cycle. (B) Percent weight change from baseline in RC or HF-fed Reg3γ+/− or Reg3γ−/− mice (n=23–25 mice/treatment). (C) Glucose tolerance test in Reg3γ+/− or Reg3γ−/− mice fed RC or HF (n=8–9 mice/condition). Inset graph represents Area Under the Curve (AUC). Bars with the same letter are not significantly different (p>0.05). Data points represent mean±SEM. Figures 4A–C were analyzed via Brown-Forsythe and Welch ANOVA followed by Dunnett’s test; Figure 4C AUC was analyzed via two-way ANOVA followed by Tukey’s test. *p<0.05, **p<0.01, ***p<0.001, ****p<0.0001; star color indicates group exhibiting significance relative to Reg3γ+/− RC. ξ indicates significant (p<0.05) co-sinor expression detected via CircWave.
Figure 5.
Figure 5.. REG3γ modestly impacts distal small intestine gut microbe community membership in a diet-dependent manner
16S rRNA gene amplicon sequencing of distal ileum luminal contents from RC or HF-fed SPF Reg3γ+/− or Reg3γ−/− mice collected at ZT 2, 6, 10, 14, 18, and 22 (n=2–5 mice/condition/ZT (A,B) Bray-Curtis PCoA of 16S rRNA sequences comparing all groups (A), and separated by diet (B). (C) Relative abundances of bacteria families over 24 hrs. Data points represent mean±SEM. *p<0.05; star color indicates group exhibiting significance relative to Reg3γ+/− RC.
Figure 6.
Figure 6.. Diet coupled with Reg3γ deficiency induces unique microbial community member specific diurnal oscillations
16S rRNA gene amplicon sequencing of distal ileum luminal contents and mucosal scrapings from RC or HF-fed SPF Reg3γ+/− or Reg3γ−/− mice collected at ZT 2, 6, 10, 14, 18, and 22 (n=2–5 mice/condition/ZT). (A) Proportion of significantly oscillating OTUs detected via eJTK divided by Order level classification in luminal contents (left) and mucosal scrapings (right). Pie charts indicate number of significantly oscillating OTUs. (B) Relative abundances of OTUs (Log10 of counts) of bacterial families that exhibit significant oscillations detected via eJTK in luminal contents and mucosal scrapings. Symbols represent significant oscillations within a group determined by eJTK.

Comment on

References

    1. Bluemel S, Wang L, Martino C, Lee S, Wang Y, Williams B, Horvath A, Stadlbauer V, Zengler K, and Schnabl B (2018). The Role of Intestinal C‐type Regenerating Islet Derived‐3 Lectins for Nonalcoholic Steatohepatitis. Hepatol. Commun 2, 393–406. - PMC - PubMed
    1. Brademan DR, Miller IJ, Kwiecien NW, Pagliarini DJ, Westphall MS, Coon JJ, and Shishkova E (2020). Argonaut: A web platform for collaborative multi-omic data visualization and exploration. Patterns 1, 100122. - PMC - PubMed
    1. Brooks JF, Behrendt CL, Ruhn KA, Lee S, Raj P, Takahashi JS, and Hooper LV (2021). The microbiota coordinates diurnal rhythms in innate immunity with the circadian clock. Cell 184, 4154–4167. - PMC - PubMed
    1. Caporaso JG, Kuczynski J, Stombaugh J, Bittinger K, Bushman FD, Costello EK, Fierer N, Peña AG, Goodrich JK, Gordon JI, et al. (2010). QIIME allows analysis of high-throughput community sequencing data. Nat. Methods 7, 335–336. - PMC - PubMed
    1. Carmody RN, Gerber GK, Luevano JM, Gatti DM, Somes L, Svenson KL, and Turnbaugh PJ (2015). Diet dominates host genotype in shaping the murine gut microbiota. Cell Host Microbe 17, 72–84. - PMC - PubMed

LinkOut - more resources