. 2022 May:79:103999.
doi: 10.1016/j.ebiom.2022.103999. Epub 2022 Apr 16.

Microgliosis and neuronal proteinopathy in brain persist beyond viral clearance in SARS-CoV-2 hamster model

Affiliations

Microgliosis and neuronal proteinopathy in brain persist beyond viral clearance in SARS-CoV-2 hamster model

Christopher Käufer et al. EBioMedicine. 2022 May.

Abstract

Background: Neurological symptoms such as cognitive decline and depression contribute substantially to post-COVID-19 syndrome, defined as lasting symptoms several weeks after initial SARS-CoV-2 infection. The pathogenesis is still elusive, which hampers appropriate treatment. Neuroinflammatory responses and neurodegenerative processes may occur in absence of overt neuroinvasion.

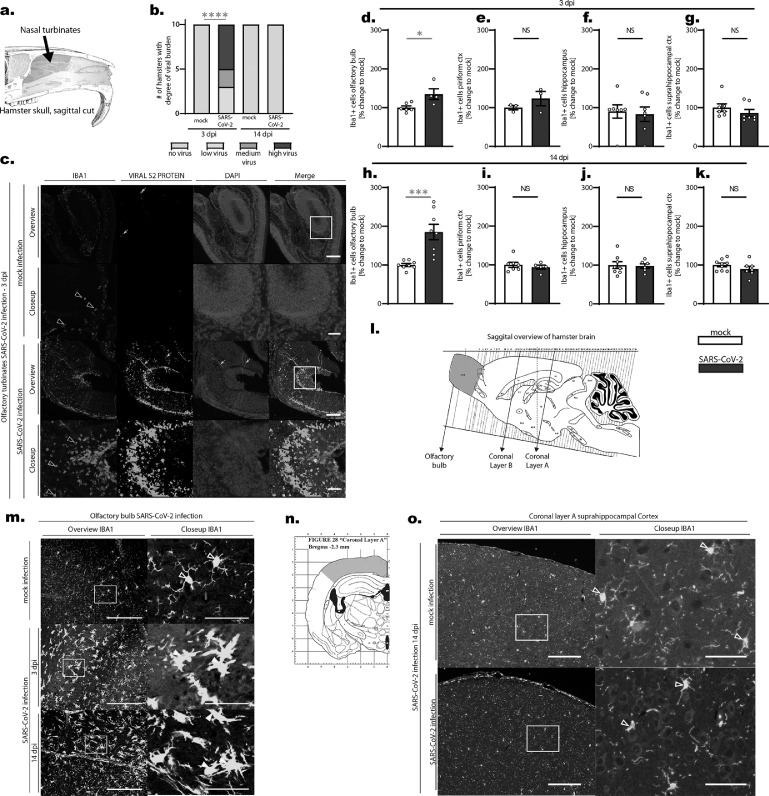
Methods: Here we determined whether intranasal SARS-CoV-2 infection in male and female syrian golden hamsters results in persistent brain pathology. Brains 3 (symptomatic) or 14 days (viral clearance) post infection versus mock (n = 10 each) were immunohistochemically analyzed for viral protein, neuroinflammatory response and accumulation of tau, hyperphosphorylated tau and alpha-synuclein protein.

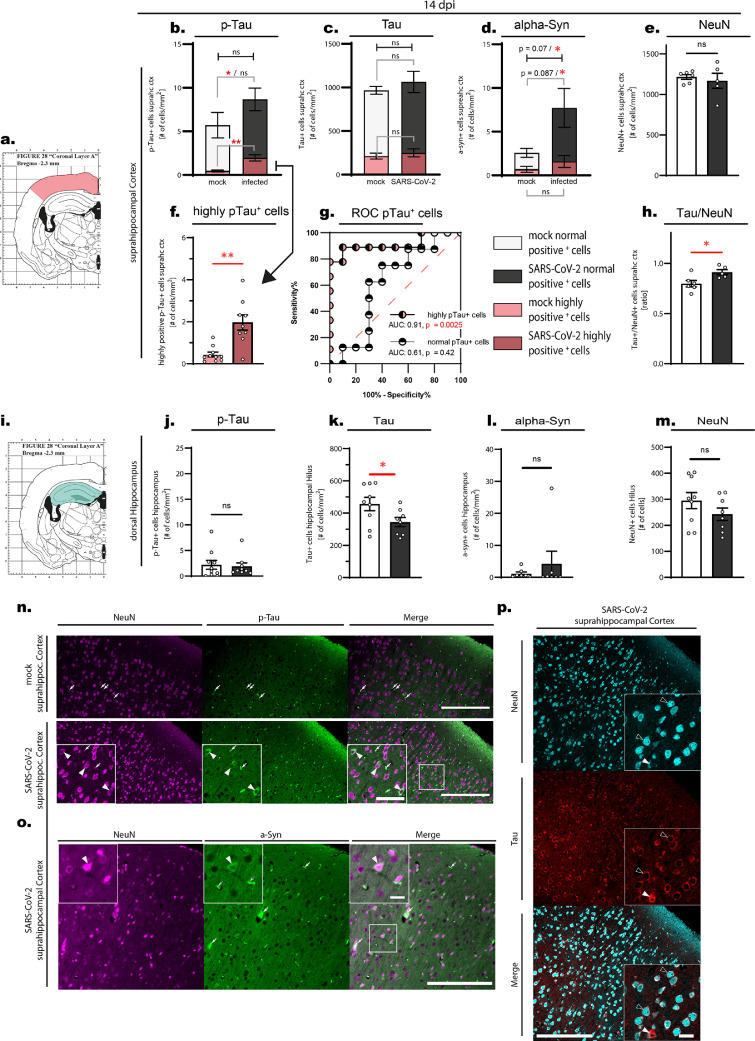
Findings: Viral protein in the nasal cavity led to pronounced microglia activation in the olfactory bulb beyond viral clearance. Cortical but not hippocampal neurons accumulated hyperphosphorylated tau and alpha-synuclein, in the absence of overt inflammation and neurodegeneration. Importantly, not all brain regions were affected, which is in line with selective vulnerability.

Interpretation: Thus, despite the absence of virus in brain, neurons develop signatures of proteinopathies that may contribute to progressive neuronal dysfunction. Further in depth analysis of this important mechanism is required.

Funding: Federal Ministry of Health (BMG; ZMV I 1-2520COR501), Federal Ministry of Education and Research (BMBF 01KI1723G), Ministry of Science and Culture of Lower Saxony in Germany (14 - 76103-184 CORONA-15/20), German Research Foundation (DFG; 398066876/GRK 2485/1), Luxemburgish National Research Fund (FNR, Project Reference: 15686728, EU SC1-PHE-CORONAVIRUS-2020 MANCO, no > 101003651).

Keywords: Alpha-synuclein; Animal model; Neurodegenerative disease; Neuroinfection; Tau.


Conflict of interest statement

Declaration of interests The authors declare that they have no conflict of interest.

Figures

Figure 1:
Figure 1
a. Schematic depicting a sagittal-cut hamster skull and the position of nasal turbinates evaluated in this study (blue area). b. Viral S2 protein was stained in olfactory turbinates of hamsters following SARS-CoV-2 or mock infection and infection burden was semiquantitatively scored (no virus, low, medium and high degree of virus). Viral protein could only be stained in infected animals 3 days post infection (compare also Figure 1 c). Statistics: infected vs. mock testing animals with viral antigen vs. no antigen present: p < 0.0001 (fisher‘s test). Data shown represents the number of hamsters with the respective score. c. Immunofluorescent images from nasal tissue stained against IBA1 (myeloid cells), viral S2 protein and DAPI (cell nuclei) from 3 days post infection (mock and SARS-CoV-2 infection). Note the high number of Iba1-positive cells in infected noses compared to the low number of Iba1-positive myeloid cells in the mock infected tissue (hollow arrowheads in Iba-1 (red) images). Also a vast amount of viral S2 protein in different parts of the nasal tissue can be observed (white arrow heads in viral S2 protein (green) images). Artefacts are due to unspecific fluorescence (white arrows). d-k. Statistical evaluation of Iba1-positive cells in different brain regions on 3 dpi (d-g.) and 14 dpi (h-k.). Changes in the number of Iba1-positive cells in 4 different brain regions (d+h. olfactory bulb, e+i. piriform cortex, f+j. hippocampus and g+k. suprahippocampal cortex) are shown as % changes in relation to the mean of mock. Data shown are Box-Plots with mean +/- SEM. Dots represent the individual data values (N). Statistics: mock vs. SARS-CoV-2 infection. * = p < 0.05, *** = p < 0.001 (Mann-Whitney U-test (MWU) and unpaired t-test (t-test)). l. Schematic illustration of the sagitally cut hamster brain from brain atlas (Morrin and Wood, 2001) depicting the evaluated brain regions of the study: Olfactory bulb (violet color, sagittal evaluation), and Coronal Layers A and B. m. Iba1-positive cells (i.e. microglia) in the olfactory bulb from mock and SARS-CoV-2 infected hamsters. While cells from mock infected animals appear to be resting. i.e. they have small cell bodies and fine protrusions (hollow arrowheads), cells from SARS-CoV-2 infected animals appear activated (white arrowheads), i.e. they have enlarged cell bodies and processes, on both 3 and 14 dpi. n. Schematic representation of the suprahippocampal region evaluated. o. Iba1-positive cells in the suprahippocampal Cortex 14 dpi. No overt differences of microglial cells (hollow arrowheads) could be observed between mock and SARS-CoV-2 infected hamsters. Scale bars: Overview images 200 µm, Closeup images 50 µm.
Figure 2:
Figure 2
All data shown is from animals at the time point 14 days post infection. a-h. Evaluation of suprahippocampal p-Tau-positive, Tau-positive, alpha-synuclein-positive and NeuN-positive cells. a. Schematic drawing of the approximate position of the evaluated area. b-f. suprahippocampal p-Tau-positive, Tau-positive, alpha-synuclein-positive and NeuN-positive cells, displayed as number (#) of cells per mm2 of tissue. Note the differentiation in the stacked plots (b-d): the red color area are cells that have been counted as highly positive for the respective staining (cf. Material and methods), the white and gray parts of the bars are cell numbers of all other positively stained cells. Error bars display mean +/- SEM; n=10/group. b. p-Tau normally positive cells p = 0.46 (Mann-Whitney U test (MWU)), p = 0.48 (unpaired t-test (t-test)), highly positive cells p = 0.0015 (MWU), p = 0.0006 (t-test). Pooled cells (i.e. normally and highly positive cells) p = 0.0133 (MWU), p = 0.164 (t-test) c. Tau normally positive and highly positive cells, d. Alpha-synuclein normally and highly positive cells * = p < 0.05 (MWU or t-test). e. NeuN-positive cells, Dots represent the individual data values (N). f. Separate graph of p-Tau high cells from Figure 2 b with individual values. g. Receiver-operating characteristic (ROC) curves for p-Tau-positive cells. While normally p-Tau-positive cells do not perform well in the ROC curve (low AUC), highly p-Tau-positive cells are able to reliably differentiate between infected and mock animal (AUC 0.91, p = 0.0025). h. Ratio between Tau-positive and NeuN-positive cells p = 0.03 (MWU), p = 0.025 (t-test) as mean +/- SEM and individual values (N). i-m. Evaluation of hippocampal p-Tau-positive, Tau-positive, alpha-synuclein-positive and NeuN-positive cells. i. Schematic drawing of the approximate position of the evaluated area: p-Tau-positive and alpha-synuclein-positive cells were counted in the whole hippocampal area (light green), Tau-positive and NeuN-positive cells were counted in the hilus of the dentate gyrus (dark green). j-m. hippocampal p-Tau-positive, Tau-positive, alpha-synuclein-positive and NeuN-positive cells, displayed as number (#) of cells per mm2 of tissue, mean +/- SEM and individual values (N). j. p-Tau-positive cells p = 0.76 (MWU), p = 0.79 (t-test). k. Tau-positive cells p = 0.046 (MWU), p = 0.046 (t-test). l. alpha-synuclein-positive cells p = 0.3 (MWU), p = 0.45 (t-test). m. NeuN-positive cell p = 0.37 (MWU), p = 0.21 (t-test). n-p. Immunofluorescent images from suprahippocampal regions demonstrating stainings. Due to the tissue processing, residual blood is found in the blood vessels and remaining blood cells are unspecifically stained by binding of secondary antibodies (see white arrows for examples. n. NeuN-positive and p-Tau-positive staining in the suprahippocampal cortex comparing mock vs. SARS-CoV-2 infected tissue. White arrowheads point to exemplary cells stained for both NeuN (i.e. neurons) and p-Tau-positive cells. Scale bars: Overview 200 µm, Close-up 50 µm. o. Suprahippocampal cortical tissue of a SARS-CoV-2 infected hamster stained against NeuN and alpha-synuclein. The white arrowhead demonstrates a cell positive for alpha-synuclein and NeuN. Scale bars: Overview 200 µm, Close-up 20 µm. p. Tissue stained against NeuN and Tau in a SARS-CoV-2 infected animal. Hollow arrowheads point to exemplary cells expressing Tau and NeuN. White arrow heads point to a cell with a high amount of Tau staining. Scale bars: Overview 200 µm, Close-up 20 µm.

Comment in

References

    1. Helms J., Kremer S., Merdji H., Clere-Jehl R., Schenck M., Kummerlen C., et al. Neurologic features in severe SARS-CoV-2 infection. N Engl J Med. 2020 - PMC - PubMed
    1. Mao L., Jin H., Wang M., Hu Y., Chen S., He Q., et al. Neurologic manifestations of hospitalized patients with coronavirus disease 2019 in Wuhan, China. JAMA Neurol. 2020 - PMC - PubMed
    1. Varatharaj A., Thomas N., Ellul M.A., Davies N.W.S., Pollak T.A., Tenorio E.L., et al. Neurological and neuropsychiatric complications of COVID-19 in 153 patients: a UK-wide surveillance study. Lancet Psychiatry. 2020;7(10):875–882. - PMC - PubMed
    1. Ellul M.A., Benjamin L., Singh B., Lant S., Michael B.D., Easton A., et al. Neurological associations of COVID-19. Lancet Neurol. 2020;19(9):767–783. - PMC - PubMed
    1. Heneka M.T., Golenbock D., Latz E., Morgan D., Brown R. Immediate and long-term consequences of COVID-19 infections for the development of neurological disease. Alzheimers Res Ther. 2020;12(1):69. - PMC - PubMed