. 2022 Apr 19;41(1):148.
doi: 10.1186/s13046-022-02354-w.

SEMA6A/RhoA/YAP axis mediates tumor-stroma interactions and prevents response to dual BRAF/MEK inhibition in BRAF-mutant melanoma

Affiliations

SEMA6A/RhoA/YAP axis mediates tumor-stroma interactions and prevents response to dual BRAF/MEK inhibition in BRAF-mutant melanoma

Rossella Loria et al. J Exp Clin Cancer Res. .

Abstract

Background: Despite the promise of dual BRAF/MEK inhibition as a therapy for BRAF-mutant (BRAF-mut) melanoma, heterogeneous responses have been observed in patients, thus predictors of benefit from therapy are needed. We have previously identified semaphorin 6A (SEMA6A) as a BRAF-mut-associated protein involved in actin cytoskeleton remodeling. The purpose of the present study is to dissect the role of SEMA6A in the biology of BRAF-mut melanoma, and to explore its predictive potential towards dual BRAF/MEK inhibition.

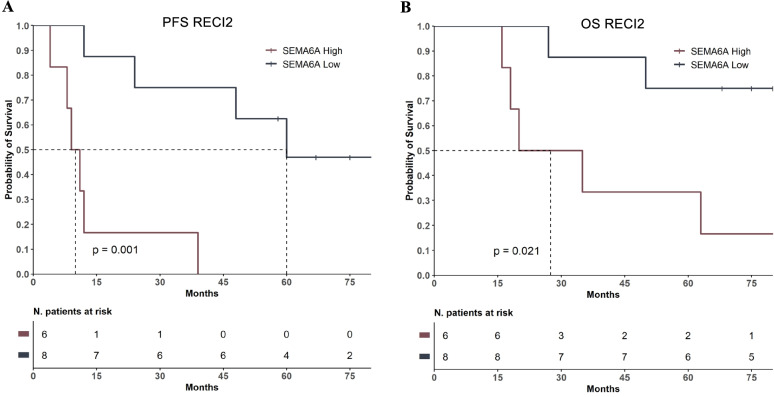
Methods: SEMA6A expression was assessed by immunohistochemistry in melanoma cohort RECI1 (N = 112) and its prognostic potential was investigated in BRAF-mut melanoma patients from DFCI and TCGA datasets (N = 258). The molecular mechanisms regulated by SEMA6A to sustain tumor aggressiveness and targeted therapy resistance were investigated in vitro by using BRAF-mut and BRAF-wt melanoma cell lines, an inducible SEMA6A silencing cell model and a microenvironment-mimicking fibroblasts-coculturing model. Finally, SEMA6A prediction of benefit from dual BRAF/MEK inhibition was investigated in melanoma cohort RECI2 (N = 14).

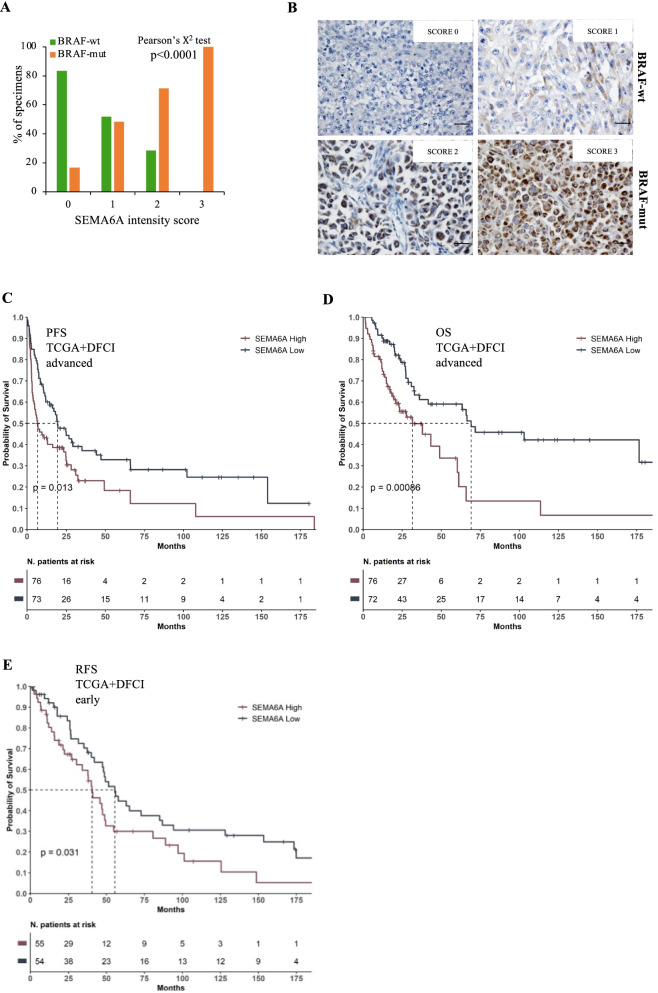
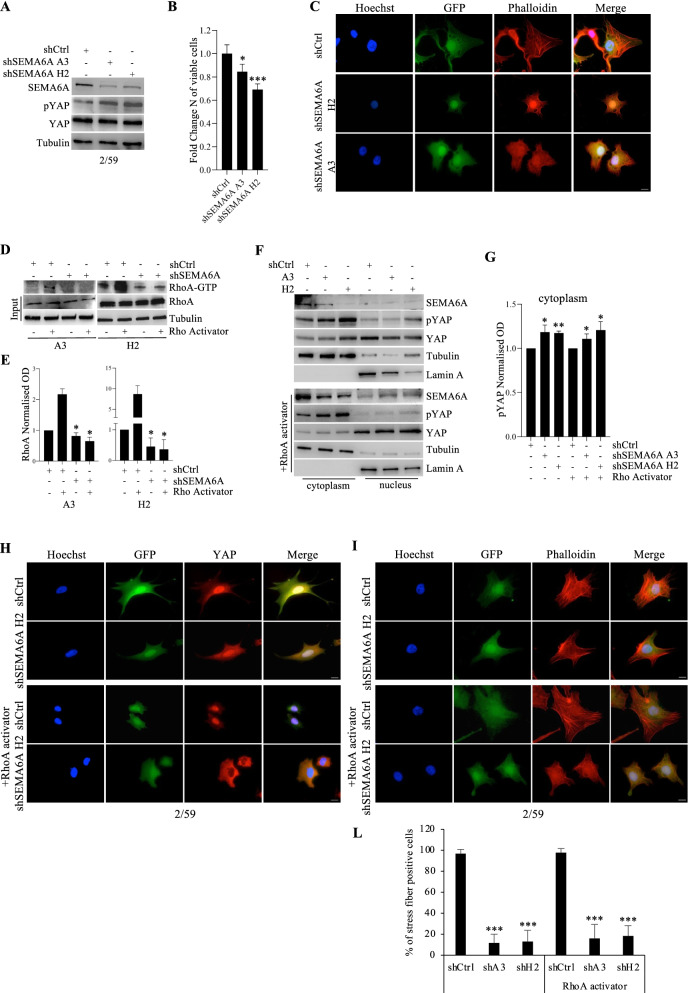
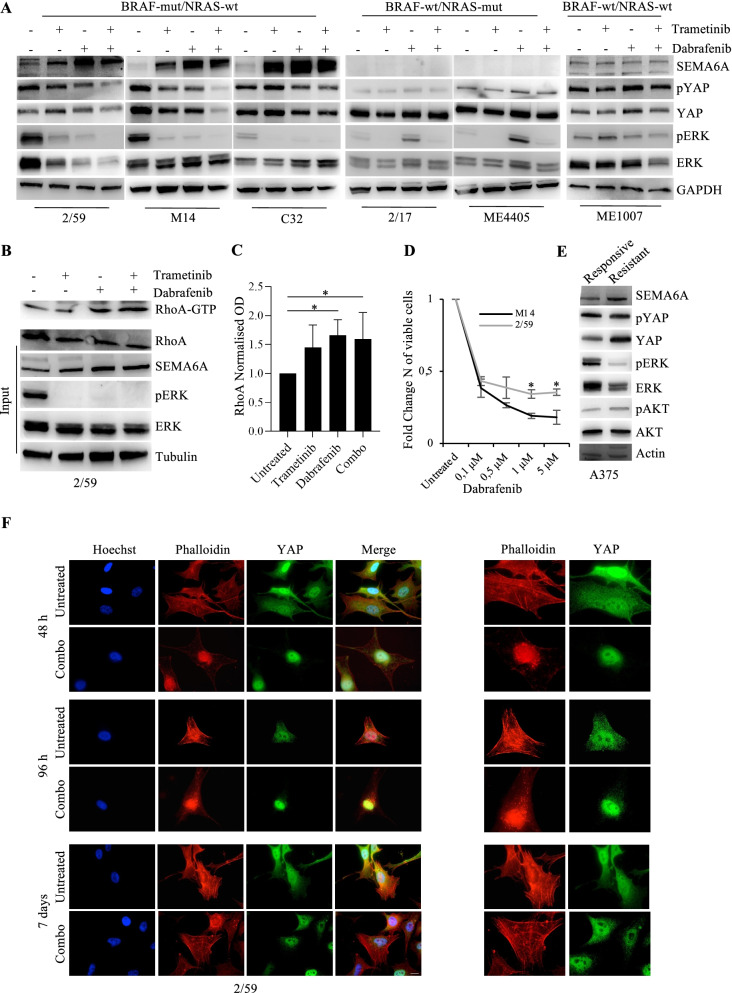
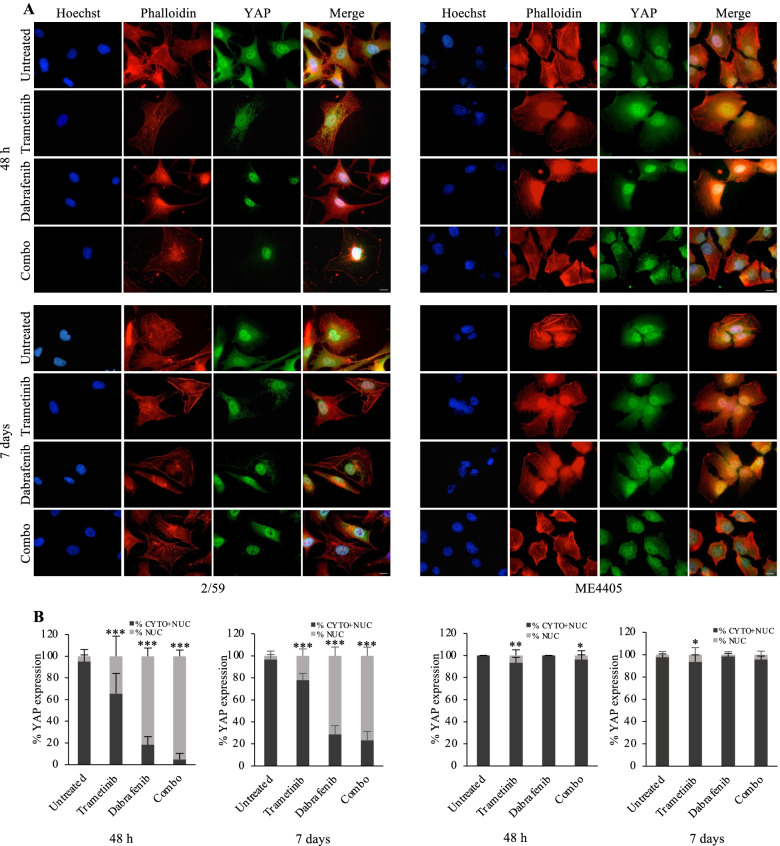
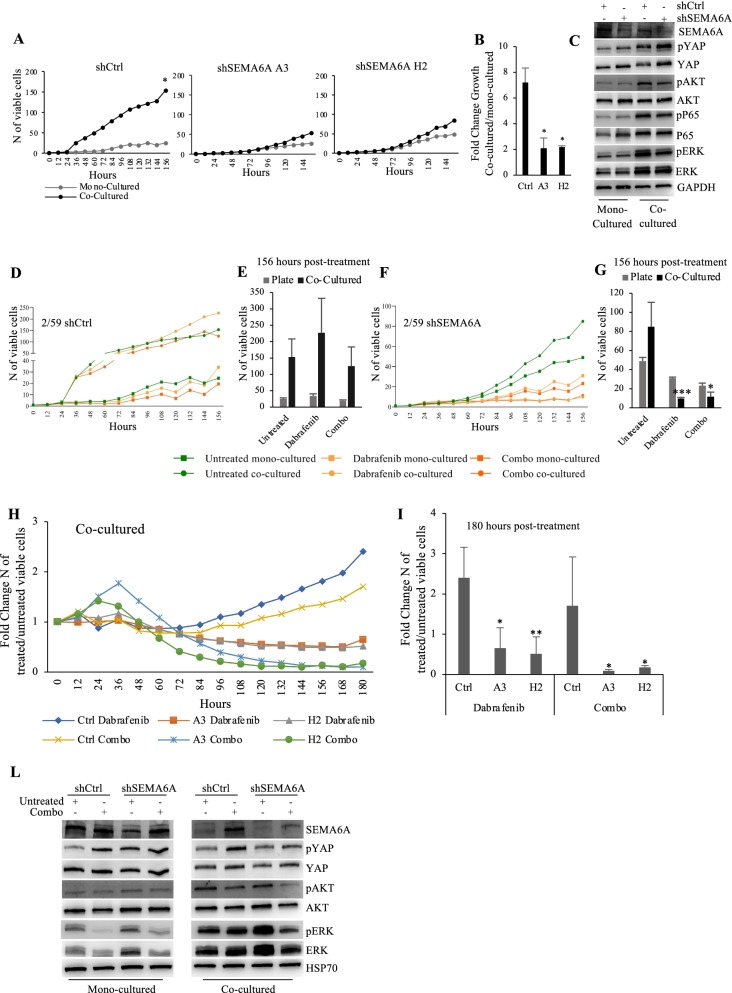
Results: Our results indicate higher protein expression of SEMA6A in BRAF-mut compared with BRAF-wt melanoma patients and show that SEMA6A is a prognostic indicator in BRAF-mut melanoma from TCGA and DFCI patients cohorts. In BRAF-mut melanoma cells, SEMA6A coordinates actin cytoskeleton remodeling by the RhoA-dependent activation of YAP and dual BRAF/MEK inhibition by dabrafenib+trametinib induces SEMA6A/RhoA/YAP axis. In microenvironment-mimicking co-culture condition, fibroblasts confer to melanoma cells a proliferative stimulus and protect them from targeted therapies, whereas SEMA6A depletion rescues the efficacy of dual BRAF/MEK inhibition. Finally, in BRAF-mut melanoma patients treated with dabrafenib+trametinib, high SEMA6A predicts shorter recurrence-free interval.

Conclusions: Overall, our results indicate that SEMA6A contributes to microenvironment-coordinated evasion of melanoma cells from dual BRAF/MEK inhibition and it might be a good candidate predictor of short-term benefit from dual BRAF/MEK inhibition.

Keywords: Actin cytoskeleton remodeling; Dual BRAF/MEK inhibition; Melanoma; Semaphorin SEMA6A; Tumor microenvironment; YAP.


Conflict of interest statement

VF has received speaker fees/advisory boards from Novartis, Bristol Meyers Squibb, MSD and Pierre Fabre, not related to the topic of this manuscript. MM has received honoraria and consultancy fees from Novartis, not related to the topic of this manuscript. The remaining authors declare no competing financial interests.

Figures

Fig. 1
Fig. 1
SEMA6A is a prognostic indicator in BRAF-mut melanoma patients. A: SEMA6A Immunohistochemical assessment in BRAF-wt and BRAF-mut melanoma specimens of RECI1 cohort. Pearson’s Chi-square test revealed a significant association between SEMA6A expression and BRAF mutation (p < 0,0001). B: Representative sections from 2 BRAF-wt and 2 BRAF-mut melanoma patients, stained with anti-SEMA6A antibody. C: Progression-free Survival (PFS) and D: Overall Survival (OS) in patients with with high and low SEMA6A (BRAF-mut advanced melanoma). E: Relapse-free survival (RFS) in patients with high and low SEMA6A (BRAF-mut early melanoma) from the cohorts TCGA and DFCI
Fig. 2
Fig. 2
SEMA6A depletion reduces RhoA activity and induces YAP phosphorylation and cytoplasmic retention in BRAF-mut melanoma cells. A: western blot (WB) analysis of SEMA6A, phosphorylated and total YAP was performed on total cell extracts from inducible shCtrl and shSEMA6A A3 and H2 2/59 cells upon silencing induction. The anti-tubulin antibody was used to validate equivalent amount of loaded proteins in each lane. B: Fold change number of viable A3 and H2 cells compared with shCtrl cells 72 h post-induction. The results are presented as mean +/− standard deviation of three independent experiments (*p < 0.05; *** p < 0,0001). C: shCtr and SEMA6A-depleted A3 and H2 cells were plated on poly-l lysine coated slides and stained with Phalloidin (red signal). GFP reporter gene expression revealed successful silencing induction. The cells were counterstained with Hoechst to highlight nuclei. Scale bar 10 μm. D: WB analysis of activated RhoA (RhoA-GTP) pulled down from cell lysates and total RhoA on cell extracts from shCtrl and SEMA6A-depleted 2/59 cells, treated or not with 1 U/mL RhoA activator. The anti-tubulin antibody was used to validate equivalent amount of loaded proteins in each lane. E: Densitometric analysis of RhoA-GTP normalized to RhoA obtained from shCtrl and SEMA6A-depleted A3 and H2 cell populations treated or not with 1 U/mL RhoA activator. The results are presented as mean+/− standard deviation of three independent experiments (*p < 0.05). F: Cytoplasmic and nuclear fractions extracted from shCtr and A3 and H2 cells, treated or not with RhoA activator, were analyzed by WB for the expression of SEMA6A, phosphorylated and total YAP. Lamin A and α-tubulin were used to validate purity of nuclear and cytoplasmic extracts respectively. G: Densitometric analysis of p-YAP normalized to total YAP in cytoplasmic fraction of shCtrl, A3 and H2 cells treated or not with 1 U/mL RhoA activator. The results are presented as mean+/− standard deviation of three independent experiments (*p < 0.05; ** p < 0,001).. H: shCtr and SEMA6A-depleted H2 cells plated on poly-l lysine coated slides were treated or not with RhoA activator and stained with anti-YAP (red signal) or I: with Phalloidin (red signal). Scale bar 10 μm. L: the number of stress fibers containing cells from the experiment shown in panel I is reported as percentage and at least 200 cells were counted per experiment. The results are presented as mean+/− standard deviation of three independent experiments (*** p < 0,0001)
Fig. 3
Fig. 3
Dabrafenib, trametinib, and their combination induce SEMA6A-RhoA-YAP axis in BRAF-mut melanoma cells. A: BRAF-mut/NRAS-wt 2/59, M14 and C32, BRAF-wt/NRAS-mut 2/17 and ME4405, and BRAF-wt/NRAS-wt ME1007 cell lines were treated with 0,1 μM dabrafenib, 5 nM trametinb and their combination for 48 h. Western blot (WB) analysis of SEMA6A, phosphorylated and total YAP and ERK was performed on total cell extracts from untreated and treated cells. The anti-GAPDH antibody was used to validate equivalent amount of loaded proteins in each lane. B: WB analysis of activated RhoA (RhoA-GTP) pulled down from cell lysates and RhoA, SEMA6A, phosphorylated and total ERK on total cell extracts from untreated and treated 2/59 cells as specified. The anti-tubulin antibody was used to validate equivalent amount of loaded proteins in each lane. C: Densitometric analysis of RhoA-GTP normalized to RhoA is reported. The results are presented as mean+/− standard deviation of three independent experiments (*p < 0.05). D: 2/59 and M14 expressing high and low SEMA6A respectively were treated with different doses of dabrafenib for 48 h. The results are reported as fold change of viable cells compared to untreated cells. The results are presented as mean+/− standard deviation of three independent experiments (*p < 0.05). E: WB analysis of SEMA6A, phosphorylated and total YAP, ERK, and AKT was performed on total cell extracts from A375 cells sensitive and resistant to dabrafenib. The anti-actin antibody was used to validate equivalent amount of loaded proteins in each lane. F: BRAF-mut 2/59 cells plated on poly-l lysine coated slides were treated or not with dabrafenib+trametinib for 48 h, 96 h and 7 days, and stained with anti-YAP (green signal) and Phalloidin (red signal). The cells were counterstained with Hoechst to highlight nuclei. Scale bar 10 μm. Magnification of Phalloidin and YAP images is reported in right most panels
Fig. 4
Fig. 4
Dabrafenib- and dabrafenib+trametinib-induced SEMA6A-RhoA-YAP axis activation rescues actin cytoskeleton in BRAF-mut melanoma cells. A: BRAF-mut 2/59 and BRAF-wt ME4405 cells plated on poly-l lysine coated slides were treated or not with dabrafenib, trametinib and their combination for 48 h and 7 days, and stained with anti-YAP (green signal) and Phalloidin (red signal). The cells were counterstained with Hoechst to highlight nuclei. Scale bar 10 μm. B: Quantification of the subcellular localization of YAP from immunofluorescence of 2/59 and ME4405 cells untreated and treated with dabrafenib, trametinib and their combination for 48 h and 7 days. The results are reported as percentage of YAP expression in cytoplasmic + nuclear and nuclear fractions and at least 200 cells were counted per experiment. The results are presented as mean+/− standard deviation of three independent experiments (*p < 0.05; ** p < 0,001; *** p < 0,0001)
Fig. 5
Fig. 5
SEMA6A depletion restores responsiveness to dabrafenib and dabrafenib+trametinib in fibroblasts co-cultured BRAF-mut melanoma cells. A: Growth curves of mono-cultured and fibroblasts-cocultured shCtrl and SEMA6A-depleted A3 and H2 2/59 cells, periodically monitored up to 156 h. The results are presented as mean+/− standard deviation of three independent experiments (*p < 0.05). B: Fold change growth of co-cultured vs mono-cultured shCtrl and SEMA6A-depleted A3 and H2 cells as reported in A. C: Western blot (WB) analysis of SEMA6A, phosphorylated and total YAP, AKT, P65 and ERK was performed on total cell extracts from shCtrl and SEMA6A-depleted H2 cells cultured in the absence or presence of fibroblasts for 48 h. The anti-GAPDH antibody was used to validate equivalent amount of loaded proteins in each lane. D and F: Growth curves of mono-cultured and co-cultured shCtrl (D) and SEMA6A-depleted H2 cells (F), untreated or treated with 0,1 μM dabrafenib and 0,1 μM dabrafenib+ 5 nM trametinib, periodically monitored up to 156 h. E and G: the number of viable mono-cultured and co-cultured shCtrl (E) and SEMA6A-depleted H2 cells (G) 156 h post-treatment is reported. The results are presented as mean+/− standard deviation of three independent experiments (*p < 0.05; *** p < 0,0001). H: Growth curves of fibroblasts-cocultured shCtrl and SEMA6A-depleted A3 and H2 cells, untreated or treated as indicated, periodically monitored up to 180 h. The results are reported as Fold Change number of treated/untreated viable cells. I: Fold Change number of treated/untreated viable co-cultured shCtrl and SEMA6A-depleted A3 and H2 cells 180 h post-treatment is reported. The results are presented as mean+/− standard deviation of three independent experiments (*p < 0.05; **p < 0,001). L: WB analysis of SEMA6A, phosphorylated and total YAP, AKT, and ERK was performed on total cell extracts from mono-cultured and fibroblasts-cocultured shCtrl and SEMA6A-depleted H2 cells, untreated and treated as indicated for 48 h. The anti-HSP70 antibody was used to validate equivalent amount of loaded proteins in each lane
Fig. 6
Fig. 6
SEMA6A expression predicts low efficacy of dabrafenib+trametinib in BRAF-mut melanoma patients. A: Progression-free Survival (PFS) and B: Overall Survival (OS) in patients with high and low SEMA6A from the cohort RECI2

References

    1. Lawrence MS, Stojanov P, Polak P, Kryukov GV, Cibulskis K, Sivachenko A, et al. Mutational heterogeneity in cancer and the search for new cancer-associated genes. Nature. 2013;499:214–218. doi: 10.1038/nature12213. - DOI - PMC - PubMed
    1. Fattore L, Mancini R, Acunzo M, Romano G, Laganà A, Pisanu ME, et al. miR-579-3p controls melanoma progression and resistance to target therapy. P Natl Acad Sci USA. 2016;8:E5005–E5013. - PMC - PubMed
    1. Mannavola F, Tucci M, Felici C, Passarelli A, D’Oronzo S, Silvestri F. Tumor-derived exosomes promote the in vitro osteotropism of melanoma cells by activating the SDF-1/CXCR4/CXCR7 axis. J Transl Med. 2019;17:230. doi: 10.1186/s12967-019-1982-4. - DOI - PMC - PubMed
    1. Dror S, Sander L, Schwartz H, Sheinboim D, Barzilai A, Dishon Y, et al. Melanoma miRNA trafficking controls tumour primary niche formation. Nat Cell Biol. 2016;18:1006–1017. doi: 10.1038/ncb3399. - DOI - PubMed
    1. Hunter Shain A, Yeh I, Kovalyshyn I, Sriharan A, Talevich E, Gagnon A, et al. The genetic evolution of melanoma from precursor lesions. N Engl J Med. 2015;373:1926–1936. doi: 10.1056/NEJMoa1502583. - DOI - PubMed

MeSH terms