

The distribution and density of Huntingtin inclusions across the Huntington disease neocortex: regional correlations with Huntingtin repeat expansion independent of pathologic grade
- PMID: 35440014
- PMCID: PMC9020040
- DOI: 10.1186/s40478-022-01364-1
The distribution and density of Huntingtin inclusions across the Huntington disease neocortex: regional correlations with Huntingtin repeat expansion independent of pathologic grade
Abstract
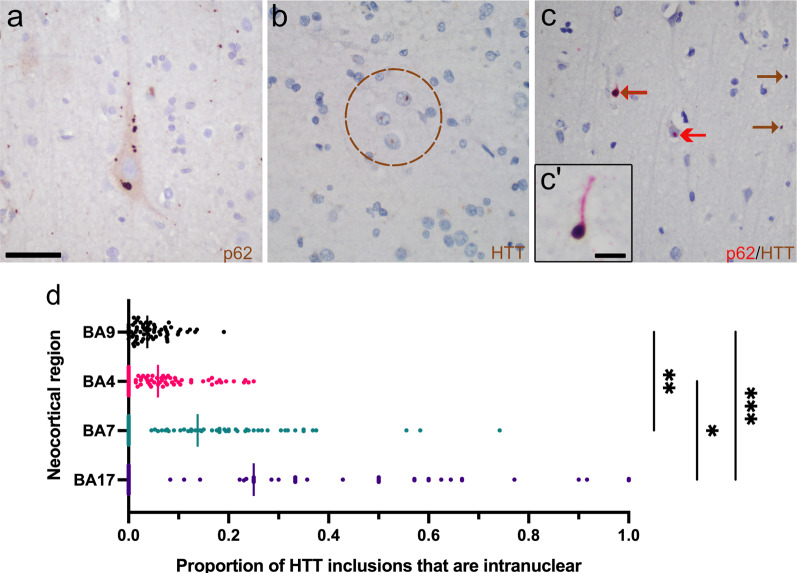
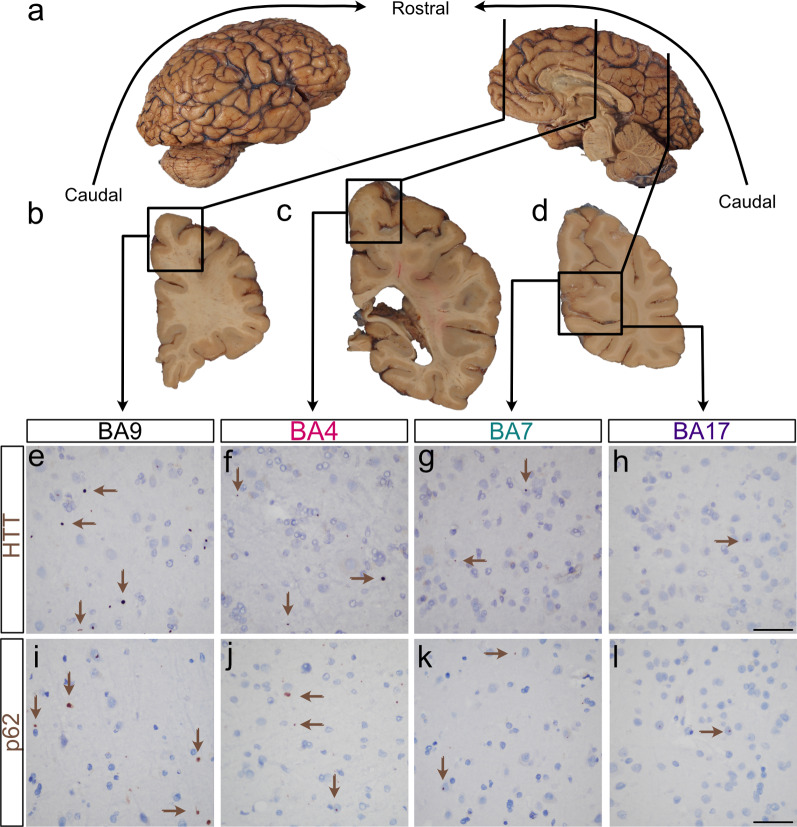
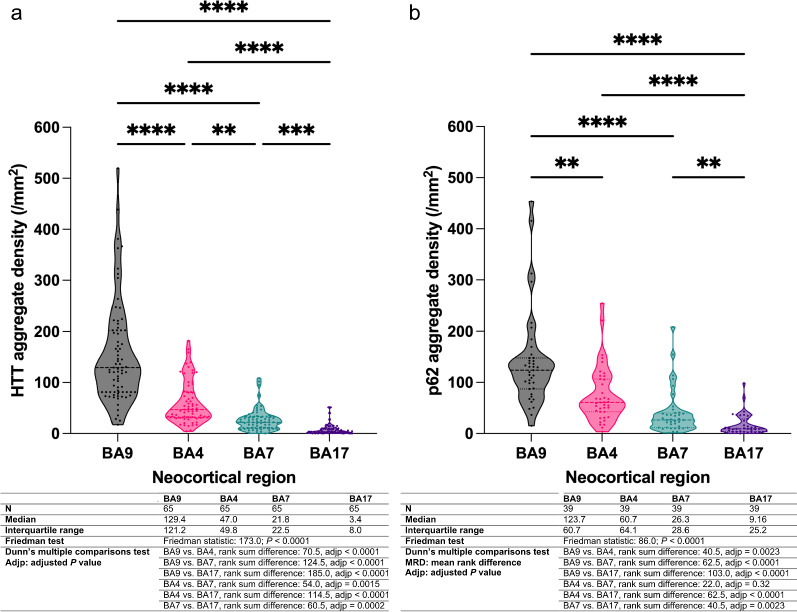
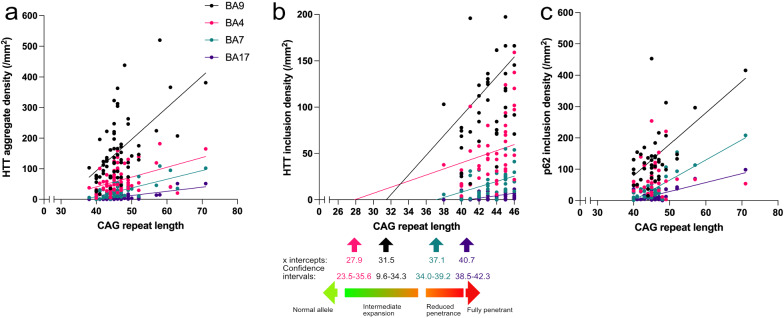
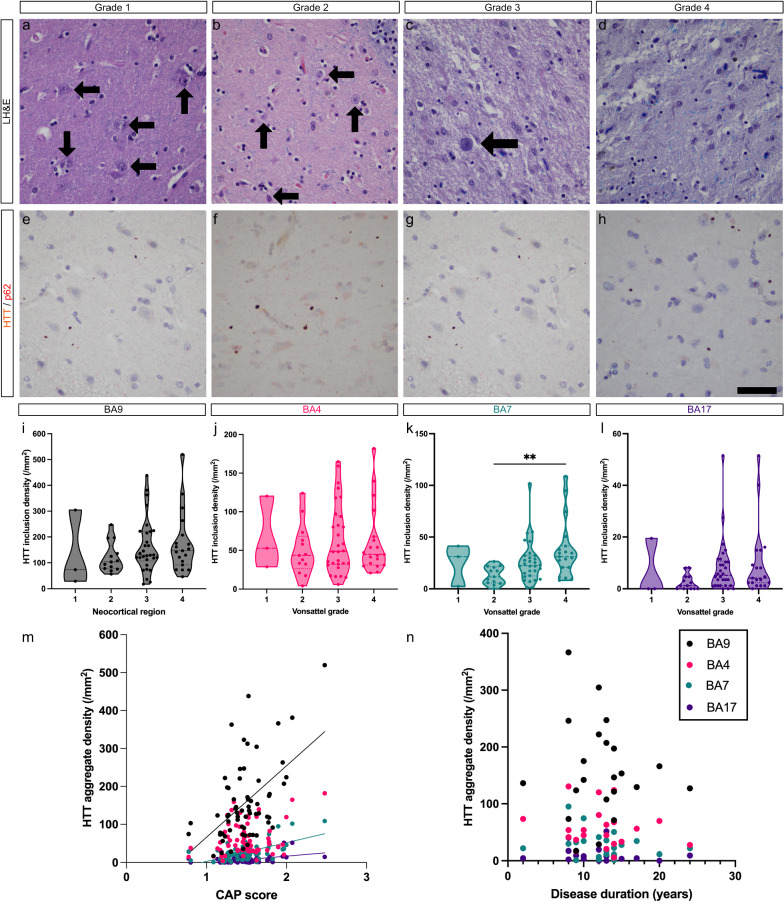
Huntington disease is characterized by progressive neurodegeneration, especially of the striatum, and the presence of polyglutamine huntingtin (HTT) inclusions. Although HTT inclusions are most abundant in the neocortex, their neocortical distribution and density in relation to the extent of CAG repeat expansion in the HTT gene and striatal pathologic grade have yet to be formally established. We immunohistochemically studied 65 brains with a pathologic diagnosis of Huntington disease to investigate the cortical distributions and densities of HTT inclusions within the calcarine (BA17), precuneus (BA7), motor (BA4) and prefrontal (BA9) cortices; in 39 of these brains, a p62 immunostain was used for comparison. HTT inclusions predominate in the infragranular cortical layers (layers V-VI) and layer III, however, the densities of HTT inclusions across the human cerebral cortex are not uniform but are instead regionally contingent. The density of HTT and p62 inclusions (intranuclear and extranuclear) in layers V-VI increases caudally to rostrally (BA17 < BA7 < BA4 < BA9) with the median burden of HTT inclusions being 38-fold greater in the prefrontal cortex (BA9) than in the calcarine cortex (BA17). Conversely, intranuclear HTT inclusions prevail in the calcarine cortex irrespective of HTT CAG length. Neocortical HTT inclusion density correlates with CAG repeat expansion, but not with the neuropathologic grade of striatal degeneration (Vonsattel grade) or with the duration of clinical disease since motor onset. Extrapolation of these findings suggest that HTT inclusions are at a regionally-contingent, CAG-dependent, density during the advanced stages of HD. The distribution and density of HTT inclusions in HD therefore does not provide a measure of pathologic disease stage but rather infers the degree of pathogenic HTT expansion.
Keywords: Aggregation; Cortex; HD; Huntingtin; Huntington disease; Inclusion; Neuropathologic staging; Striatum; Trinucleotide repeat.
© 2022. The Author(s).
Conflict of interest statement
The authors declare that they have no competing interests.
Figures
Similar articles
-
Msh2 acts in medium-spiny striatal neurons as an enhancer of CAG instability and mutant huntingtin phenotypes in Huntington's disease knock-in mice.PLoS One. 2012;7(9):e44273. doi: 10.1371/journal.pone.0044273. Epub 2012 Sep 7. PLoS One. 2012. PMID: 22970194 Free PMC article.
-
Developmental malformations in Huntington disease: neuropathologic evidence of focal neuronal migration defects in a subset of adult brains.Acta Neuropathol. 2021 Mar;141(3):399-413. doi: 10.1007/s00401-021-02269-4. Epub 2021 Jan 30. Acta Neuropathol. 2021. PMID: 33517535 Free PMC article.
-
Neuronal intranuclear and neuropil inclusions for pathological assessment of Huntington's disease.Brain Pathol. 2007 Jan;17(1):31-7. doi: 10.1111/j.1750-3639.2006.00040.x. Brain Pathol. 2007. PMID: 17493035 Free PMC article.
-
The selective vulnerability of nerve cells in Huntington's disease.Neuropathol Appl Neurobiol. 2001 Feb;27(1):1-21. doi: 10.1046/j.0305-1846.2001.00299.x. Neuropathol Appl Neurobiol. 2001. PMID: 11298997 Review.
-
Selective degeneration in YAC mouse models of Huntington disease.Brain Res Bull. 2007 Apr 30;72(2-3):124-31. doi: 10.1016/j.brainresbull.2006.10.018. Epub 2006 Nov 16. Brain Res Bull. 2007. PMID: 17352936 Review.
Cited by
-
An Update on Parkinson's Disease and its Neurodegenerative Counterparts.Curr Med Chem. 2024;31(19):2770-2787. doi: 10.2174/0929867330666230403085733. Curr Med Chem. 2024. PMID: 37016529 Review.
-
Small striatal huntingtin inclusions in patients with motor neuron disease with reduced penetrance and intermediate HTT gene expansions.Hum Mol Genet. 2024 Nov 8;33(22):1966-1974. doi: 10.1093/hmg/ddae137. Hum Mol Genet. 2024. PMID: 39270726 Free PMC article.
-
Huntington's disease cellular phenotypes are rescued non-cell autonomously by healthy cells in mosaic telencephalic organoids.Nat Commun. 2024 Aug 2;15(1):6534. doi: 10.1038/s41467-024-50877-x. Nat Commun. 2024. PMID: 39095390 Free PMC article.
-
Early detection of exon 1 huntingtin aggregation in zQ175 brains by molecular and histological approaches.Brain Commun. 2023 Jan 20;5(1):fcad010. doi: 10.1093/braincomms/fcad010. eCollection 2023. Brain Commun. 2023. PMID: 36756307 Free PMC article.
-
A CAG repeat threshold for therapeutics targeting somatic instability in Huntington's disease.Brain. 2024 May 3;147(5):1784-1798. doi: 10.1093/brain/awae063. Brain. 2024. PMID: 38387080 Free PMC article.
References
-
- Comparing slopes and intercepts https://www.graphpad.com/guides/prism/7/curve-fitting/reg_comparingslope...
-
- Becher MW, Kotzuk JA, Sharp AH, Davies SW, Bates GP, Price DL, Ross CA. Intranuclear neuronal inclusions in Huntington's disease and dentatorubral and pallidoluysian atrophy: correlation between the density of inclusions and IT15 CAG triplet repeat length. Neurobiol Dis. 1998;4:387–397. doi: 10.1006/nbdi.1998.0168. - DOI - PubMed
Publication types
MeSH terms
Substances
Grants and funding
LinkOut - more resources
Full Text Sources
Medical
