. 2022 Apr 19;23(1):101.
doi: 10.1186/s13059-022-02656-4.

Experimental demonstration and pan-structurome prediction of climate-associated riboSNitches in Arabidopsis

Affiliations

Experimental demonstration and pan-structurome prediction of climate-associated riboSNitches in Arabidopsis

Ángel Ferrero-Serrano et al. Genome Biol. .

Abstract

Background: Genome-wide association studies (GWAS) aim to correlate phenotypic changes with genotypic variation. Upon transcription, single nucleotide variants (SNVs) may alter mRNA structure, with potential impacts on transcript stability, macromolecular interactions, and translation. However, plant genomes have not been assessed for the presence of these structure-altering polymorphisms or "riboSNitches."

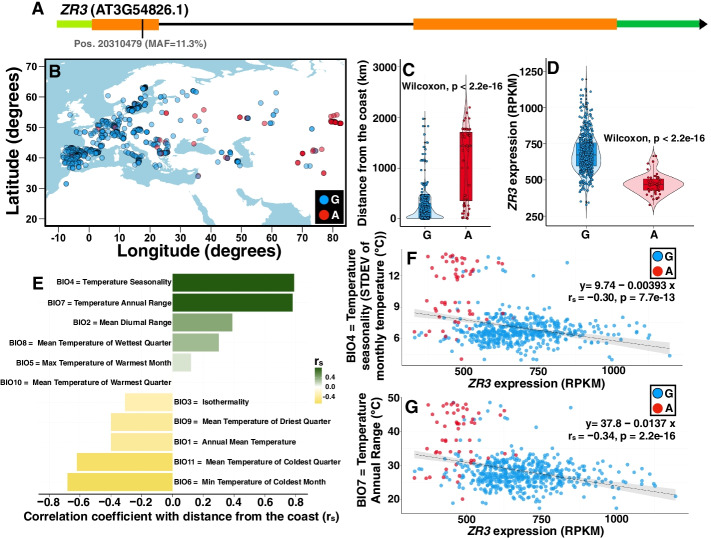
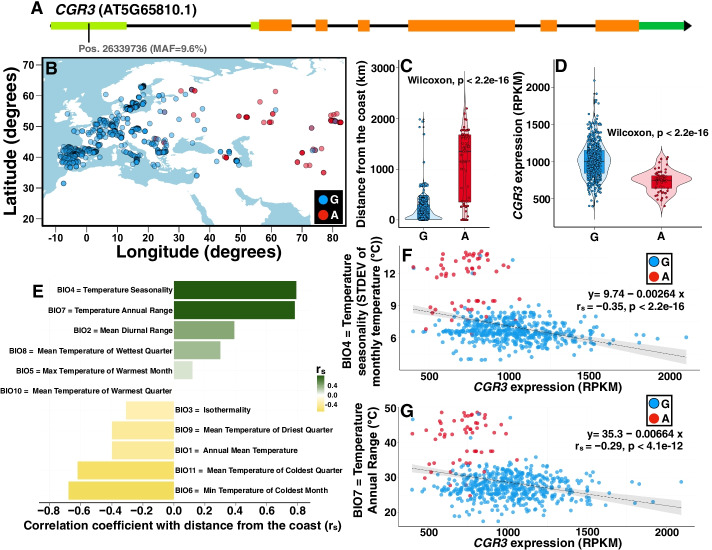
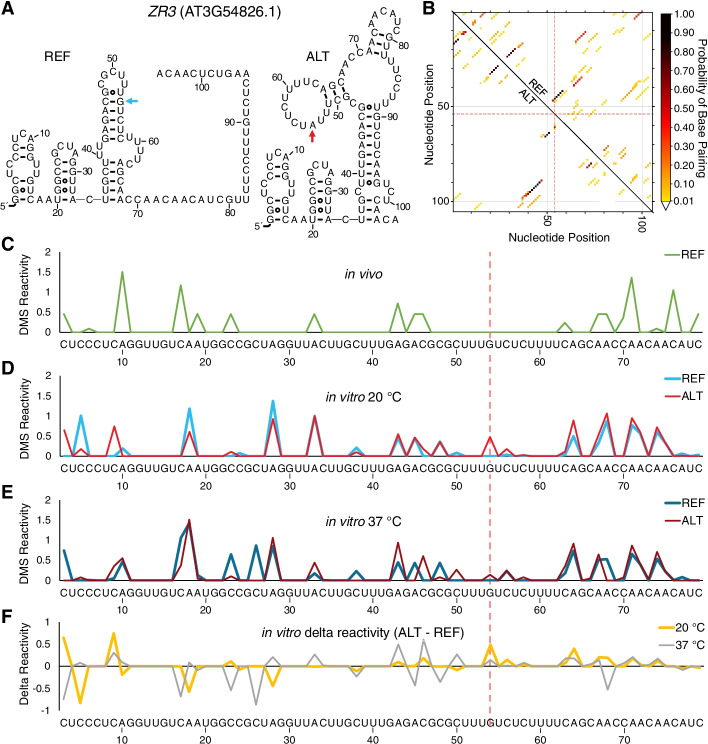
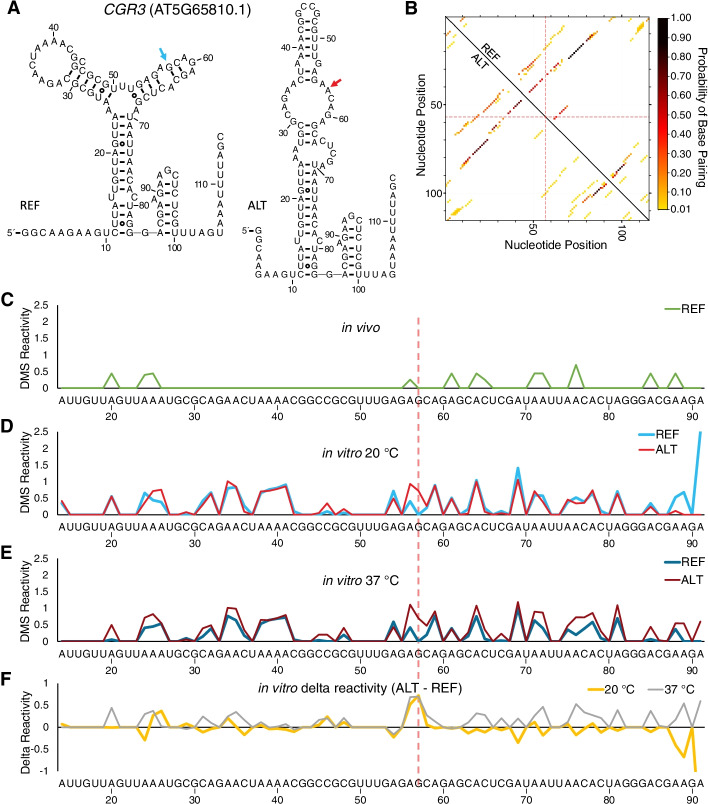
Results: We experimentally demonstrate the presence of riboSNitches in transcripts of two Arabidopsis genes, ZINC RIBBON 3 (ZR3) and COTTON GOLGI-RELATED 3 (CGR3), which are associated with continentality and temperature variation in the natural environment. These riboSNitches are also associated with differences in the abundance of their respective transcripts, implying a role in regulating the gene's expression in adaptation to local climate conditions. We then computationally predict riboSNitches transcriptome-wide in mRNAs of 879 naturally inbred Arabidopsis accessions. We characterize correlations between SNPs/riboSNitches in these accessions and 434 climate descriptors of their local environments, suggesting a role of these variants in local adaptation. We integrate this information in CLIMtools V2.0 and provide a new web resource, T-CLIM, that reveals associations between transcript abundance variation and local environmental variation.

Conclusion: We functionally validate two plant riboSNitches and, for the first time, demonstrate riboSNitch conditionality dependent on temperature, coining the term "conditional riboSNitch." We provide the first pan-genome-wide prediction of riboSNitches in plants. We expand our previous CLIMtools web resource with riboSNitch information and with 1868 additional Arabidopsis genomes and 269 additional climate conditions, which will greatly facilitate in silico studies of natural genetic variation, its phenotypic consequences, and its role in local adaptation.

Keywords: Arabidopsis thaliana; CLIMtools; Genome-wide association study (GWAS); Single nucleotide variant (SNV); Structurome; Transcriptome-wide association study (TWAS); riboSNitch.


Conflict of interest statement

The authors declare that they have no competing interests.

Figures

Fig. 1
Fig. 1
Allele distribution in a synonymous SNP in ZR3 and its cis-regulated transcript abundance are correlated with the distance from the coast and temperature variability. A We explored an environmental cline in a SNP with a synonymous effect in ZR3 (position chr3:20310479). Green indicates UTRs, orange indicates exons, and black indicates the sole intron. B The map of Eurasia shows the geographical distribution of the allelic variants of this SNP. Blue dots show the distribution of accessions with the major allele (“G,” for guanine), while red dots show the geographical distribution of accessions harboring the minor allele (“A,” for adenine). C Given the geographic distribution of both alleles, the probability of encountering an accession with the minor allele increases in accessions more distant from the coastline. D Violin plots illustrating significantly different probability densities of ZR3 transcript abundance for the major and minor alleles of the SNP depicted in A. E Distance from the coast determines the temperature variability that accessions encounter in their local environment. F, G As plants endure a higher degree of temperature variability inland (y-axis in F and G), the probability of harboring a minor allele (red dots) at site 20,310,479 increases. At the same time, the transcript abundance of ZR3 (x-axis in F and G) decreases, highlighting the regulatory effect of this SNP and its correlation with temperature variability. The regression is calculated using the transcript abundance data in the combined set of accessions (both major and minor alleles). Distance from the coast was derived from the NASA Ocean Biology processing group dataset. Climate variables are from the WorldClim 2.1 database. MAF, minor allele frequency; STDEV, standard deviation
Fig. 2
Fig. 2
Allele distribution in a SNP in the 5′ UTR of CGR3 and its cis-regulated transcript abundance are correlated with the distance from the coast and temperature variability. A We explored an environmental cline in a SNP in the 5′ UTR of CGR3 (position chr5:26339736). Green indicates UTRs, orange indicates exons, and black indicates introns. B The map of Eurasia shows the geographical distribution of the allelic variants of this SNP. Blue dots show the distribution of accessions with the major allele (G), while red dots show the geographical distribution of accessions harboring the minor allele (A). C Given the geographic distribution of both alleles, the probability of encountering an accession with the minor allele increases in accessions more distant from the coastline. D Violin plots illustrating significantly different probability densities of CGR3 transcript abundance for the major and minor alleles of the SNP depicted in A. E Distance from the coast determines the temperature variability that accessions encounter in their local environment. (Note that these are the same data as in Fig. 1E, reproduced here for ease of comparison with the rest of Fig. 2). F, G As plants endure a higher degree of temperature variability inland (y-axis in F and G), the probability of harboring a minor allele (red dots) at site 26,339,736 increases. At the same time, the transcript abundance of CGR3 (x-axis in F and G) decreases, highlighting the regulatory effect of this SNP and its correlation with temperature variability. The regression is calculated using the transcript abundance data in the combined set of accessions (both major and minor alleles). Distance from the coast was derived from the NASA Ocean Biology processing group dataset. Climate variables are from the WorldClim 2.1 database. MAF, minor allele frequency; STDEV, standard deviatioon
Fig. 3
Fig. 3
SNPs affect the thermal stability of RNA oligonucleotides as shown by UV-detected melts. A Predicted secondary structures of RNA oligonucleotides from AT3G54826 (ZR3) used in the melts. The left-hand structure is the reference, and the right-hand structure is the G-to-A variant. Colored arrows (blue for reference and red for variant) mark the sequence change. B Representative UV-detected thermal denaturation for the reference (blue) and variant (red) from A. This melt was collected at 6.5 μM of the reference and alternative oligonucleotides. C First-derivative plots of the data from B. D As in A but for AT5G65810 (CGR3), also with a G-to-A mutation. E Representative UV-detected thermal denaturation for the reference (blue) and alternative (red) from D. This melt was collected at 4.5 μM of the reference and alternative oligonucleotides. F First-derivative plots of the data from E. Melts of all four sequences at other concentrations are provided in Additional file 4: Fig. S1
Fig. 4
Fig. 4
The G-to-A SNP changes the secondary structure of an RNA segment from ZR3. A Predicted secondary structures for 105-nt ZR3 reference and alternative sequences (chr3:20310428–20310522, 20311150–20311157), including the added GG at the 5′-end added to improve T7 transcription, making the final length 105 nt. The SNP is identified by an arrow. Structures were folded using RNAstructure [38] and outputted using R2R (https://help.rc.ufl.edu/doc/R2R) [40]. B MutaRNA dot plot [39] displays the probability of base pairing of the reference (above the diagonal) and alternative (below the diagonal) sequences. The color scale shows the strength of base pairing probability. The position of the SNP is denoted with dashed red crosshairs. CF DMS reactivity of a 77-nt portion of the ZR3 RNA segment (nucleotides corresponding to the primer binding site for the in vitro probing and compressed data at the top of the gel could not be mapped) is plotted in C from an in vivo dataset from plants grown at 21 °C [6], as well as for two in vitro DMS experiments conducted at D 20 °C and E 37 °C. In vitro DMS reactivity was derived from two sequencing gels provided in Additional file 4: Fig. S2. F The delta DMS reactivity of the alternative and reference sequences at both 20 °C and 37 °C
Fig. 5
Fig. 5
The G-to-A SNP changes the RNA secondary structure of an RNA segment from CGR3. A Predicted secondary structures of 115-nt CGR3 reference and alternative sequences (chr5:26339678–26339792). The SNP is identified by an arrow. Structures were folded using RNAstructure and outputted using R2R (https://help.rc.ufl.edu/doc/R2R) [40]. B MutaRNA dot plot [39] displays the probability of base pairing of the reference (above the diagonal) and alternative (below the diagonal) sequences. The color scale on the right shows the strength of base pairing probability. The position of the SNP is denoted with the dashed red crosshairs. CF DMS reactivity of a 78-nt-long portion of the 115-nt-long CGR3 sequence (nucleotides corresponding to the primer binding site for the in vitro probing and compressed data at the top of the gel could not be mapped) is plotted in C from an in vivo dataset from plants grown at 21 °C [6], as well as for two in vitro DMS experiments conducted at D 20 °C and E 37 °C. In vitro DMS reactivity was derived from two sequencing gels provided in Additional file 4: Fig. S2. F The delta DMS reactivity of alternative and reference sequences at both 20 °C and 37 °C
Fig. 6
Fig. 6
Predicted riboSNitches and non-riboSNitches in the population of 879 Eurasian accessions do not differ in their chromosomal densities and allelic frequencies. A, B The genome-wide SNV density, expressed as number of variants per 100,000 nt, for A 1,038,347 riboSNitches and B 2,791,917 non-riboSNitches. The genome-wide distribution of riboSNitches and non-riboSNitches is not significantly different (Wilcoxon P value > 0.05). Arrowheads depict the centromeric regions with lower SNV densities. C The average SNPfold correlation coefficient does not differ significantly among rare, low-frequency, and common variants (Wilcoxon P value > 0.05). D Among rare variants, at the lowest possible allele frequency (MAC = 1), the ratio of riboSNitches to non-riboSNitches is higher than the expected ratio for rare SNVs (post hoc tests following a chi-square, using the Bonferroni adjustment, P value < 0.001). Significant differences also occur in the opposite direction within rare variants (MAC = 4; post hoc tests following a chi-square, using the Bonferroni adjustment, P value < 0.05). E Table summarizing the frequencies and ratios of candidate riboSNitches and non-riboSNitches

References

    1. Chen R, Davydov EV, Sirota M, Butte AJ. Non-synonymous and synonymous coding SNPs show similar likelihood and effect size of human disease association. PLoS One. 2010;5:e13574. doi: 10.1371/journal.pone.0013574. - DOI - PMC - PubMed
    1. Halvorsen M, Martin JS, Broadaway S, Laederach A. Disease-associated mutations that alter the RNA structural ensemble. PLoS Genet. 2010;6:e1001074. doi: 10.1371/journal.pgen.1001074. - DOI - PMC - PubMed
    1. McCown PJ, Corbino KA, Stav S, Sherlock ME, Breaker RR. Riboswitch diversity and distribution. RNA. 2017;23:995–1011. doi: 10.1261/rna.061234.117. - DOI - PMC - PubMed
    1. Jafarifar F, Dietrich RC, Hiznay JM, Padgett RA. Biochemical defects in minor spliceosome function in the developmental disorder MOPD I. RNA. 2014;20:1078–1089. doi: 10.1261/rna.045187.114. - DOI - PMC - PubMed
    1. Su Z, Tang Y, Ritchey LE, Tack DC, Zhu M, Bevilacqua PC, et al. Genome-wide RNA structurome reprogramming by acute heat shock globally regulates mRNA abundance. Proc Natl Acad Sci U S A. 2018;115:12170–5. - PMC - PubMed

Publication types