. 2022 Apr 19;13(4):377.
doi: 10.1038/s41419-022-04837-2.

UHRF1 establishes crosstalk between somatic and germ cells in male reproduction

Affiliations

UHRF1 establishes crosstalk between somatic and germ cells in male reproduction

Yanqing Wu et al. Cell Death Dis. .

Abstract

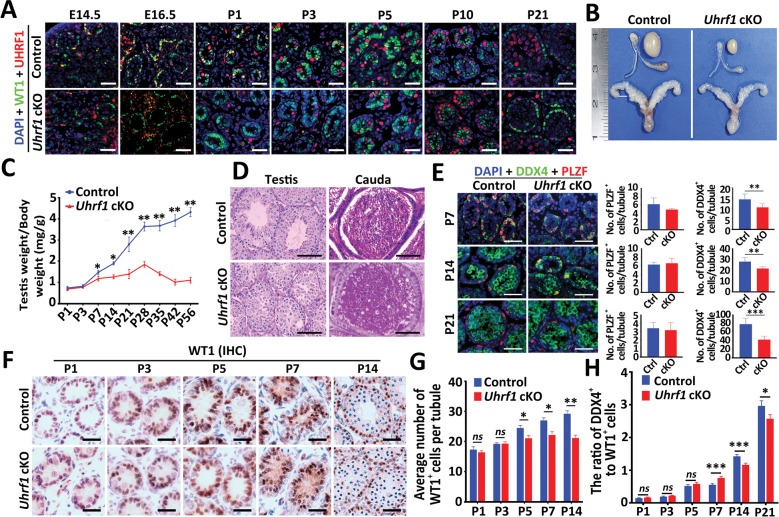
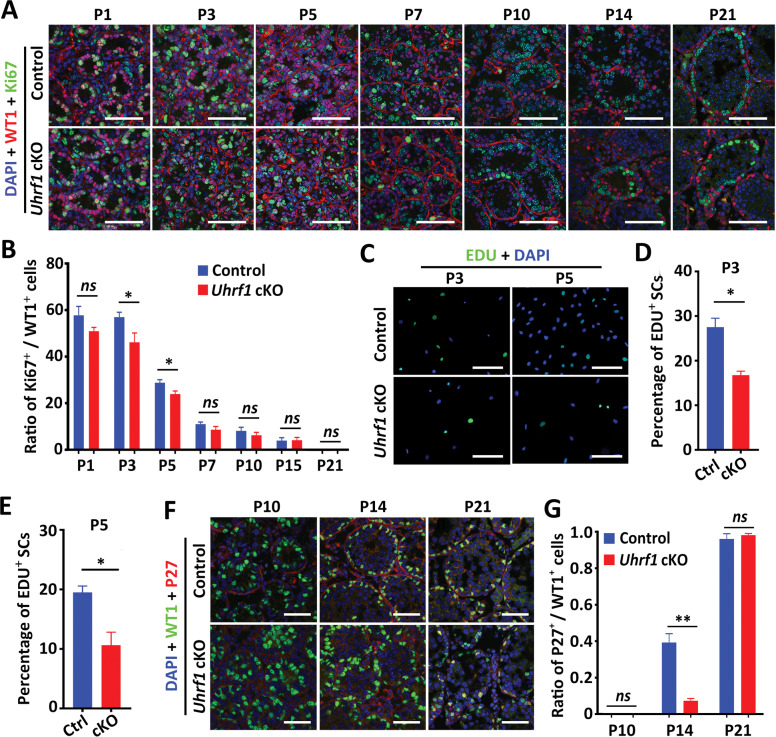
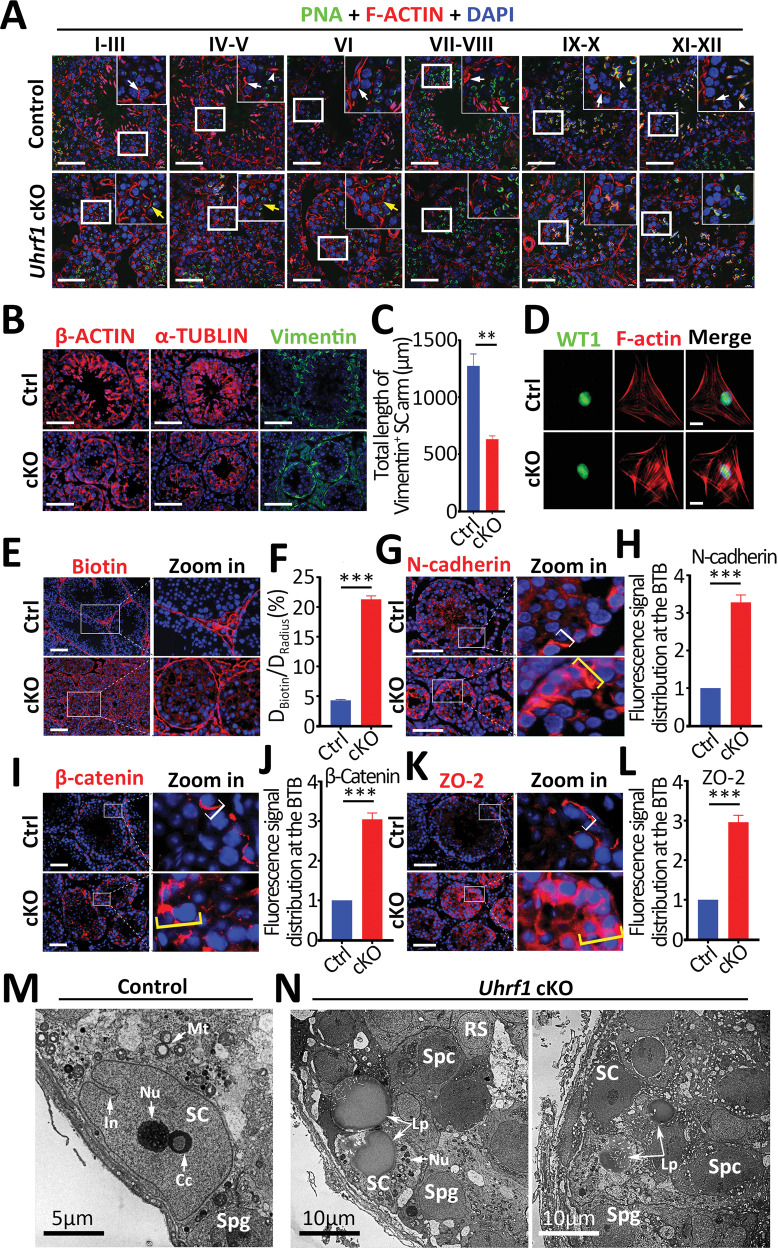
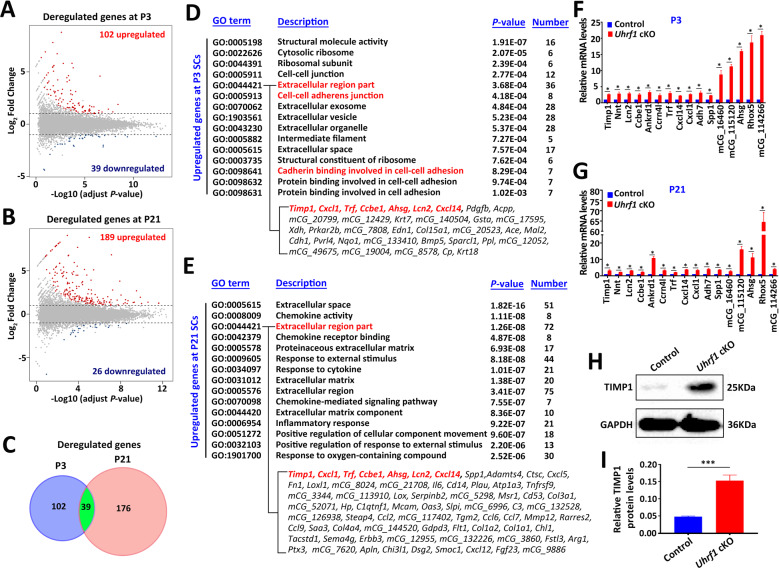
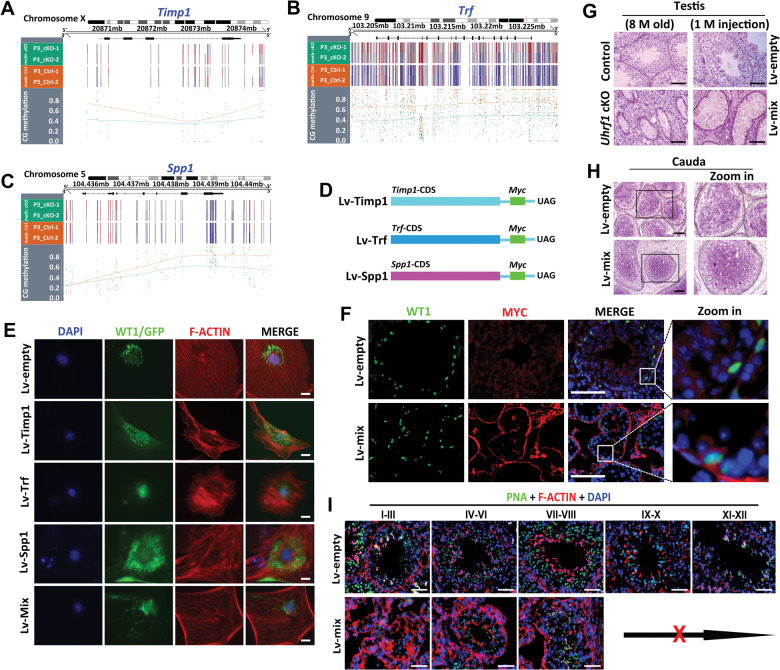
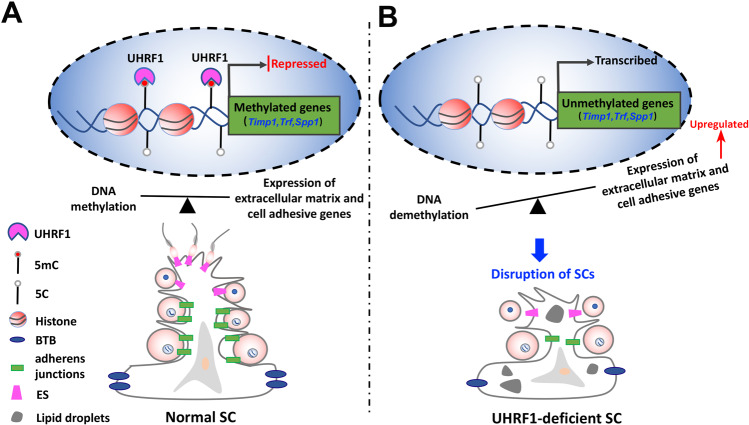
Sertoli cells (SCs) support and nourish germ cells (GCs) through their crosstalk during spermatogenesis. However, the underlying epigenetic mechanism that ensures SCs' functions in this process remains unclear. Here, we report that UHRF1, a critical epigenetic regulator, is mainly expressed in human and mouse pre-mature SCs, and is essential for establishing Sertoli-Germ cell crosstalk. SC-specific UHRF1 knockout mice exhibit complete sterility with Sertoli cell (SC) proliferation and differentiation aberrance, blood-testis barrier (BTB) disruption, and immature germ cell (GC) sloughing. RNA sequencing and Whole Genome Bisulfite Sequencing (WGBS) revealed that many extracellular matrix (ECM)-related genes (e.g., Timp1, Trf, and Spp1) appeared upregulated with the DNA hypomethylation status in UHRF1-deficient SCs. Strikingly, overexpression of Timp1, Trf, and Spp1 in SCs in vitro and in vivo could phenocopy the SC-specific UHRF1-deficient mice. Our data demonstrated that UHRF1 regulates the transcriptional program of ECM-related genes in SCs and establishes SC-GC crosstalk.


Conflict of interest statement

The authors declare no competing interests.

Figures

Fig. 1
Fig. 1. UHRF1 displays a temporal and spatial expression pattern in SCs of both humans and mice.
A Double immunostaining with anti-UHRF1 and anti-WT1 antibodies on wild-type (WT) mouse testicular sections at embryonic day 14.5 (E14.5) and postnatal day 70 (P70) and human testis sections at fetal 20 weeks and adults are shown. Scale bar = 50μm. B, C Co-immunofluorescent staining for UHRF1 and WT1 (a SC marker) on WT mouse testis sections at E14.5, E16.5, E18.5, P1, P3, P5, P7, P10, P14, and P21 are shown. Nuclei were stained with DAPI. Scale bar = 50 μm. D The quantifications of the ratio of both UHRF1+ and WT1+ cells to WT1+ cells per tubule for B and C are shown. Data are shown the mean values ± SEM. For E14.5, E16.5, and E18.5, n = 3 mice; For P1, P3, P5, P7, and P10, n = 5 mice; For P14, P21, and P70, n = 7 mice. Approximately 20–30 round seminiferous tubules per mouse were randomly chosen to count. ***P < 0.001 by one-way ANOVA. E Double immunostaining with anti-UHRF1 and anti-WT1 on isolated primary SCs from P3 and P21 WT testes are shown. Scale bar = 20μm. Right histogram shows the percentage of both UHRF1+ and WT1+ cells to WT1+ cells. Data show mean values ± SEM, n = 3 mice. Approximately 30 round seminiferous tubules per mouse were randomly chosen to count. F Double immunostaining with UHRF1 and WT1 on primary SCs from P21 testes cultured with or without stem cell differentiation inhibitors (1 μM PD0325901 + 10 μM SP600125 + 10 μM SB203580) and 10% FBS for 24 h are shown. Scale bar = 20 μm. G, H Quantification of the percentage of UHRF1-positive cells (G) and cell viability (H) are shown. ns not significant. ***P < 0.001 by unpaired Student’s t-test.
Fig. 2
Fig. 2. Conditional inactivation of Uhrf1 in SCs results in spermatogenic arrest and male infertility in mice.
A Representative co-immunofluorescent staining images for the UHRF1 and WT1 on control and Uhrf1 cKO testes from E14.5, E16.5, P1, P3, P5, P10, and P21 mice are shown. Scale bar = 50 μm. Nuclei were stained with DAPI. B Gross morphology of the testis, epididymis, and seminal vesicle from control and Uhrf1 cKO mice at P56. C Testis growth curve shows that the Uhrf1 cKO testes were significantly decreased from P7. Data are presented as mean ± SEM, n = 3 mice. *P < 0.05, **P < 0.01 by unpaired Student’s t-test. D Periodic acid-Schiff (PAS) staining showing the histology of testis and cauda epididymis sections from control and Uhrf1 cKO mice at P56. Scale bar = 100μm. E Co-immunofluorescent staining of DDX4 and PLZF in testis sections from control and Uhrf1 cKO mice at P7, P14, and P21 is shown. Nuclei were stained with DAPI. Scale bar = 50 μm. The right histograms are showing the quantifications of PLZF+ cells per tubule and DDX4+ cells per tubule at P7, P14, and P21 in control and Uhrf1 cKO mice. Data are presented as mean ± SEM. n = 7 mice for P3; n = 3 mice for P14 and P21. Approximately 30 round seminiferous tubules per mouse were randomly chosen to count. **P < 0.01, ***P < 0.001 by unpaired Student’s t-test. F Immunohistochemical staining of WT1 (a SC marker) in the developmental testis sections from control and Uhrf1 cKO mice at P1, P3, P5, P7, and P14 is shown. Scale bar = 50 μm. G Histogram showing the quantification of WT1-positive cell numbers per tubule in F. Data are presented as mean ± SEM. For P1, P3, and P5, n = 5 mice. For P7 and P14, n = 3 mice. Approximately 10 round seminiferous tubules per mouse were randomly chosen to count. ns, not significant. *P < 0.05, **P < 0.01 by unpaired Student’s t-test. H Histogram showing the ratio of DDX4+ to WT1+ cell numbers per tubule in Supplementary Fig. 2e. For P1, P3, and P5, n = 5 mice. For P7, P14 and P21, n = 3 mice. Approximately 30 round seminiferous tubules per mouse were randomly chosen to count. Data are presented as mean ± SEM. ns not significant. *P < 0.05, **P < 0.01, ***P < 0.001 by unpaired Student’s t-test.
Fig. 3
Fig. 3. UHRF1 deficient SCs exhibit abnormal cell proliferation and differentiation.
A Double immunofluorescent staining of WT1 (red) and Ki67 (green) is shown in both control and Uhrf1 cKO mice at various ages. Nuclei were stained with DAPI. Scale bar =100μm. B The histogram shows that the quantification of the ratio of Ki67+ cells to WT1+ cells per tubule at P1, P3, P5, P7, P10, P14, and P21 in control and Uhrf1 cKO testes. Data are presented as mean ± SD. For P1, P3, P5 and P7, n = 7 mice. For P14 and P21, n = 3 mice. Approximately 30 round seminiferous tubules per mouse were randomly chosen to count. ns, not significant. *P < 0.05 by unpaired Student’s t-test. C Fluorescent staining of EDU in primary SCs isolated from control and Uhrf1 cKO testes at P3 and P5 is shown. Scale bar =50μm. D, E Histograms show the percentage of EDU+ SCs of (D) at P3 (F) and P5 (E). Data are presented as mean ± SEM. n = 5. *P < 0.05 by unpaired Student’s t-test. F Immunofluorescent staining for WT1 (green), P27 (Red), and DAPI (blue) on testis sections from control and Uhrf1 cKO mice at P10, P14, and P21. Scale bar = 50μm. G Quantitation of the ratio of P27+ cells to WT1+ cells are shown from F. Data are presented as mean ± SEM, n = 3 mice. Approximately 30–50 round seminiferous tubules per mouse were randomly chosen to count. ns not significant. **P < 0.01 by unpaired Student’s t-test.
Fig. 4
Fig. 4. Ablation UHRF1 in SCs results in disorganization of SC actin cytoskeleton and severe disruption of the BTB.
A Co-immunofluorescent staining with PNA (peanut agglutinin, green) and F-ACTIN (phalloidin, red) on different testicular stage sections from control and Uhrf1 cKO mice at P42 is shown. Nuclei were stained with DAPI. Scale bar = 50μm. The right corner is an enlarged inset image. White arrows indicate basal ES, white arrowheads indicate apical ES, and yellow arrows indicate ectopically expressed F-ACTIN. B Immunofluorescence of β-actin, α-tubulin, and Vimentin shows that the SC polarity and cytoplasmic arms in the testes of control and Uhrf1 cKO mice at P60. Scale bar = 50μm. C Quantification of Vimentin-positive cell arms in B. The total length of the Vimentin-positive SC arm indicates the sum of all cytoplasmic Vimentin signals reaching from the basal membrane up to the tubular lumen in Vimentin-stained testicular sections. (5–10 separate areas at 200×; n = 3 mice per genotype). Data are presented as mean ± SEM. **P < 0.01 by unpaired Student’s t-test. D Representative images of the F-actin filaments and anti-WT1 co-fluorescence staining in primary SCs from control and Uhrf1 cKO mice at P21. Scale bar = 10μm. E The appearance of biotin tracer dye in the adluminal compartment of seminiferous tubules of adult Uhrf1 cKO mice suggests a leaky BTB, while control mice show restriction of biotin tracer to the basal compartment. Scale bar=100μm. F Histogram showing the quantification of fluorescence distribution of Biotin in E. ***P < 0.001 by unpaired Student’s t-test. Each bar in the histogram presents a mean ± SEM of n = 3 mice, and 50 randomly selected round tubules per mouse were scored. GL Immunofluorescent staining of basal ES proteins N-cadherin (G), β-catenin (I), tight junction protein ZO-2 (K) in control testes and Uhrf1 cKO testes are shown, and histograms summarized results of fluorescence images regarding changes in the relative distribution of N-cadherin (H), β-catenin (J), ZO-2 (L) in Uhrf1 cKO vs. control groups. Each bar in the histogram is a mean ± SEM of n = 4 mice, and 50 randomly selected round tubules were scored. Scale bar = 50μm. ***P < 0.001 by unpaired Student’s t-test. M, N Transmission electron microscopy (TEM) images of control (M) and Uhrf1 cKO (N) testis at P56 are shown. Uhrf1 cKO SCs had abnormally thin cytoplasmic arms, poor adherence to neighboring germ cell gaps, fragmented nucleoli, and massive accumulated lipids, while the control SC cytoplasmic arm was broad and tightly wrapped around germ cells. Abbreviation: SC Sertoli cell, Spg Spermatogonia, Spc Spermatocyte, RS Round spermatid, In indentation of the nuclear membrane, Nu nucleolus, Cc satellite chromocenters, Mt mitochondria, Lp Lipid.
Fig. 5
Fig. 5. UHRF1 in SCs controls a transcriptional program of ECM and cell adhesion.
A, B Volcano plots showing the RNA-seq data obtained from primary SCs of control and Uhrf1 cKO mice at P3 (A) and P21 (B). Red dots indicate genes that were significantly upregulated, and dark blue dots indicate genes that were significantly downregulated (fold change>2, and FDR < 0.05) in Uhrf1 cKO SCs. C The Venn diagram shows 39 common deregulated genes at two developmental time points, P3 and P21. D, E Gene ontology (GO) term analyses of the upregulated genes in Uhrf1 cKO primary SC at P3 (D) and P21 (E) are shown. The top 15 enriched GO pathways in the upregulated genes of P3 are illustrated by gene counts and P-values. Genes related to extracellular region part and cell adhesion were significantly upregulated in P3 and P21 Uhrf1 cKO SCs. F, G RT-qPCR analyses of 16 significant genes to validate RNA-Seq data from P3 (F) and P21 (G) primary SCs. Results are mean ± SEM. n = 3 mice. *P < 0.05 by unpaired Student’s t-test. H Western blot analysis showing TIMP1 protein in P21 primary SCs from control and Uhrf1 cKO testes. GAPDH was used as a loading control. I Quantification of the expression of the protein shows the significantly elevated levels of TIMP1 in Uhrf1 cKO groups. Data are presented as mean ± SEM, n = 3 mice. ***P < 0.001.
Fig. 6
Fig. 6. Overexpression of ECM- and cell adhesion-related genes (Timp1, Trf, and Spp1) results in a similar phenotype with Uhrf1 cKO SCs and testes.
A–C Methylation profile for the Timp1 (A), Trf (B), and Spp1 (C) locus across the genome. D Schematic representation of Timp1, Trf, and Spp1 lentiviral overexpression vectors construction are shown. CDS: gene coding region; Myc: tag protein; UAG: termination codon. E Lentiviral supernatants of Lv-Timp1, Lv-Trf, Lv-Spp1, and three gene vectors mixture (Lv-mix), or Lv-empty alone were transfected into primary SCs of WT mice at P21. WT1 as a SC marker expressed in nuclear. GFP represents the vector expression. Scale bars = 10μm. F Co-immunostaining of WT1 and MYC to verify the overexpression in SCs after 10 days for injection of concentrated lentiviral supernatants of Lv-Timp1/Trf/Spp1 mixed vectors (Lv-mix), or Lv-empty. Scale bars = 100μm. G PAS staining showing the histology of testis sections from control and Uhrf1 cKO mice at 8 months (left), and after 1 month of lentiviral supernatants injection (right). Scale bars = 100μm. H PAS staining showing the histology of cauda epididymis from Lv-empty and Lv-mix mice after 10 days of lentiviral supernatants injection. Scale bars = 100μm. I Co-immunofluorescence of PNA and F-ACTIN on testis sections from Lv-empty and Lv-mix mice after 10 days of lentiviral supernatants injection. Scale bars = 50μm.
Fig. 7
Fig. 7. Working model for the functions of UHRF1 in SCs, as described in the discussion.
A In normal conditions, UHRF1 in SCs controls a coordinated transcriptional program of ECM and cell adhesion genes (Timp1, Trf, and Spp1, et al.) in SCs by regulating its CG methylation, which usually plays a critical role in the coordinated homeostasis of adhesion between SC-GC and the cyclical disassembly versus reassembly of BTB. B In UHRF1-deficient SCs, the expressions of ECM and cell adhesion genes (Timp1, Trf, and Spp1) were upregulated due to their DNA demethylation, which leads to BTB disruption, junction defects, and inadequate cell adhesion, thereby resulting in a massive loss of immature germ cells from the seminiferous epithelium.

Similar articles

Cited by

References

    1. Griswold MD. The central role of Sertoli cells in spermatogenesis. Semin Cell Dev Biol. 1998;9:411–6. doi: 10.1006/scdb.1998.0203. - DOI - PubMed
    1. Johnson L, Thompson DL, Jr., Varner DD. Role of Sertoli cell number and function on regulation of spermatogenesis. Anim Reprod Sci. 2008;105:23–51. doi: 10.1016/j.anireprosci.2007.11.029. - DOI - PubMed
    1. Jegou B. The Sertoli-germ cell communication network in mammals. Int Rev Cytol. 1993;147:25–96. doi: 10.1016/S0074-7696(08)60766-4. - DOI - PubMed
    1. Kessaris DN, Wasserman P, Mellinger BC. Histopathological and cytopathological correlations of percutaneous testis biopsy and open testis biopsy in infertile men. J Urol. 1995;153:1151–5. doi: 10.1016/S0022-5347(01)67535-9. - DOI - PubMed
    1. Morais DSS, Hacker A, Harley V, Goodfellow P, Swain A, Lovell-Badge R. Sox9 expression during gonadal development implies a conserved role for the gene in testis differentiation in mammals and birds. Nat Genet. 1996;14:62–68. doi: 10.1038/ng0996-62. - DOI - PubMed

Publication types

Substances