. 2022 Apr 19;13(1):2080.
doi: 10.1038/s41467-022-29746-y.

Endothelial progenitor cells stimulate neonatal lung angiogenesis through FOXF1-mediated activation of BMP9/ACVRL1 signaling

Affiliations

Endothelial progenitor cells stimulate neonatal lung angiogenesis through FOXF1-mediated activation of BMP9/ACVRL1 signaling

Guolun Wang et al. Nat Commun. .

Abstract

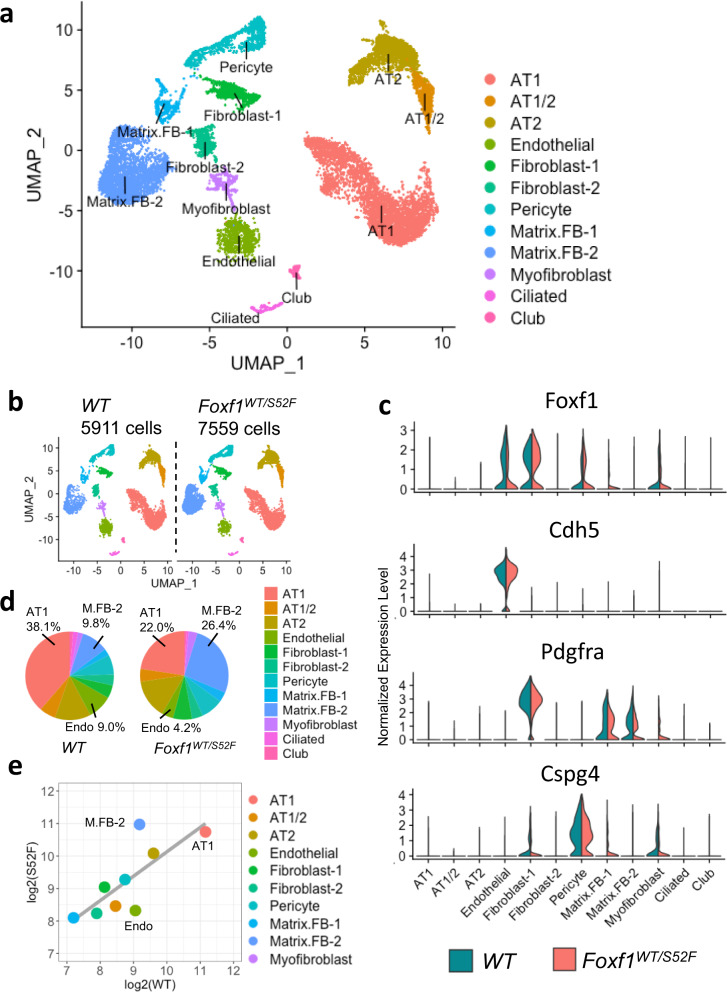
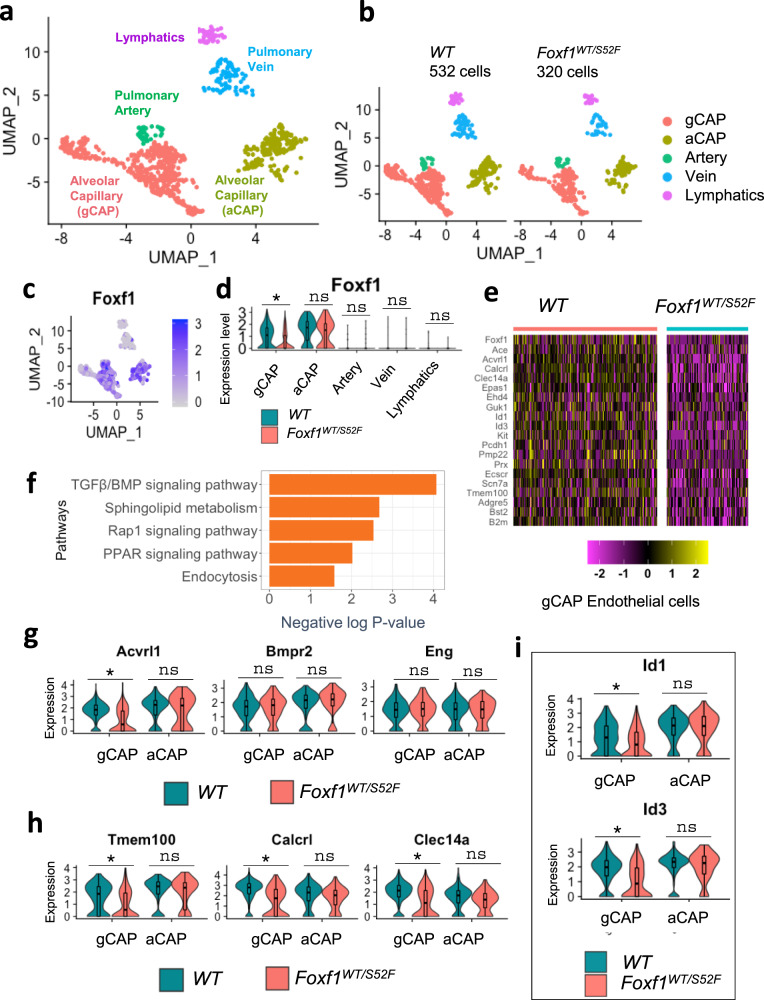
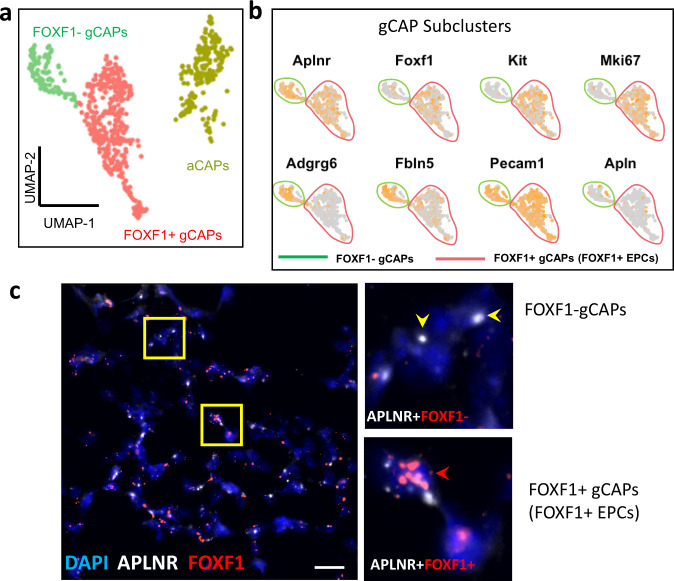
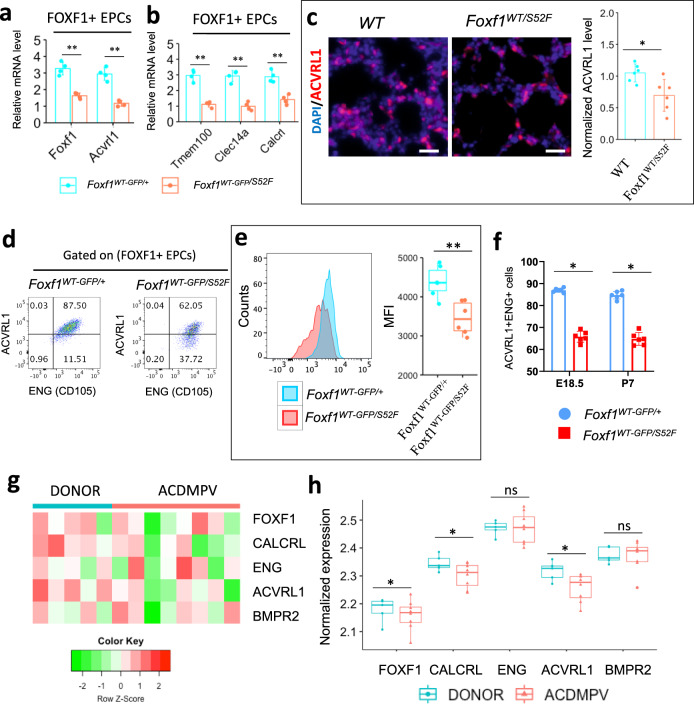
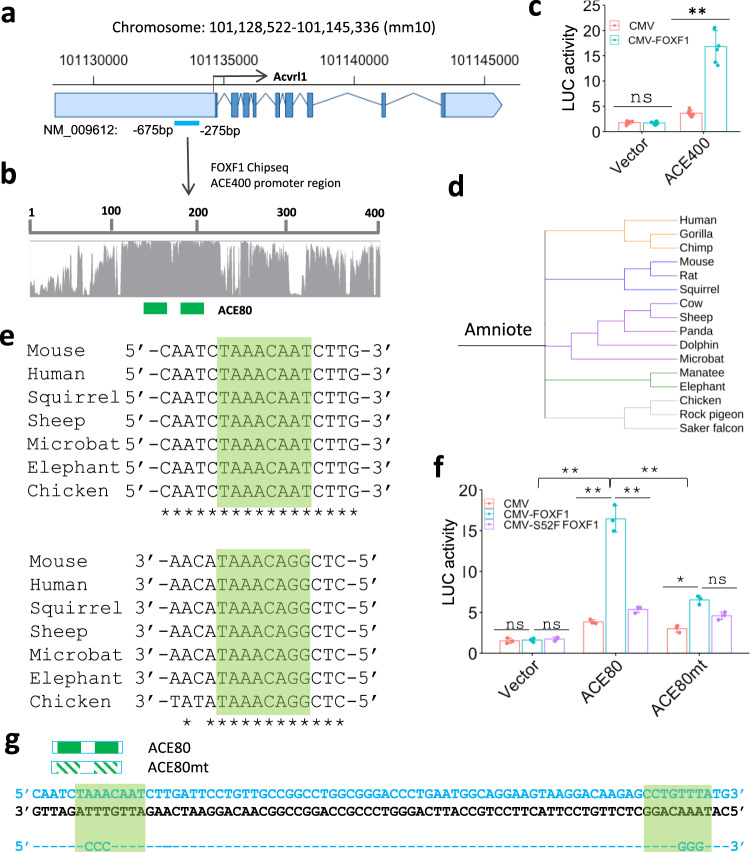
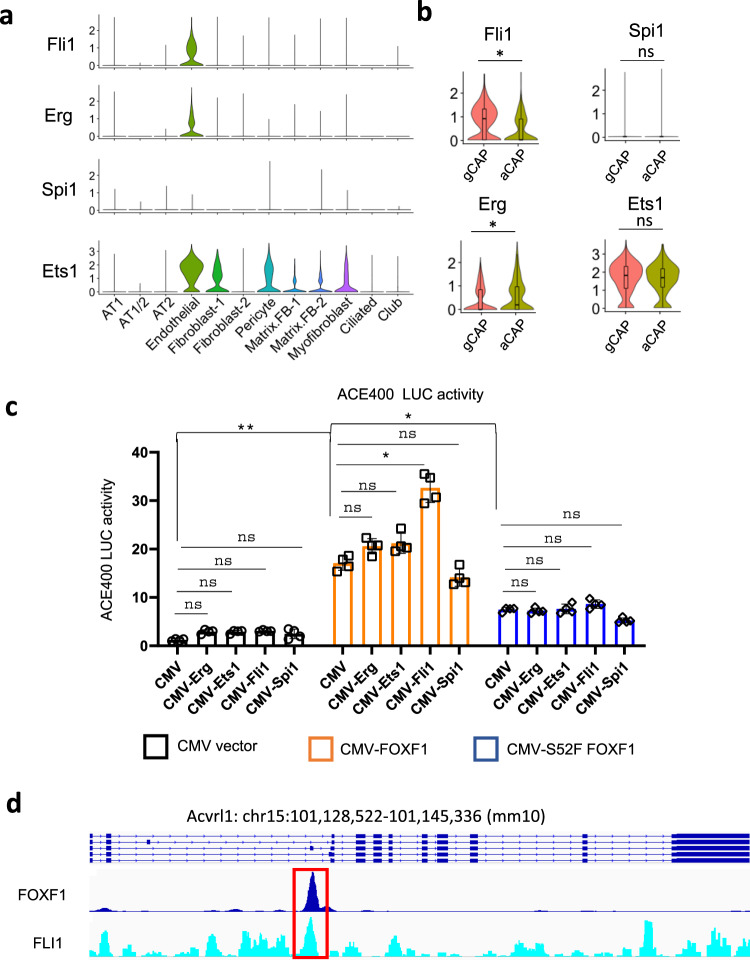
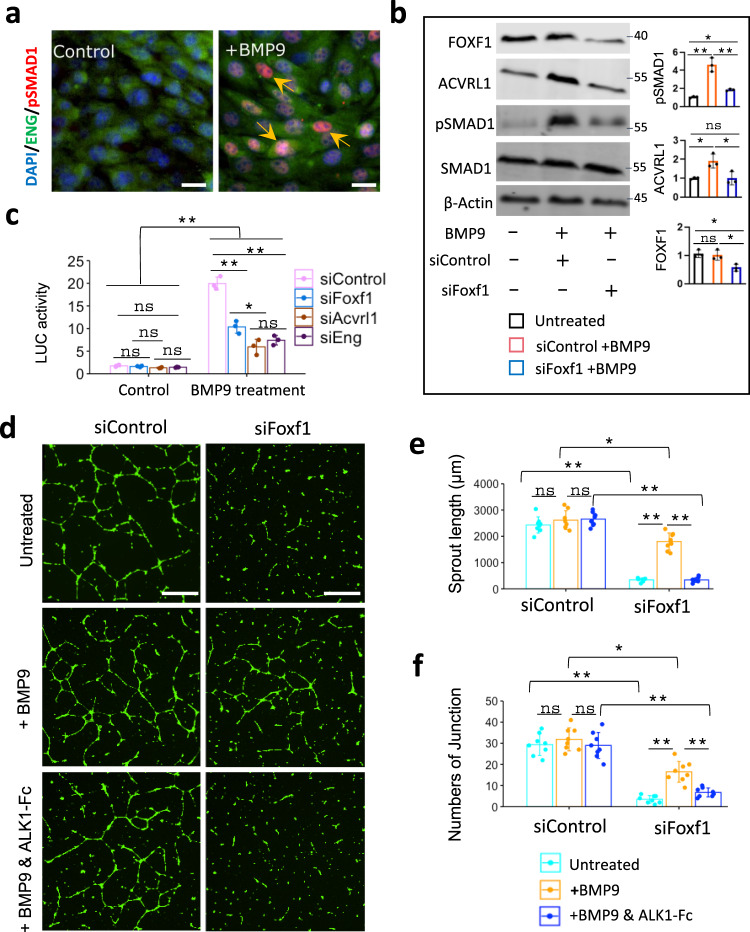
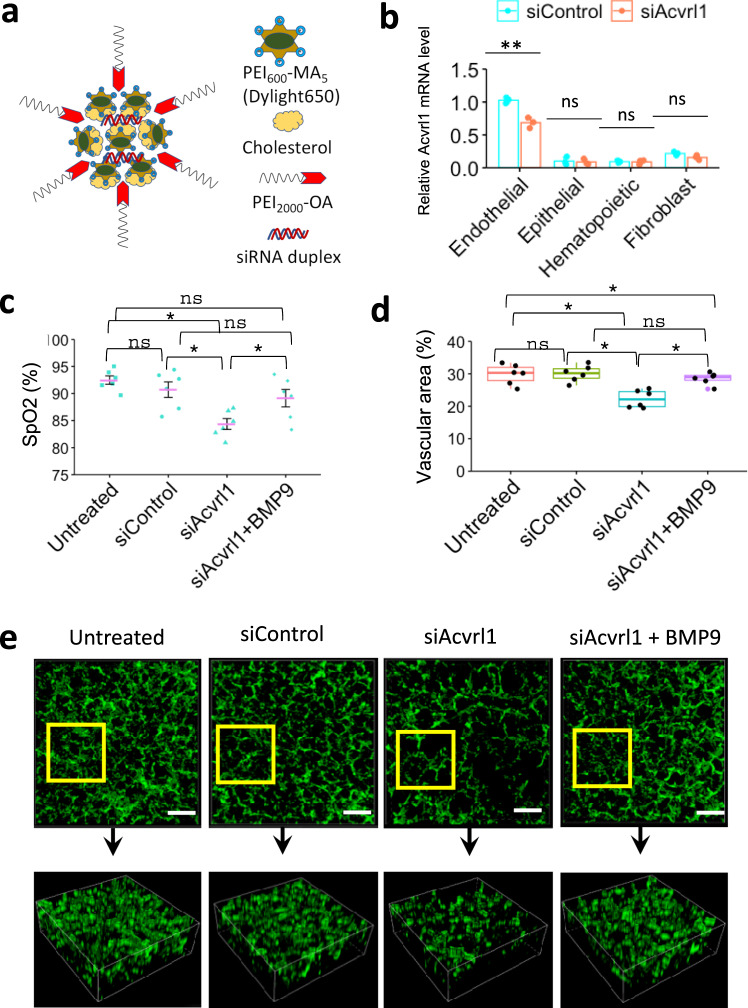
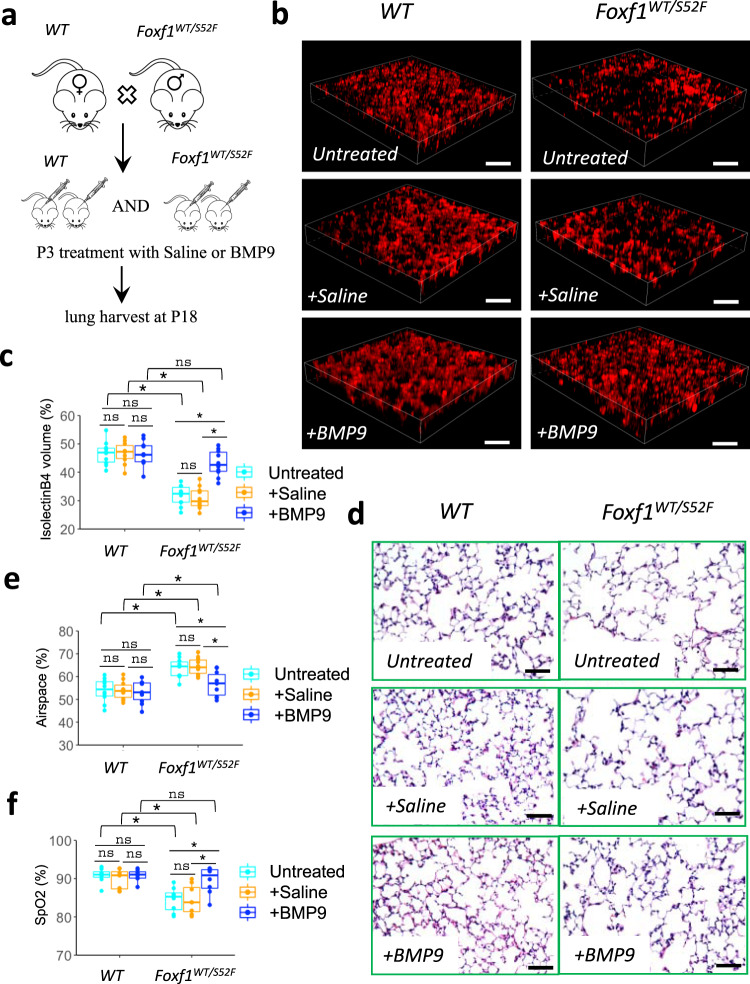
Pulmonary endothelial progenitor cells (EPCs) are critical for neonatal lung angiogenesis and represent a subset of general capillary cells (gCAPs). Molecular mechanisms through which EPCs stimulate lung angiogenesis are unknown. Herein, we used single-cell RNA sequencing to identify the BMP9/ACVRL1/SMAD1 pathway signature in pulmonary EPCs. BMP9 receptor, ACVRL1, and its downstream target genes were inhibited in EPCs from Foxf1WT/S52F mutant mice, a model of alveolar capillary dysplasia with misalignment of pulmonary veins (ACDMPV). Expression of ACVRL1 and its targets were reduced in lungs of ACDMPV subjects. Inhibition of FOXF1 transcription factor reduced BMP9/ACVRL1 signaling and decreased angiogenesis in vitro. FOXF1 synergized with ETS transcription factor FLI1 to activate ACVRL1 promoter. Nanoparticle-mediated silencing of ACVRL1 in newborn mice decreased neonatal lung angiogenesis and alveolarization. Treatment with BMP9 restored lung angiogenesis and alveolarization in ACVRL1-deficient and Foxf1WT/S52F mice. Altogether, EPCs promote neonatal lung angiogenesis and alveolarization through FOXF1-mediated activation of BMP9/ACVRL1 signaling.


Conflict of interest statement

The authors declare no competing interests.

Figures

Fig. 1
Fig. 1. Single cell RNAseq analysis identifies differences in cellular composition of the Foxf1WT/S52F lung.
a The integrated projection of CD45-depleted pulmonary cells from WT and Foxf1WT/S52F lungs. Lungs were harvested from E18.5 embryos and enzymatically digested to obtain single cell suspensions. CD45-positive cells were depleted using immunomagnetic beads. Three embryos from each genotype were pooled together prior to the scRNAseq analysis. 12 cell clusters were identified using the Uniform Manifold Approximation and Projection (UMAP) clustering. b A K-nearest neighbor (KNN) graph-based clustering approach was used to identify similar cell clusters in WT (n = 5911 cells) and Foxf1WT/S52F lungs (n = 7559 cells). c Violin plots show the presence of Foxf1 mRNA in endothelial cells, fibroblast-1, pericytes and myofibroblasts based on expression of selective cell markers Cdh5, Pdgfra and Cspg4. d Proportions of cells in each of the 12 clusters are compared in WT and Foxf1WT/S52F lungs. Percentages of endothelial and AT1 cells are decreased in Foxf1WT/S52F lungs. The percentage of matrix FB2 is increased in Foxf1WT/S52F lungs compared to lungs of WT littermates. e Linear regression analysis shows changes in distribution of endothelial, AT1 and matrix FB2 clusters between WT and Foxf1WT/S52F lungs.
Fig. 2
Fig. 2. Single cell RNAseq analysis reveals decreased ACVRL1 expression in gCAPs of Foxf1WT/S52F mice.
a Dimensional reduction plot with UMAP shows five subclusters of pulmonary endothelial cells in E18.5 lungs. Lungs were harvested from E18.5 mouse embryos, enzymatically digested and then incubated with CD45+ immunobeads to deplete hematopoietic cells. Three embryos from each genotype were pooled together prior to the scRNAseq analysis. b Split dimensional reduction plots of pulmonary endothelial cells from WT (n = 532 cells) and Foxf1WT/S52F embryos (n = 320 cells). c, d Violin and scatter plots show an enrichment of Foxf1 mRNA in pulmonary capillary cells. Foxf1 expression is selectively decreased in gCAPs but not aCAPs from Foxf1WT/S52F embryos. T-test (two-tailed) analyses were performed, and pvalue for Foxf1 is 0.01257. *p < 0.05, p > 0.05 is ns. e Heatmap shows representative gCAP genes, expression of which is decreased in Foxf1WT/S52F embryos compared to WT embryos. f Analysis of signaling pathways demonstrates that gCAPs of Foxf1WT/S52F embryos exhibit decreased expression of genes associated with the TGFβ/BMP signaling pathway, sphingolipid metabolism, endocytosis, Rap1 and PPAR pathways. Fisher’s Exact (one-sided) test was used via DAVID bioinformatic resource to measure gene-enrichment p-values. g Violin plots show decreased expression of Acvrl1 in gCAPs but not aCAPs. Expression of Bmpr2 and Eng is unchanged T-test (two-tailed) analyses were performed, and p-value for Acvrl1 is 0.01993. p < 0.05 is *p > 0.05 is ns. h, i Violin plots show decreased expression of downstream target genes of the TGFβ/BMP signaling pathway in pulmonary gCAPs, including Tmem100, Calcrl, Clec14a, Id1 and Id3. T-test (two-tailed) analyses were performed, and pvalue for Tmem100 is 0.01688, for Calcrl is 0.02132, for Clec14a is 0.0213, for Id1 is 0.03623, for Id3 is 0.037811. *p < 0.05, p > 0.05 is ns. The data for box plots in d and gi were retrieved from single cell normalized counts (WT: n = 532; Foxf1WT/S52F: n = 320) Boxplots: center line, median; box boundary, first and third quartiles; whiskers denote 5th–95th percentile. Expression of these genes in pulmonary aCAPs was unchanged. ns is not significant.
Fig. 3
Fig. 3. FOXF1 is expressed in a subset of gCAPs.
a, b Dimensional reduction plot with UMAP was generated using scRNAseq dataset from WT E18.5 lungs and shows gCAP and aCAP clusters of microvascular endothelial cells. Three embryos were pooled together prior to the scRNAseq analysis. gCAPs consist of two distinct subclusters: FOXF1+ gCAPs and FOXF1 gCAPs. c RNAscope of lung sections from WT E18.5 embryos shows APLNR-expressing gCAPs in the alveolar region. High magnification images of area in yellow box are shown on the right. Lung sections were counterstained with DAPI. APLNR co-localizes with FOXF1 in FOXF1+ gCAPs (red arrowheads). FOXF1 is not expressed in FOXF1 gCAPs (yellow arrowheads). The RNAscope assays were performed twice with consistent results. Scale bars are 10 μm.
Fig. 4
Fig. 4. Expression of ACVRL1 is decreased in mouse and human ACDMPV lungs.
a Foxf1 and Acvrl1 mRNAs are decreased in FACS-sorted gCAPs of Foxf1WT-GFP/S52F embryos. FOXF1+ gCAPs (FOXF1+cKIT+CD31+CD45) were purified from enzymatically digested E18.5 mouse lungs (n = 4 embryos in each group). FOXF1-positive gCAPs were identified using the Foxf1-GFP transgene, which contains GFP knocked into the endogenous Foxf1 gene locus. Foxf1WT-GFP/+ embryos were used as controls. Data were shown as mean ± SD. Nonparametric Mann-Whitney U test were performed, and p value for Foxf1 is 0.00022, for Acvrl1 is 0.00015. b Expression of ACVRL1 downstream target genes is decreased in FACS-sorted gCAPs of Foxf1WT-GFP/S52F embryos (n = 4 embryos in each group). Data were shown as mean ± SD, and nonparametric Mann-Whitney U test were performed were performed, and p value for Tmem100 is 0.00009, for Calcrl is 0.00098, for Clec14a is 0.00011. c Immunostaining of E18.5 lungs shows reduced expression of ACVRL1 protein in Foxf1WT/S52F lungs compared to WT controls (n = 6). Scale bars are 10 μm. Data were presented as mean ± SD, and T-test (two-tailed) were performed, p value = 0.01293. d The percentage of ACVRL1+ENG+ cells among pulmonary FOXF1+ gCAPs is decreased in Foxf1WT-GFP/S52F E18.5 embryos. e Measurements of mean fluorescence intensity (MFI) by FACS analysis show decreased ACVRL1 cell surface expression in FOXF1+ gCAPs of Foxf1WT-GFP/S52F embryos compared to Foxf1WT-GFP/+ controls. (n = 6 mice in each group) Boxplots: center line, median; box boundary, first and third quartiles; whiskers denote 5th–95th percentile, p value = 0.00298 f Percentages of ACVRL1+ENG+ gCAPs are lower in Foxf1WT-GFP/S52F mice at E18.5 and P7 (n = 6 mice in each group). Data were presented as mean ± SD. T-test (two-tailed) were performed, p value for E18.5 is 6.20943E-07, and p value for P7 is 3.38604E-06. Source data are provided as a Source Data file. g, h, Microarray analysis shows decreased expression of FOXF1, ACVRL1 and CALCRL mRNAs in human ACDMPV lungs (n = 8) compared to donor lungs (n = 5). BMPR2 and ENG mRNAs were unaltered. Boxplots: center line, median; box boundary, first and third quartiles; whiskers denote 5th–95th percentile, and student’s T-test (two-tailed) were performed. **p < 0.01, *p < 0.05 is, ns is not significant.
Fig. 5
Fig. 5. FOXF1 activates Acvrl1 gene expression through the ACE80 promoter region.
a, b Schematic diagram of the mouse Acvrl1 gene locus which contains the evolutionarily conserved −675/−275 promoter region (ACE400). Light blue boxes show untranslated DNA regions. Dark blue boxes indicate exons in the Acvrl1 gene. Two FOXF1-binding sites are indicated by green boxes. c Dual luciferase assay shows that CMV-FOXF1 expression plasmid stimulates the ACE400 activity in co-transfection experiments in MFLM-91U cells (n = 6). Data were shown as mean ± SD. T-test (two-tailed) were performed, pvalue for ACE is 0.00000158. p > 0.05 is not significant. CMV-empty expression plasmid (pCMV) and an empty LUC plasmid (vector) were used as controls. d Schematic shows the evolutionary conservation of ACE80 promoter region in amniote vertebrates. Amniotes were classified using UCSC genome browser into five groups: primates (orange), Afrotheria mammals (green), Laurasiatheria mammals (purple), Euarchontoglires mammals (blue) and birds (grey). e Schematic shows sequences of two FOXF1-binding sites in ACE80 region in several species. f Dual luciferase assay shows that CMV-FOXF1 expression vector stimulates the ACE80 activity in co-transfection experiments in MFLM-91U cells (n = 3). Data were shown as mean ± SD. The data were analyzed by one-way ANOVA followed by Tukey’s test (two-tailed). CMV-empty vector (CMV) and transcriptionally inactive S52F FOXF1 mutant plasmid (CMV- S52F-FOXF1) are used as controls. LUC activity is decreased after co-transfection of CMV-FOXF1 plasmid with ACE80mt LUC reporter. **p < 0.01, *p < 0.05, ns is not significant. g Location of FOXF1-binding sites in ACE80 region is indicated by green boxes. FOXF1-binding sites in ACE80mt construct were inactivated by disrupting the FOX core motif.
Fig. 6
Fig. 6. FOXF1 synergizes with FLI1 to stimulate Acvrl1 promoter activity.
a Violin plots were generated using a combined pool of cells from WT and Foxf1WT/S52F E18.5 lungs and show endothelial-enriched expression of ETS transcription factors Fli1, Erg and Ets1. ETS transcription factor Spi1 is not expressed in endothelial, epithelial, and mesenchymal cell lineages in the lung tissue. b Violin plots show that Fli1 is enriched in gCAPs, whereas Erg is enriched in aCAPs. Ets1 expression is similar in aCAPs and gCAPs. The data for box plots were from single cell normalized counts (WT: n = 532; Foxf1WT/S52F: n = 320). Boxplots: center line, median; box boundary, first and third quartiles; whiskers denote 5th–95th percentile. T-test (two-tailed) were performed, pvalue for Fli1 is 0.01677, and for Erg is 0.02791. c Dual luciferase (LUC) assay shows transcriptional synergy between CMV-FOXF1 and CMV-FLI1 expression vectors to activate the ACE400 LUC reporter. Co-transfection experiments were performed using fetal lung MFLM-91U cells (n = 4). Data were shown as mean ± SD, and one-way ANOVA followed by Tukey’s test (two-tailed) were performed. **p < 0.01, *p < 0.05, ns is not significant. d ChIPseq shows that FOXF1 and FLI1 proteins bind to the ACE400 region of Acvrl1 gene (red box).
Fig. 7
Fig. 7. BMP9 stimulates angiogenesis in FOXF1-deficient endothelial cells in vitro.
a Immunostaining shows an increase in phosphorylated SMAD1 (pSMAD1) after treatment of endothelial MFLM-91U cells with BMP9. Nuclear pSMAD1 staining (red) is indicated by arrows. Endothelial cells are counterstained with DAPI (blue) and ENG (green). The experiment was repeated 3 times with similar results. Scale bars are 10 μm. b Western blot shows that BMP9 treatment increases pSMAD1 and ACVRL1 protein levels but does not affect FOXF1 or total SMAD1 in MFLM-91U cells (n = 3). Inhibition of FOXF1 by siRNA decreases pSMAD1 and ACVRL1 proteins in BMP9-treated cells. c Dual luciferase assay shows that BMP9 increases activity of the BRE-LUC reporter plasmid in MFLM-91U cells (n = 3). siRNA-mediated inhibition of FOXF1, ACVRL1 or ENG decreases BRE-LUC reporter activity in BMP9-treated cells. b, c Data were shown as mean ± SD, and one-way ANOVA followed by Tukey’s test (two-tailed) were performed. **p < 0.01, *p < 0.05 ns is not significant. df In vitro angiogenesis assay shows that inhibition of FOXF1 by siRNA decreases the formation of endothelial sprouts in MFLM-91U cells. BMP9 treatment partially restores the in vitro angiogenesis in FOXF1-deficient endothelial cells. Treatment of cells with ALK1-Fc chimeric protein inhibits the effect of BMP9. Scale bars are 20 μm. The complexity of the vascular network in Matrigel is quantitated by measurements of sprout length e and counts of the sprout junctions f (n = 8 per each group). e, f Data were shown as mean ± SD, and one-way ANOVA (two-tailed) followed by Tukey’s multiple comparison test was performed. **p < 0.01, *p < 0.05, ns is not significant.
Fig. 8
Fig. 8. Nanoparticle-mediated inhibition of ACVRL1 decreases neonatal pulmonary angiogenesis.
a Schematic diagram shows structure of PEI600-MA5/PEG-OA/Cho nanoparticles containing duplex siRNA, cholesterol, PEI600-MA5 and PEG2000-OA. b Real-time PCR analysis shows decreased amounts of Acvrl1 mRNA in FACS-sorted pulmonary endothelial cells (CD31+CD45) from mice treated with nanoparticles containing Acvrl1-specific siRNA (siAcvrl1) (n = 3). Nanoparticles with scrambled siRNA were used as a control (siControl). Nanoparticles were delivered i.v. to P2 mice. Lungs were harvested at P4. Acvrl1 mRNA is not changed in FACS-sorted epithelial cells (CD326+CD31CD45), fibroblasts (CD140a+CD31CD45) and hematopoietic cells (CD45+CD31). c Arterial oxygen saturation (SpO2) is decreased in mice treated with nanoparticles containing Acvrl1 siRNA compared to control siRNA (n = 6). Intravenous BMP9 delivery increases arterial oxygenation in siAcvrl1-treated mice (n = 6). Nanoparticles were delivered at P2, BMP9 treatment was performed at P4, arterial oxygenation was measured at P18. b, c Data were presented as mean ± SD. d, e Alveolar capillary density is decreased after nanoparticle delivery of Acvrl1 siRNA but restored after administration of BMP9. Immunostaining lung sections for endothelial marker endomucin (green) and confocal 3D imaging of cleared lung lobes were performed using P18 mouse lungs (n = 6). Boxplots: center line, median; box boundary, first and third quartiles; whiskers denote 5th–95th percentile. bd Data were shown as mean ± SD, and one-way ANOVA (two-tailed) followed by Tukey’s multiple comparison test was performed. **p < 0.01, *p < 0.05, ns is not significant. Scale bars are 50 μm.
Fig. 9
Fig. 9. BMP9 treatment increases alveolar capillary density and improves arterial oxygenation in Foxf1WT/S52F mice.
a Schematic shows BMP9 treatment in WT and Foxf1WT/S52F littermates. BMP9 was delivered i.v. at P3. Mice treated with saline were used as controls. Lungs were examined at P18. b, c Delivery of BMP9 improves the capillary density in Foxf1WT/S52F lungs but have no effect in WT controls. Capillary density was measured using the in vivo labeling with isolectin B4 (red) which binds to the luminal surface of perfused blood vessels. Scale bars are 50 μm. Capillary density was quantified using high–resolution confocal microscopy. Ten random images were quantified using n = 10 mice in each group. de H&E staining shows that BMP9 treatment protects Foxf1WT/S52F mice from alveolar simplification. Scale bars are 50 μm. Ten random images were quantified using n = 10 mice in each group. f BMP9 treatment increases arterial oxygen saturation (SpO2) in Foxf1WT/S52F mice compared to WT littermates. Arterial oxygenation was measured at P18 (n = 8 mice per group). Boxplots in c, e, and f: center line, median; box boundary, first and third quartiles; whiskers denote 5th–95th percentile. Data were shown as mean ± SD, and one–way ANOVA (two–tailed) followed by Tukey’s multiple comparison test was performed. *p < 0.05,**p < 0.01 ns is not significant.

Similar articles

Cited by

References

    1. Whitsett JA, Kalin TV, Xu Y, Kalinichenko VV. Building and regenerating the lung cell by cell. Physiological Rev. 2019;99:513–554. doi: 10.1152/physrev.00001.2018. - DOI - PMC - PubMed
    1. Morrisey EE, Hogan BL. Preparing for the first breath: genetic and cellular mechanisms in lung development. Developmental Cell. 2010;18:8–23. doi: 10.1016/j.devcel.2009.12.010. - DOI - PMC - PubMed
    1. Bolte C, Whitsett JA, Kalin TV, Kalinichenko VV. Transcription factors regulating embryonic development of pulmonary vasculature. Adv. Anat. Embryol. Cell Biol. 2018;228:1–20. doi: 10.1007/978-3-319-68483-3_1. - DOI - PubMed
    1. Bishop NB, Stankiewicz P, Steinhorn RH. Alveolar capillary dysplasia. Am. J. Respiratory Crit. Care Med. 2011;184:172–179. doi: 10.1164/rccm.201010-1697CI. - DOI - PMC - PubMed
    1. Dharmadhikari AV, Szafranski P, Kalinichenko VV, Stankiewicz P. Genomic and epigenetic complexity of the FOXF1 locus in 16q24.1: implications for development and disease. Curr. Genomics. 2015;16:107–116. doi: 10.2174/1389202916666150122223252. - DOI - PMC - PubMed

Publication types

MeSH terms

Substances

Supplementary concepts