. 2022 Apr 19;13(1):2041.
doi: 10.1038/s41467-022-29717-3.

Human serum triggers antibiotic tolerance in Staphylococcus aureus

Affiliations

Human serum triggers antibiotic tolerance in Staphylococcus aureus

Elizabeth V K Ledger et al. Nat Commun. .

Abstract

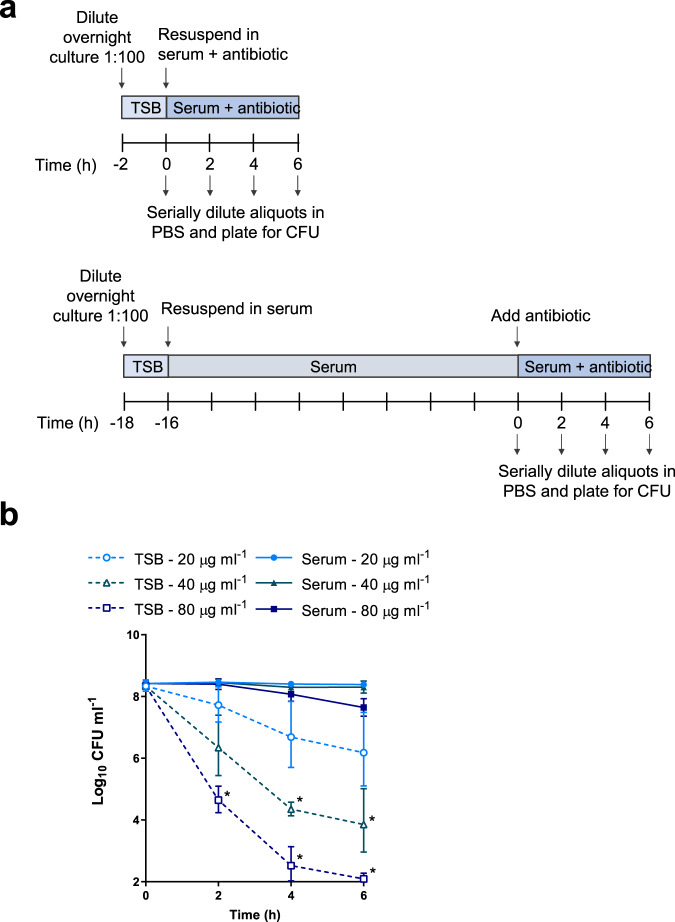
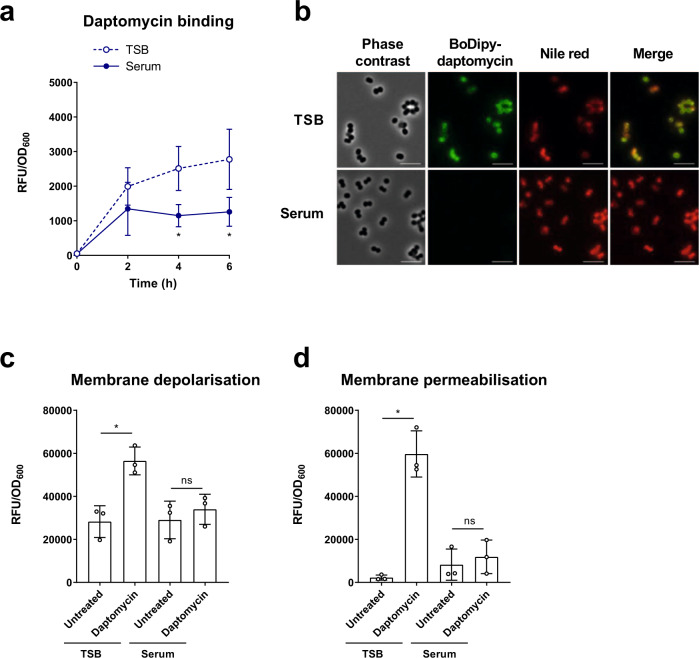
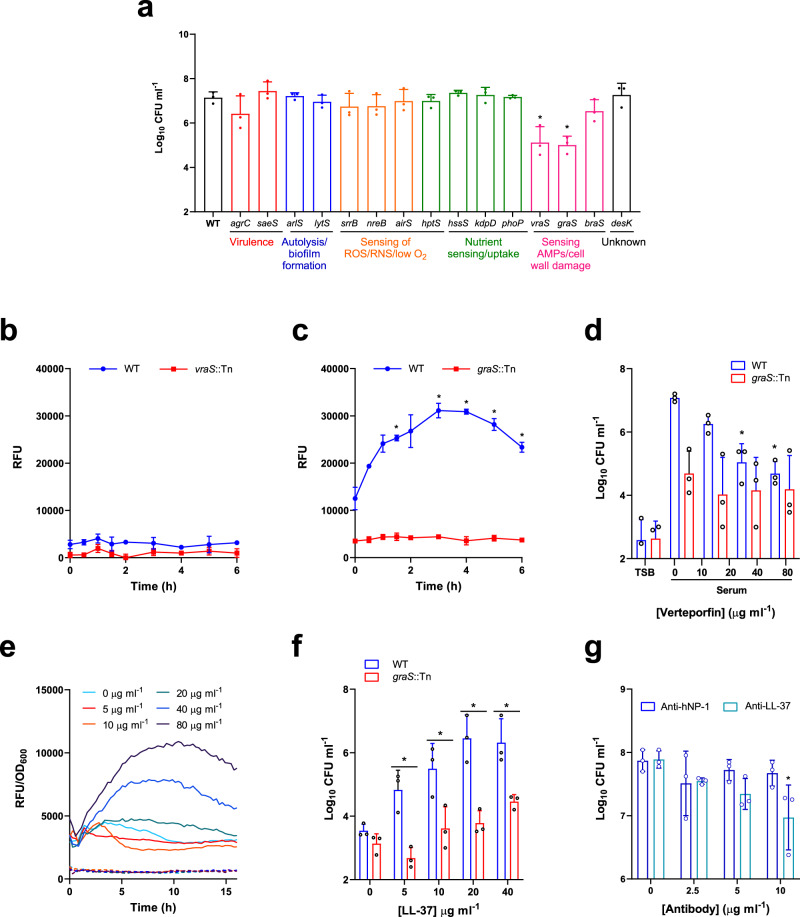
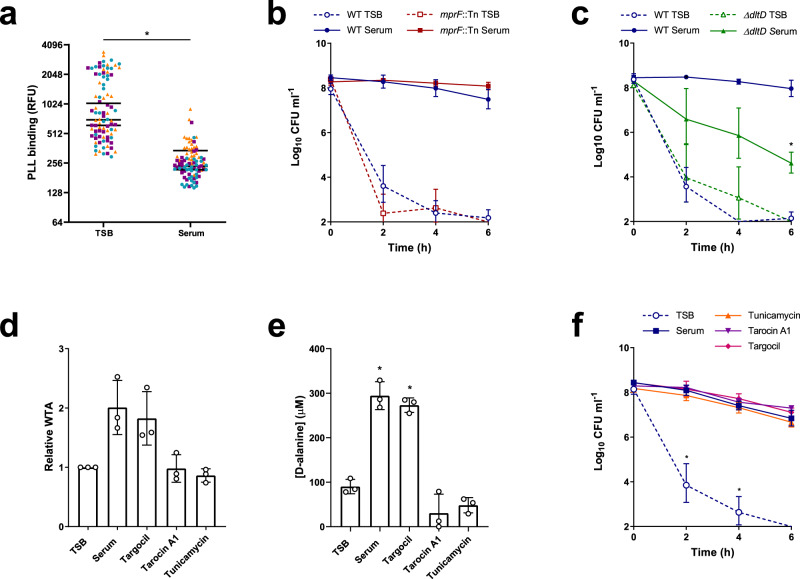
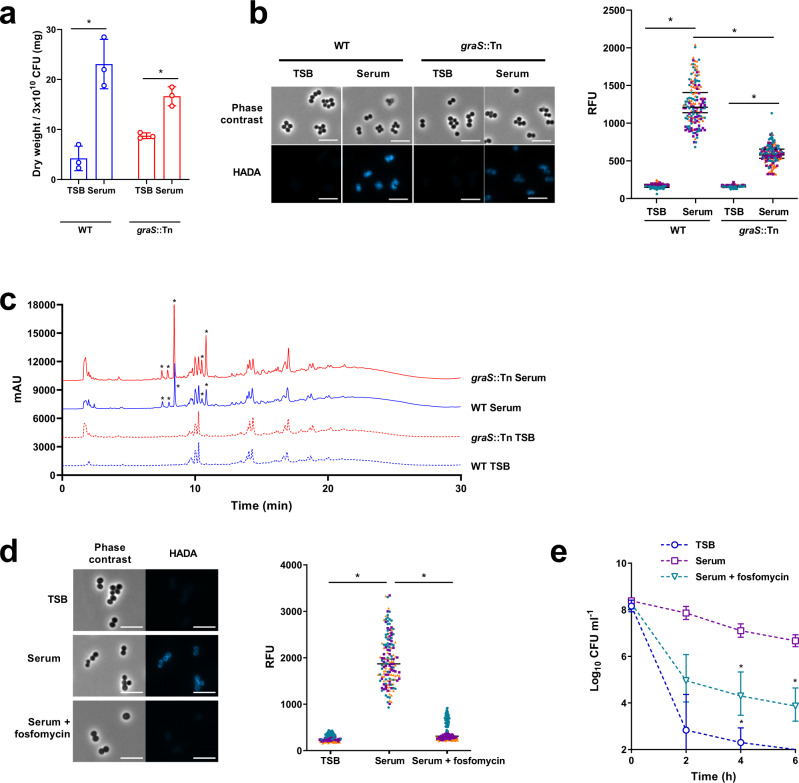
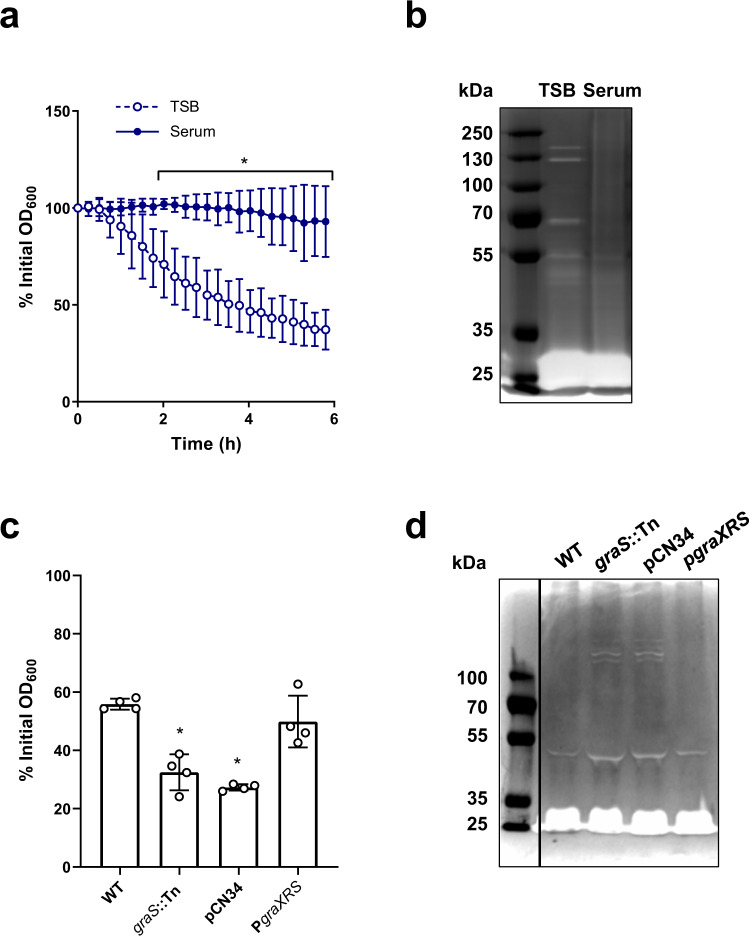
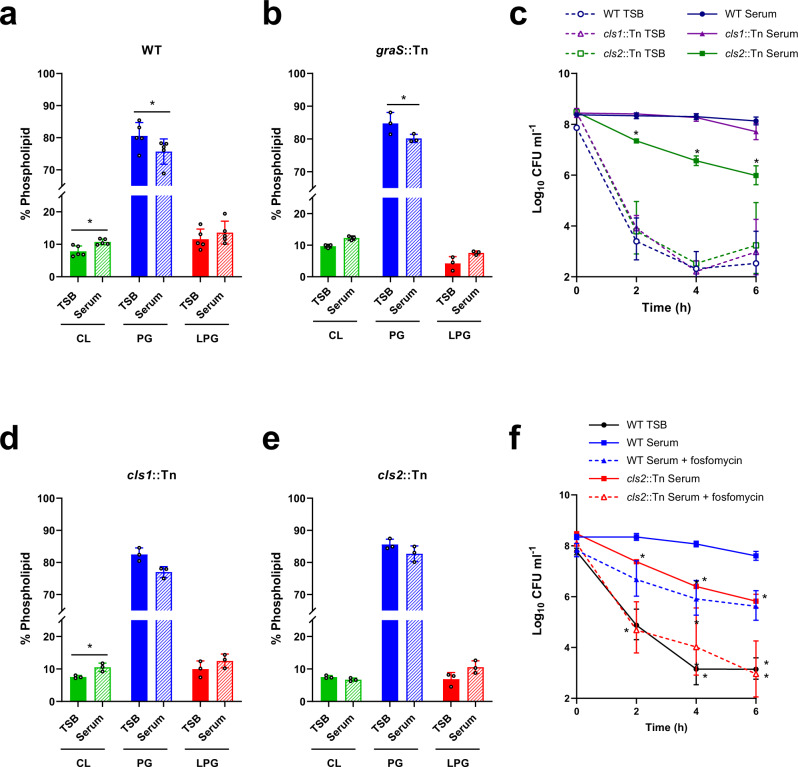
Staphylococcus aureus frequently causes infections that are challenging to treat, leading to high rates of persistent and relapsing infection. Here, to understand how the host environment influences treatment outcomes, we study the impact of human serum on staphylococcal antibiotic susceptibility. We show that serum triggers a high degree of tolerance to the lipopeptide antibiotic daptomycin and several other classes of antibiotic. Serum-induced daptomycin tolerance is due to two independent mechanisms. Firstly, the host defence peptide LL-37 induces tolerance by triggering the staphylococcal GraRS two-component system, leading to increased peptidoglycan accumulation. Secondly, GraRS-independent increases in membrane cardiolipin abundance are required for full tolerance. When both mechanisms are blocked, S. aureus incubated in serum is as susceptible to daptomycin as when grown in laboratory media. Our work demonstrates that host factors can significantly modulate antibiotic susceptibility via diverse mechanisms, and combination therapy may provide a way to mitigate this.


Conflict of interest statement

The authors declare no competing interests.

Figures

Fig. 1
Fig. 1. Incubation of S. aureus in serum results in tolerance towards daptomycin.
Schematic outlining the protocol used to investigate the susceptibility of TSB-grown and serum-adapted cultures of S. aureus to daptomycin (a). Log10 CFU ml−1 of TSB-grown and serum-adapted cultures of S. aureus USA300 WT over 6 h incubation in serum with 20–80 µg ml−1 daptomycin (b). Graph represents the geometric mean ± geometric standard deviation of three independent experiments (* for 40 µg ml−1 P = 0.0014 (4 hr), 0.0472 (6 h) and for 80 µg ml−1 P = 0.0068 (2 h), 0.0042 (4 h), 0.0003 (6 h) determined by two-way ANOVA with Tukey’s post-hoc test, TSB-grown compared to serum-adapted at each time-point and dose). TSB, tryptic soy broth; PBS, phosphate-buffered saline; CFU, colony-forming units. Source data are provided as a Source Data file.
Fig. 2
Fig. 2. Daptomycin does not bind to or disrupt the membranes of S. aureus incubated in serum.
Cell-associated fluorescence of TSB-grown and serum-adapted cultures of S. aureus USA300 WT over a 6 h incubation with 320 µg ml−1 BoDipy-daptomycin (a). Cells after 2 h daptomycin exposure from panel (a) were fixed and analysed by phase contrast and fluorescence microscopy (b). Cells were co-stained with 10 µg ml−1 nile red to visualise cell membranes. Scale bars, 5 µm. DiSC3(5) (c) and propidium iodide (d) fluorescence of TSB-grown and serum-adapted cultures after 6 h exposure, or not, to 80 µg ml−1 daptomycin in serum. Fluorescence values were divided by OD600 measurements to normalise for changes in cell density which occurred throughout the assays. Graphs represent the mean ± standard deviation of three independent experiments (NS = not significant (P > 0.05). *For (a), P = 0.0276 (4 h), 0.0132 (6 h). For (c), P = 0.0033 and (d), P < 0.0001). Data in (a) were analysed by two-way ANOVA with Sidak’s post-hoc test (TSB-grown vs serum-adapted at each time-point). Data in (c) and (d) were analysed by two-way ANOVA with Tukey’s post-hoc test (untreated vs daptomycin-exposed). TSB, tryptic soy broth; RFU, relative fluorescence units; OD600, optical density at 600 nm. Source data are provided as a Source Data file.
Fig. 3
Fig. 3. LL-37 in serum triggers daptomycin tolerance through activation of the GraRS two-component system.
Log10 CFU ml−1 of serum-adapted S. aureus JE2 WT and transposon mutants defective for the sensor components of various TCS after 6 h incubation with 80 μg ml−1 daptomycin (a). GFP fluorescence over a 6 h exposure of TSB-grown S. aureus JE2 WT and the vraS::Tn mutant containing PvraX-gfp (b) or JE2 WT and the graS::Tn mutant containing PdltA-gfp (c) to human serum. Log10 CFU ml−1 after 6 h exposure to 80 μg ml−1 daptomycin of S. aureus JE2 WT and the graS::Tn mutant which had been TSB-grown or pre-incubated for 16 h in serum supplemented with indicated concentrations of verteporfin (d). TSB-grown S. aureus JE2 WT (solid lines) and the graS::Tn mutant (dashed lines) containing PdltA-gfp were exposed to various concentrations of LL-37 (5–80 μg ml−1) in RPMI 1640 and GFP fluorescence (RFU) and OD600 were measured every 15 min for 16 h (e). Fluorescence values were divided by OD600 measurements to normalise for changes in cell density. Log10 CFU ml−1 of WT and graS::Tn mutant strains which had been incubated for 16 h in RPMI 1640 supplemented with indicated concentrations of LL-37 and then exposed to 80 μg ml−1 daptomycin for 6 h (f). Log10 CFU ml−1 of S. aureus JE2 WT incubated for 16 h in serum supplemented with indicated concentrations of antibody targeting hNP-1 or LL-37 and then exposed to 80 μg ml−1 daptomycin for 6 h (g). Graphs in (a), (d), (f) and (g) represent the geometric mean ± geometric standard deviation of three independent experiments. Graphs in (b), (c) and (e) represent the mean ± standard deviation of three independent experiments except panel (e) where error bars have been omitted for clarity. Data in (a) were analysed by one-way ANOVA with Dunnett’s post-hoc test (*P < 0.0001 (vraS), <0.0001 (graS) vs WT). Data in (b) and (c) were analysed by two-way ANOVA with Dunnett’s post-hoc test (* for (c), P = 0.0416 (90 min), 0.0227 (3 h), 0.0491 (4 h), 0.0248 (5 h), 0.0422 (6 h)). Data in (d) and (g) were analysed by two-way ANOVA with Dunnett’s post-hoc test (* for (d), P = 0.01 (40 μg ml−1), 0.0024 (80 μg ml−1); * for (g), P = 0.0044; serum + verteporfin/antibody vs serum alone). Data in (f) were analysed by two-way ANOVA with Sidak’s post-hoc test (*P = 0.0006 (5 μg ml−1), 0.0023 (10 μg ml−1), <0.0001 (20 μg ml−1), 0.0026 (40 μg ml−1). WT vs graS::Tn). RFU, relative fluorescence units; CFU, colony-forming units, OD600, optical density at 600 nm; hNP-1, human neutrophil peptide 1. Source data are provided as a Source Data file.
Fig. 4
Fig. 4. GraRS-mediated changes in surface charge do not explain serum-induced tolerance.
FITC-PLL binding to TSB-grown and serum-adapted cultures S. aureus JE2 WT. Cultures were incubated with 80 μg ml−1 FITC-PLL, washed, fixed and analysed by fluorescence microscopy (a). The fluorescence of 30 cells per biological replicate (90 cells total per condition) was measured and the mean of each replicate is indicated. Colours represent different biological replicates. Log10 CFU ml−1 of TSB-grown and serum-adapted cultures of S. aureus JE2 WT and the mprF::Tn mutant (b) and the ΔdltD mutant (c) during a 6 h exposure to 80 μg ml−1 daptomycin in serum (b). WTA extracts from TSB-grown bacteria and cultures incubated in serum supplemented, or not, with 128 μg ml−1 targocil, 64 μg ml−1, tarocin A1, or 128 μg ml−1 tunicamycin for 16 h were analysed by native PAGE with alcian blue staining and quantified using ImageJ (d). Concentrations of D-alanine in WTA extracts from panel (d) were determined spectrophotometrically using an enzyme-based assay and by interpolating values from a standard curve generated from known D-alanine concentrations (e). Log10 CFU ml−1 over 6 h exposure to 80 μg ml−1 daptomycin of TSB-grown S. aureus or cultures which had been incubated in serum supplemented, or not, with 128 μg ml−1 targocil, 64 μg ml−1 tarocin A1 or 128 μg ml−1 tunicamycin for 16 h (f). Data in (a) were analysed by a Mann–Whitney test (*P < 0.0001). Data in (b) and (c) represent the geometric mean ± geometric standard deviation of three independent experiments and were analysed by two-way ANOVA with Sidak’s post-hoc test (* for (c), P = 0.0036 serum-adapted WT vs serum-adapted mutant at 6 h time-point). Data in (d) and (e) represent the mean ± standard deviation of three independent experiments and were analysed by one-way ANOVA with Dunnett’s post-hoc test (*P < 0.0001 (serum), <0.0001 (Targocil) vs TSB-grown). Data in (f) were analysed by two-way ANOVA with Dunnett’s post-hoc test (*P = 0.0222 (2 h), 0.0072 (4 h), serum alone vs TSB or serum + WTA synthesis inhibitor). Several points fell below the limit of detection of 100 CFU ml−1. TSB, tryptic soy broth; FITC-PLL, fluorescein isothiocyanate-poly-L-lysine; RFU, relative fluorescence units; CFU, colony-forming units; WTA, wall teichoic acid. Source data are provided as a Source Data file.
Fig. 5
Fig. 5. GraRS-mediated increase in peptidoglycan partially explains serum-induced tolerance.
Dry weight of peptidoglycan extracted from 300 ml cultures of TSB-grown or serum-adapted S. aureus JE2 WT or the graS::Tn mutant strain (a). Phase contrast and fluorescence microscopy of TSB-grown and serum-adapted cultures of S. aureus WT and the graS::Tn mutant strain (b). Scale bars, 5 μm. The fluorescence of individual cells was quantified. Graph represents the fluorescence of 50 cells per biological replicate (150 cells in total) with the mean of each replicate indicated. Each biological replicate is depicted in a different colour. Peptidoglycan from panel (a) was analysed by rp-HPLC (c). Asterisks denote peaks present in serum-adapted but not TSB-grown samples. Phase contrast and fluorescence microscopy of TSB-grown, serum-adapted or serum + 64 μg ml−1 fosfomycin-adapted cultures of S. aureus JE2 WT (d). Scale bars, 5 μm. The fluorescence of individual cells was quantified and different colours represent different biological replicates. Log10 CFU ml−1 of bacteria depicted in panel (d) during a 6 h exposure to 80 μg ml−1 daptomycin in serum (e). Graph in (a) represents the mean ± standard deviation of three independent experiments and data were analysed by two-way ANOVA with Sidak’s post-hoc test (*P < 0.0001 (WT), =0.0217 (graS::Tn)). Data in (b) and (d) were analysed by Kruskal–-Wallis with Dunn’s post hoc test (* for (b), P < 0.0001 (WT), <0.0001 (graS::Tn). For (d), P < 0.0001 (TSB vs Serum), P < 0.0001 (Serum vs Serum + fosfomycin)). Data in (e) represent the geometric mean ± geometric standard deviation of three independent experiments and were analysed by two-way ANOVA with Dunnett’s post-hoc test (*, P = 0.0062 (4 h serum), 0.0379 (4 h serum + Fosfomycin), 0.0358 (6 h serum + fosfomycin); serum-adapted vs serum/fosfomycin-adapted at each time-point). The final time point for TSB-grown cells fell below the limit of detection of 100 CFU ml−1. CFU, colony-forming units; TSB, tryptic soy broth. Source data are provided as a Source Data file.
Fig. 6
Fig. 6. Accumulation of peptidoglycan is associated with a GraRS-dependent reduction in autolysis.
Triton X-100-triggered lysis of TSB-grown and serum-adapted cultures of S. aureus as measured by following OD600 values during a 6 h exposure to 0.05% Triton X-100 (a). Cell wall extracts of TSB-grown and serum-adapted S. aureus were separated by SDS-PAGE using gels containing heat-killed S. aureus cells. Hydrolases were allowed to refold and zones of peptidoglycan degradation were visualised using methylene blue (b). Triton X-100-triggered lysis of serum-adapted cultures of S. aureus WT, the graS::Tn mutant, and the graS::Tn mutant complemented with empty pCN34 or PgraXRS as measured by OD600 values after a 6 h exposure to 0.05% Triton X-100 (c). Cell wall extracts of serum-adapted cultures of S. aureus WT, the graS::Tn mutant, and the graS::Tn mutant complemented with empty pCN34 or PgraXRS were analysed by zymography (d). Graphs in (a) and (c) represent the mean ± standard deviation of three or four independent experiments, respectively. Three independent replicates of zymography were carried out and one representative image is shown. Data in (a) were analysed by two-way ANOVA with Sidak’s post-hoc test; *, P = 0.0267 (120 min), 0.0031 (135 min), 0.0011 (150 min), 0.0005 (165 min) and <0.0001 at all time-points from 180 min onwards. Data in (c) were analysed by one-way ANOVA with Dunnett’s post-hoc test; WT vs mutants (* P = 0.0002 (graS::Tn), <0.0001 (pCN34)). TSB, tryptic soy broth; OD600, optical density at 600 nm. Source data are provided as a Source Data file.
Fig. 7
Fig. 7. GraRS-independent changes to the staphylococcal membrane also contribute to tolerance.
Phospholipids were extracted from TSB-grown and serum-adapted cultures of S. aureus JE2 WT (a), the graS::Tn mutant (b), the cls1::Tn mutant (d) and the cls2::Tn mutant (e) before being analysed by thin layer chromatography and visualised with copper sulphate and phosphoric acid. The relative phospholipid compositions were determined by quantifying spot intensities using ImageJ. Log10 CFU ml−1 of TSB-grown and serum-adapted cultures of S. aureus JE2 WT and the cls1::Tn and cls2::Tn mutant strains during a 6 h exposure to 80 μg ml−1 daptomycin in serum (c). Log10 CFU ml−1 of TSB-grown and serum-adapted cultures of S. aureus JE2 WT and the cls2::Tn mutant strains during a 6 h exposure to 80 μg ml−1 daptomycin in serum (f). Where appropriate, adaptation was carried out with sub-lethal concentrations of fosfomycin (dashed lines). Data in (a), (b), (d) and (e) represent the mean ± standard deviation of at least three independent experiments and were analysed by paired t-tests (* for (a), P = 0.0015 (CL), 0.0116 (PG), 0.1002 (LPG). For (b) P = 0.2642 (CL), 0.0222 (PG), 0.1069 (LPG). For (d), P = 0.0491 (CL); TSB-grown vs serum-adapted for each phospholipid). Data in (c) and (f) represent the geometric mean ± geometric standard deviation of three independent replicates and were analysed by two-way ANOVA with Dunnetts’s post-hoc test * for (c), P = 0.0008 (2 h), 0.001 (4 h) and 0.0066 (6 h) serum-adapted WT vs serum-adapted mutant. For (f), P = 0.0163 (2 h WT TSB), 0.0115 (4 h WT TSB), 0.0018 (6 h WT TSB), 0.0022 (cls2::Tn Serum 2 h), 0.0002 (cls2::Tn Serum 4 h), 0.0034 (cls2::Tn Serum 6 h), 0.0349 (cls2::Tn Serum + fosfomycin 6 h). CL, cardiolipin; PG, phosphatidylglycerol; LPG, lysyl-phosphatidylglycerol; TSB, tryptic soy broth; CFU, colony-forming units. Source data are provided as a Source Data file.

References

    1. Public Health England. Annual epidemiological commentary: bacteraemia, MSSA bacteraemia and C. difficile infections, up to and including financial year April 2018 to March 2019. 1–88 (2019).
    1. Nathwani D, et al. Guidelines for UK practice for the diagnosis and management of methicillin-resistant Staphylococcus aureus (MRSA) infections presenting in the community. J. Antimicrob. Chemother. 2008;61:976–994. doi: 10.1093/jac/dkn096. - DOI - PubMed
    1. Grein, F. et al. Ca2+-Daptomycin targets cell wall biosynthesis by forming a tripartite complex with undecaprenyl-coupled intermediates and membrane lipids. Nat. Commun. (2020) 10.1038/s41467-020-15257-1. - PMC - PubMed
    1. Müller, A. et al. Daptomycin inhibits cell envelope synthesis by interfering with fluid membrane microdomains. Proc. Natl. Acad. Sci. USA (2016) 10.1073/pnas.1611173113. - PMC - PubMed
    1. Pogliano, J., Pogliano, N. & Silverman, J. A. Daptomycin-mediated reorganization of membrane architecture causes mislocalization of essential cell division proteins. J. Bacteriol. (2012) 10.1128/JB.00011-12. - PMC - PubMed

Publication types

MeSH terms