. 2022 Apr 19;13(1):2144.
doi: 10.1038/s41467-022-29794-4.

Genomic and transcriptomic analysis of a library of small cell lung cancer patient-derived xenografts

Affiliations

Genomic and transcriptomic analysis of a library of small cell lung cancer patient-derived xenografts

Rebecca Caeser et al. Nat Commun. .

Abstract

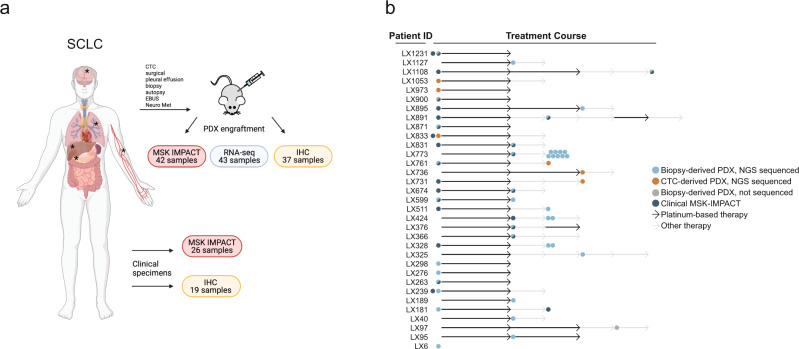
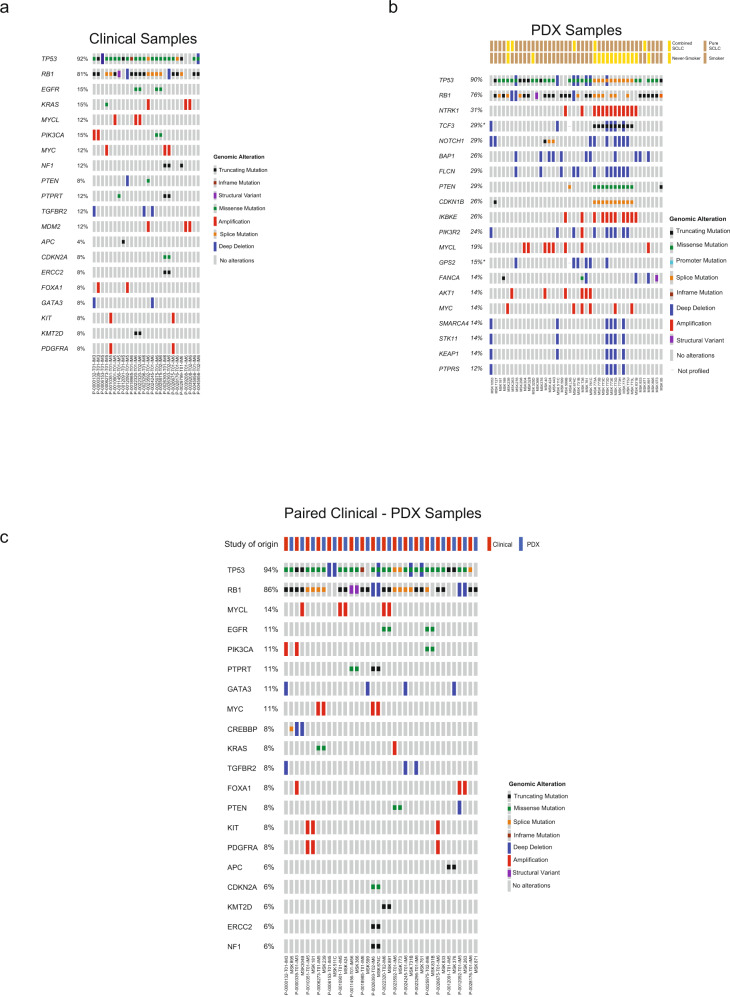
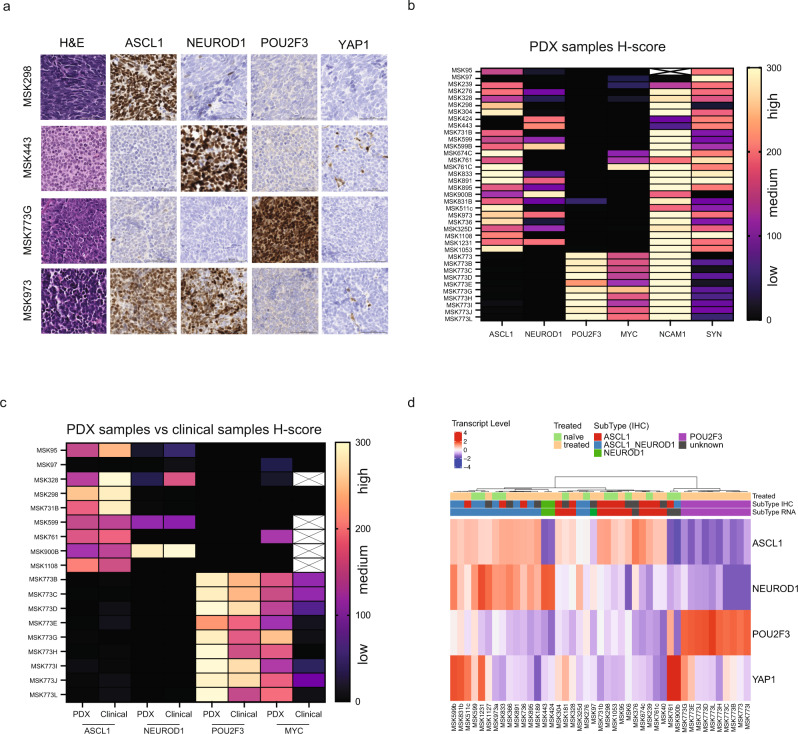
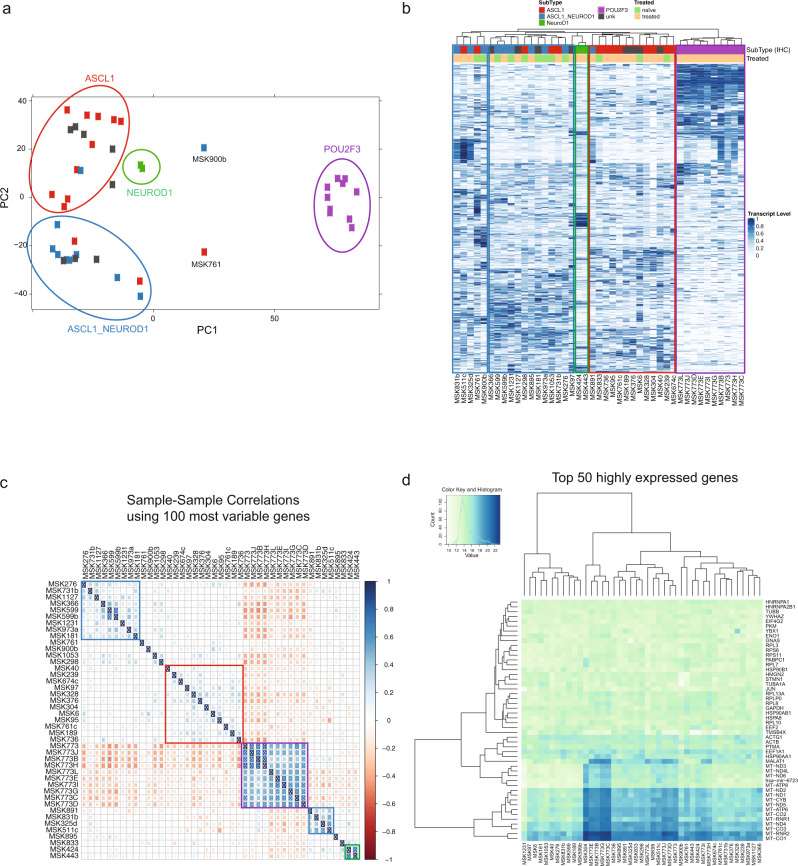
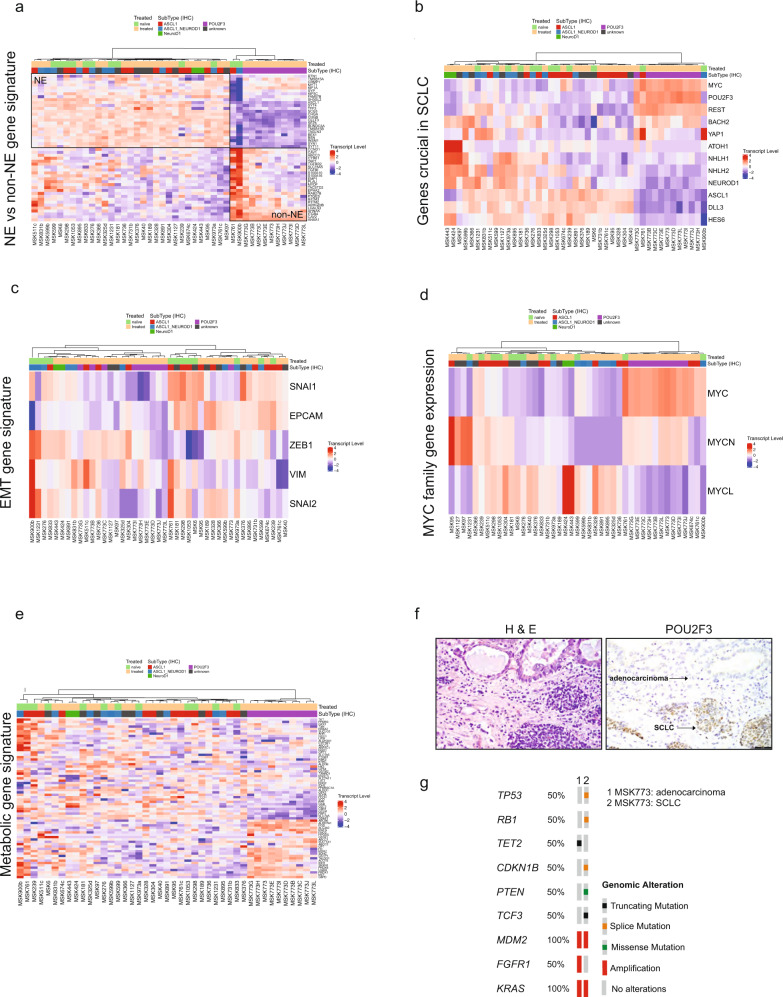
Access to clinically relevant small cell lung cancer (SCLC) tissue is limited because surgical resection is rare in metastatic SCLC. Patient-derived xenografts (PDX) and circulating tumor cell-derived xenografts (CDX) have emerged as valuable tools to characterize SCLC. Here, we present a resource of 46 extensively annotated PDX/CDX models derived from 33 patients with SCLC. We perform multi-omic analyses, using targeted tumor next-generation sequencing, RNA-sequencing, and immunohistochemistry to deconvolute the mutational landscapes, global expression profiles, and molecular subtypes of these SCLC models. SCLC subtypes characterized by transcriptional regulators, ASCL1, NEUROD1 and POU2F3 are confirmed in this cohort. A subset of SCLC clinical specimens, including matched PDX/CDX and clinical specimen pairs, confirm that the primary features and genomic and proteomic landscapes of the tumors of origin are preserved in the derivative PDX models. This resource provides a powerful system to study SCLC biology.


Conflict of interest statement

C.M.R. has consulted regarding oncology drug development with Amgen, Daiichi Sankyo, Genentech/Roche, Ipsen, Jazz, Merck, Pfizer, Syros, and Vavotek. C.M.R. serves on the scientific advisory boards of Bridge Medicines, Earli, and Harpoon Therapeutics. T.S. has research funding from Jazz Pharmaceuticals. The remaining authors declare no competing interests.

Figures

Fig. 1
Fig. 1. Generation of the PDX/CDX panel.
a Overview of the patient-derived/circulating tumor cell-derived xenograft (PDX/CDX) cohort and clinical specimens. Samples were collected from surgical, pleural effusion, biopsy, autopsy, EBUS, Neuro Met, and CTC isolation and either engrafted into immunodeficient mice to generate PDX/CDX models or directly sent for targeted sequencing (MSK-IMPACT) and Immunohistochemistry (IHC). Created with BioRender.com. b Swimmers Plot depicting sample collection of the PDX/CDX cohort during treatment course (Platinum-based therapy— black arrow, Other therapy—gray arrow). Models derived from biopsies are annotated with a blue or gray dot (with next-generation sequencing [NGS] or not, respectively). Models derived from circulating tumor cells (CTC, sequenced with NGS) are annotated with an orange dot. Dark blue indicates NGS (MSK-IMPACT) for the clinical sample. Arrows are not to scale in terms of treatment duration.
Fig. 2
Fig. 2. Matched PDX and clinical SCLC sample analysis.
Genomic landscape in SCLC (a Clinical Samples, b patient-derived xenograft (PDX) Samples, c paired Clinical-PDX samples) samples representing putative driver alterations (i.e., excludes variants of unknown significance) in the top 20 most frequently altered genes as detected by MSK-IMPACT targeted next-generation sequencing.
Fig. 3
Fig. 3. SCLC subtype annotation and neuroendocrine markers.
a H&E and immunohistochemistry images for the indicated proteins are shown. Scale bar, 50 μM. Four representative tumors are shown. Three independent cores per sample were stained for H&E and the indicated protein with a representative example shown here. b Heatmap depicts H-scores derived from 37 scored patient-derived xenograft (PDX) tumors for the fraction of positive cells for each protein shown, as well as staining intensity. White box with a cross (MSK95, NCAM1) indicates staining failed. Source data are provided as a Source Data file. c Heatmap depicts H-scores derived from 18 paired PDX tumors and clinical samples for the fraction of positive cells for each protein shown, as well as staining intensity. White boxes with cross indicate no staining available. Source data are provided as a Source Data file. d Heatmap of gene expression of 43 PDX samples for the selected markers; ASCL1, NEUROD1, POU2F3, and YAP1. Color-coded panel on top depicts treatment status (naïve or treated) and subtype annotation based on immunohistochemistry (IHC) or RNA-sequencing. Source data are provided as a Source Data file.
Fig. 4
Fig. 4. Transcriptional profile analysis of SCLC tumors of different subtypes.
a Principal component analysis plot showing 43 patient-derived xenograft (PDX) samples color-coded based on immunohistochemistry (IHC) subtype annotation. Circles indicate four separate clusters (ASCL1-driven cluster, red; ASCL1/NEUROD1-driven cluster, blue; NEUROD1-driven cluster, green; POU2F3-driven cluster, purple). Source data are provided as a Source Data file. b Unbiased hierarchical clustering of 43 PDX samples. Color-coded panel on top depicts treatment status (naïve or treated) and subtype annotation based on IHC. Boxes indicate five separate clusters (two ASCL1/NEUROD1-driven clusters, blue; one NEUROD1-driven cluster, green; one ASCL1-driven cluster, red; one POU2F3-driven cluster, purple). Source data are provided as a Source Data file. c Sample-sample correlation plot using the top 100 highest variance genes. The Spearman correlation was used and the samples were ordered using hierarchical clustering with complete linkage. Five clusters emerged and are boxed (two ASCL1/NEUROD1-driven clusters, blue; one NEUROD1-driven cluster, green; one ASCL1-driven cluster, red; one POU2F3-driven cluster, purple). Source data are provided as a Source Data file. d Heatmap of the top 50 highly expressed genes in 43 PDX samples. Blue indicates high expression and green indicates low expression. Color key and histogram represents the normalized log 2-transformed counts. Source data are provided as a Source Data file.
Fig. 5
Fig. 5. Gene expression signatures in SCLC.
Heatmap of gene expression of 43 patient-derived xenograft (PDX) samples for the selected gene signatures; neuroendocrine (NE) vs. non-NE gene signature (a), genes crucial in SCLC (b), EMT gene signature (c), MYC family gene expression (d), and metabolic gene signature (e). Color-coded panel on top depicts treatment status (naïve or treated) and subtype annotation based on IHC. Source data are provided as a Source Data file. f H&E and immunohistochemistry image for POU2F3 are shown for the clinical MSK773. Scale bar as indicated, 20 μM. g Genomic landscape in MSK773A (adenocarcinoma) vs. MSK773A (SCLC) samples representing putative driver alterations (i.e. excludes variants of unknown significance) in altered genes as detected by MSK-IMPACT targeted next-generation sequencing assay.

References

    1. Siegel R, Naishadham D, Jemal A. Cancer statistics, 2013. CA Cancer J. Clin. 2013;63:11–30. doi: 10.3322/caac.21166. - DOI - PubMed
    1. Hann C., Wu, M. A., Rekhtman, N. & Rudin, C. M. In Cancer Principles and Practice of Oncology (Wolters Kluwer, 2019).
    1. Bernhardt EB, Jalal SI. Small cell lung cancer. Cancer Treat. Res. 2016;170:301–22. doi: 10.1007/978-3-319-40389-2_14. - DOI - PubMed
    1. Byers LA, Rudin CM. Small cell lung cancer: where do we go from here? Cancer. 2015;121:664–72. doi: 10.1002/cncr.29098. - DOI - PMC - PubMed
    1. Antonia SJ, et al. Nivolumab alone and nivolumab plus ipilimumab in recurrent small-cell lung cancer (CheckMate 032): a multicentre, open-label, phase 1/2 trial. Lancet Oncol. 2016;17:883–95. doi: 10.1016/S1470-2045(16)30098-5. - DOI - PubMed

Publication types