. 2022 Apr 19;13(1):2081.
doi: 10.1038/s41467-022-29786-4.

Multilayered regulations of alternative splicing, NMD, and protein stability control temporal induction and tissue-specific expression of TRIM46 during axon formation

Affiliations

Multilayered regulations of alternative splicing, NMD, and protein stability control temporal induction and tissue-specific expression of TRIM46 during axon formation

John K Vuong et al. Nat Commun. .

Abstract

The gene regulation underlying axon formation and its exclusiveness to neurons remains elusive. TRIM46 is postulated to determine axonal fate. We show Trim46 mRNA is expressed before axonogenesis, but TRIM46 protein level is inhibited by alternative splicing of two cassette exons coupled separately to stability controls of Trim46 mRNA and proteins, effectively inducing functional knockout of TRIM46 proteins. Exon 8 inclusion causes nonsense-mediated mRNA decay of Trim46 transcripts. PTBP2-mediated exon 10 skipping produces transcripts encoding unstable TRIM46 proteins. During axonogenesis, transcriptional activation, decreased exon 8 inclusion, and enhanced exon 10 inclusion converge to increase TRIM46 proteins, leading to its neural-specific expression. Genetic deletion of these exons alters TRIM46 protein levels and shows TRIM46 is instructive though not always required for AnkG localization nor a determinant of AnkG density. Therefore, two concurrently but independently regulated alternative exons orchestrate the temporal induction and tissue-specific expression of TRIM46 proteins to mediate axon formation.


Conflict of interest statement

The authors declare no competing interests.

Figures
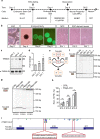
Fig. 1
Fig. 1. Trim46 exon 10 is developmentally regulated.
a Schematic protocol for embryoid body (EB) based neuronal differentiation using 46C embryonic stem cells (ESC). Differentiation medium included Glasgow’s modification of Eagle’s Minimal Essential Medium (GMEM) and Knockout Serum Replacement (KSR) for EB day 0 to day 8 while retinoic acid (RA) was used from EB day 4 to day 8. b Representative image of various differentiation stages from ESC to EB to neural progenitor cells (NPC), and into neurons from 45 independent experiments. Scale bar, 100 µm. c Western blot for TRIM46 protein expression from ESC-derived neurons on DIV 3, 5, and 7. d Quantification shows TRIM46 protein is upregulated during neuronal differentiation. Data represent mean ± SEM from 4 independent experiments. e Schematic showing mRNA isoforms produced from alternative splicing of Trim46 exon 10. The inclusion of exon 10 represents the long isoform or (Trim46L) while the exclusion of exon 10 leads to shorter isoform (Trim46S). F1 and R1 show the location of primers for RT-PCR analysis of Trim46 splicing. f Gel image shows isoform expression of Trim46 mRNA in WT EBs on day 8 to ESC-derived neurons on DIV 7 during differentiation from 4 independent experiments. g Gel image highlighting alternative splicing of Trim46 exon 10 between CTRL and Ptbp2-cKO mouse neocortices on E14.5, E16.5, and E18.5 from 3 independent experiments. h Splicing quantification shows upregulation of Trim46 exon 10 PSI (percent spliced-in) in Ptbp2-cKO neocortices. Data is represented as mean ± SEM. Statistics: t-test, two-tailed, unpaired; (E14.5: CTRL, n = 7 and KO, n = 3; *p = 0.02133; E16.5: CTRL, n = 7 and KO, n = 3; **p = 0.003421; E18.5: CTRL, n = 3 and KO, n = 2; *p = 0.02448). i Genome browser track of E18.5 PTBP2 CLIP-Seq shows multiple distinct PTBP2 binding sites located in Trim46 introns 9 and 10. Two prominent binding regions are highlighted.
Fig. 2
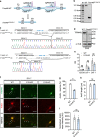
Fig. 2. Presumptive endogenous TRIM46S protein is undetectable.
a Immunoblot for TRIM46 protein in the supernatant and pellet fraction from total lysate of WT ESC-derived neurons on DIV 3. Whole cell lysates from N2a cells expressing FLAG-TRIM46L and FLAG-TRIM46S proteins were used as a positive control. Asterisk (*) denotes nonspecific band. b Immunoprecipitation (IP) using protein A magnetic beads incubated with TRIM46 antibody or CTRL IgG to pulldown FLAG-TRIM46L and FLAG-TRIM46S proteins expressed in N2a cells. c P10 cortices (CTX) and d E12.5 mouse brains used in TRIM46-IP experiment to detect endogenous TRIM46 protein isoforms. CTRL-IP used IgG for immunoprecipitation. The two lanes on the right are positive controls showing the position of the expected protein isoforms ran on the same gel: N2a cells expressing FLAG-TRIM46L and FLAG-TRIM46S. e CRISPR/Cas9 strategy to generate 3xFLAG-knock-in:Trim46 (3xFKI:Trim46) cell line from WT ESC using single-stranded oligo DNA (ssODN) along with exon 1-sgRNA (E1 sgRNA) targeting exon 1. After homology-dependent repair, 3xFLAG is introduced to the endogenous Trim46 locus. F2 and R2 indicate positions of genotyping primers annealing to 5’UTR and exon 1 of Trim46. f Schematic CRISPR/Cas9-based process in producing gene edited cell lines through lipofectamine-based co-transfection of Cas9-sgRNA plasmid, ssODN, and a GFP reporter plasmid. CRISPR/Cas9-edited cell lines were generated by selecting GFP+ colony and diluting cells into 96-well plates for screening. Identification of single-cell derived colonies was performed by genotyping and verified by Sanger sequencing. g PCR results showing genomic DNA band representing the 3xFLAG knock-in element of ES cell line, 3xFKI:Trim46 using primers shown in e. Expected size for band of knock-in is 741 bp. h Sanger sequencing confirming 3xFLAG DNA sequence in  3xFKI:Trim46 cell line. i Western blot using FLAG antibody for endogenously tagged FLAG-TRIM46 protein from 3xFKI:Trim46. Expected protein sizes of 3xFLAG-TRIM46L and 3xFLAG-TRIM46S protein isoforms are 86 kDa and 63 kDa, respectively. The right two lanes show the positive control (but with 1XFLAG): FLAG-TRIM46L and FLAG-TRIM46S expressed in N2a cells. j FLAG-IP experiment to detect 3xFLAG-TRIM46 protein isoforms using FLAG magnetic beads against lysate from 3xFKI:Trim46 ESC-derived neurons on DIV 3. The last lane is the positive control showing the positions FLAG-TRIM46L and FLAG-TRIM46S co-expressed in N2a cells. Asterisk (*) indicates various nonspecific bands. All experiments were repeated at least three times.
Fig. 3
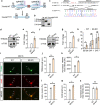
Fig. 3. TRIM46S protein variant is less stable than TRIM46L protein.
a Expression of FLAG-TRIM46 proteins in N2a cells with transfection of increasing FLAG-TRIM46L/S plasmid amounts from 0.1 to 1 μg, compensated with CAGIG vector to make total transfection amount 1 μg. GFP is used as an internal control. b Quantification shows FLAG-TRIM46S protein is expressed substantially less than FLAG-TRIM46L protein with transfection of 0.1, 0.2, and 0.4 μg plasmids. Data is represented as mean ± SD. Statistics: t-test, one-tailed, paired; Statistically not significant, (ns); n = 3 independent experiments; (0.1 μg, *p = 0.02331; 0.2 μg, *p = 0.01438; 0.4 μg, *p = 0.03036; 1.0 μg, ns = 0.25465). c Protein stability test in N2a cells transfected with 0.2 μg plasmids FLAG-Trim46L or FLAG-Trim46S. Lysates were collected at 0 h as the control versus cycloheximide (CHX) treatment over 1, 3, 6, 12, and 24 h. d. The graph shows significantly less FLAG-TRIM46S protein remains over time in comparison to FLAG-TRIM46L protein after CHX treatment. Data is represented as mean ± SEM. Statistics: t-test, one-tailed, paired; n = 3 independent experiments; Statistically not significant (ns); (1 h, ns = 0.2928; 3 h, ns = 0.1077; 6 h, *p = 0.03152; 12 h, *p = 0.04761; 24 h, **p = 0.007146). The CHX-based stability assay determined the half-life of FLAG-TRIM46S protein, which was significantly shorter than and FLAG-TRIM46L protein. e FLAG-TRIM46 protein isoforms expressing in N2a cells are substantially upregulated under proteasomal inhibition via MG132 treatment. Asterisk (*) represents nonspecific bands. f The graph shows FLAG-TRIM46S protein is more sensitive to proteasomal repression than the FLAG-TRIM46L isoform. TRIM46 protein quantification between DMSO and MG132 is normalized to isoform of interest. Data is represented as mean ± SEM. Statistics: t-test, two-tailed, paired; n = 3 independent experiments; (FLAG-TRIM46L: DMSO v. MG132, ***p = 0.0009153; FLAG-TRIM46S: DMSO v. MG132, **p = 0.004244; MG132: FLAG-TRIM46L v. FLAG-TRIM46S, *p = 0.01427). g FLAG-TRIM46 protein expression is not affected by the lysosomal pathway as demonstrated by western blot for FLAG and GFP between H2O and NH4Cl treated N2a cells; n = 2 independent experiments showing the same results.
Fig. 4
Fig. 4. Ablation of exon 10 results in loss of endogenous TRIM46L protein and leads to reduced AnkG assembly at the proximal axon.
a Schematic of CRISPR/Cas9 strategy for the deletion of Trim46 exon 10 in WT ESC. SgRNAs i9 and i10 denote guide RNAs targeting introns 9 and 10 for exon 10 deletion through Cas9 activity. F3 and R3 indicate genotyping primers annealing to exon 9 and 11. Arrow represents edited locus showing change from WT to mutant Trim46ΔE10/ΔE10 (E10-KO). b Genotyping results for WT and Trim46ΔE10/ΔE10 cell line. Band sizes are 1863 bp, 530 bp, and 513 bp for WT, Trim46ΔE10/E10 allele 1, and Trim46ΔE10/E10 allele 2, respectively from 5 independent experiments. c Sanger sequencing of PCR product shows loss of exon 10 in genomic DNA from Trim46ΔE10/ΔE10 cell line. Top and bottom panel shows exon 10 deletion in chromatograms of E10-KO alleles #1 and #2 aligned to WT sequence. d Western blot analysis from ESC-derived neurons on DIV 5 confirms loss of TRIM46L protein in E10-KO cell line from 6 independent experiments. Weak bands around 80 kDa are nonspecific. e RT-qPCR for total Trim46 mRNA levels between WT and E10-KO from EB day 8, DIV 1, and DIV 7. Data is represented as mean ± SD; Statistics: t-test, two-tailed, unpaired: WT v. E10-KO; EB D8, ns = 0.28179786, DIV 1, ns = 0.28175346, DIV 7, ns = 0.3096017; WT, n = 3 biological replicates. f ESC-derived neurons on DIV 7 from WT and E10-KO stained for TRIM46 (green) and AnkG (red). Arrowhead denotes TRIM46 or AnkG signal at the AIS and asterisk (*) denotes nonspecific TRIM46 somatic staining. Scale bars, 10 μm. g Quantification between WT and E10-KO for AnkG-positive neurons (%), (**p = 0.005941); h AnkG length (μm), (ns = 0.3699); and i Normalized AnkG mean intensity in arbitrary units (AU), (ns = 0.6029); WT, n = 160 and E10-KO, n = 216 from 3 independent experiments. Data is represented as mean ± SEM. Statistics: t-test, two-tailed, paired; Statistically not significant, (ns).
Fig. 5
Fig. 5. Exon 8 inclusion is developmentally downregulated and leads to nonsense mediated decay of Trim46 transcripts.
a Schematic showing alternative splicing regulation on Trim46 expression through AS-NMD control of exon 8. The inclusion of exon 8 alters the reading frame and leads to a premature termination codon (PTC) in exon 9 while exon 8 exclusion leads to normal termination codon (NTC) in exon 11. Red stop signs represent stop codons. F4 and R4 indicate the location of primers for RT-PCR analysis of Trim46 exon 8 splicing detecting NMD isoform (E8+) and non-NMD isoform (E8-). b Developmental Trim46 mRNA expression of NMD and non-NMD isoforms in WT ESC-derived neural progenitors and neurons from multiple stages during axon formation: day 8, DIV 1, 3, 5, and 7. N = 2 shows the same results. Bracketed asterisk points to nonspecific/heteroduplex bands. c Gel image highlighting substantial increase of E8+ Trim46 isoform under NMD inhibition (with CHX) from DIV 1 primary cortical neurons cultured from WT E13.5 neocortices from 2 independent experiments. d Normalization of Trim46-NMD transcripts by the non-NMD transcripts in DMSO and CHX-treated cortical neurons (n = 5). Data is represented as mean ± SD; Statistics; t-test, two-tailed, unpaired; (***p = 1.0892 × 10−10). e Gel image shows upregulation of Trim46-NMD isoform in the absence of UPF2 in mouse neocortices at E14.5 and P1 from 3 independent experiments. f Normalization of Trim46-NMD isoform by non-NMD isoform in WT and Upf2-cKO neocortices. Data is represented as mean ± SD. Statistics; t-test, two-tail, unpaired; (E14.5: WT, n = 3 and KO, n = 4, ***p = 1.2823 × 10−5); (P1: WT, n = 2 and KO, n = 5, ***p = 1.45171 × 10−5). g Depletion of Upf1 displays an increase in E8+ Trim46 isoform from 2 independent experiments. h Quantification of Trim46-NMD transcripts in siCTRL and siUPF1 transfected N2a (n = 3). Data is represented as mean ± SD. Statistics: t-test, two-tailed, unpaired; (***p = 2.92045 × 10−5). i The PTC generated by the E8+ isoform of Trim46 is conserved in annotated species. UGA represents PTC highlighted in green. j Western blot shows upregulated TRIM46 protein expression during development in E16.5 and P0 neocortices. Asterisk (*) denotes nonspecific bands around 60 kDa.
Fig. 6
Fig. 6. Ablation of exon 8 increases TRIM46 protein and leads to enhanced AnkG localization to the proximal axon.
a Schematic CRISPR/Cas9 strategy to convert parental WT ESC to mutant exon 8-KO. Graphical representation of Trim46 locus showing sgRNAs targeting introns 7 and 8 to generate exon 8 deletion. F5 and R5 denote approximate location of genotyping primers to detect removal of exon 8. Arrow represents edited locus showing change from WT to mutant Trim46ΔE8/ΔE8 or (E8-KO). b Genotyping results of WT and Trim46ΔE8/ΔE8 ESC. Band sizes are 739 bp and 409 for WT and Trim46ΔE8/ΔE8, respectively from 5 independent experiments. c Sanger sequencing of PCR product from genomic DNA confirms exon 8 deletion in E8-KO ES cell line. Top panel shows sequence alignment between WT and E8-KO lines and the bottom panel shows chromatogram of E8-KO mutant highlighting sequence of intron 7 preceding the 330 bp deletion of exon 8 and the immediate downstream sequences. dg. Western blot highlights upregulated TRIM46 protein expression in exon 8 deletion mutants from ESC-derived neurons on DIV 3 and DIV 5. Protein quantification for TRIM46L protein between WT and E8-KO neurons on DIV 3 and DIV 5; n = 4 independent experiments; Data is represented as mean ± SEM. Statistics: t-test, two-tailed, paired; (DIV 3: WT v. E8-KO, *p = 0.02447; DIV 5: WT v. E8-KO, *p = 0.02008). h RT-qPCR for Trim46 total mRNA levels between WT and E8-KO from EB day 8, DIV 1, and DIV 7. Data is represented as mean ± SD; Statistics: t-test, two-tailed, unpaired: WT v. E8-KO; EB D8, ns = 0.02091317, DIV 1, ns = 0.27058758, DIV 7, ns = 0.65857523; WT, n = 3 biological replicates. i ESC-derived neurons of WT and E8-KO on DIV 3 stained for TRIM46 (green) and AnkG (red). Arrowhead denotes TRIM46 signal at the proximal axon and asterisk (*) denotes nonspecific TRIM46 somatic staining. Scale bars, 10 μm. j, k. Quantification between WT and E8-KO neurons on DIV 3 for TRIM46 length (μm), (**p = 0.001351) and normalized TRIM46 mean intensity in arbitrary units (AU), (*p = 0.04061). l The deletion effect of Trim46 exon 8 between WT and E8-KO neurons on DIV 3 for percentage of AnkG-positive neurons at the AIS, *p = 0.02048; m, AnkG length (μm), *p = 0.01743; and n normalized AnkG mean intensity in arbitrary units (AU), ns = 0.7097. Data is represented as mean ± SEM; WT, n = 130 and E8-KO, n = 154 which represent 3 independent differentiation experiments; Statistics: t-test, two tailed, paired.
Fig. 7
Fig. 7. Exon 8 and Exon 10 splicing enforces tissue-specific expression of TRIM46.
a Steady-state total Trim46 mRNA expression (TPM) of mouse adult tissues. RNA-seq data was obtained from ENCODE (Thomas Gingera’s lab). The neural tissues are highlighted in red. The same dataset was used to calculate b exon 8 exclusion (%), c exon 8− isoform expression level (TPM), d exon 10 inclusion (%), e exon 10+ isoform expression level (TPM). f tissue specificity index τ of estimated transcriptional output, steady-state mRNA levels, exon 10+ isoform, and exon 8− isoform.

Similar articles

Cited by

References

    1. de la Torre-Ubieta L, Bonni A. Transcriptional regulation of neuronal polarity and morphogenesis in the mammalian brain. Neuron. 2011;72:22–40. doi: 10.1016/j.neuron.2011.09.018. - DOI - PMC - PubMed
    1. Namba T, et al. Pioneering axons regulate neuronal polarization in the developing cerebral cortex. Neuron. 2014;81:814–829. doi: 10.1016/j.neuron.2013.12.015. - DOI - PubMed
    1. Tahirovic S, et al. Rac1 regulates neuronal polarization through the WAVE complex. J. Neurosci. 2010;30:6930–6943. doi: 10.1523/JNEUROSCI.5395-09.2010. - DOI - PMC - PubMed
    1. van Beuningen SFB, et al. TRIM46 controls neuronal polarity and axon specification by driving the formation of parallel microtubule arrays. Neuron. 2015;88:1208–1226. doi: 10.1016/j.neuron.2015.11.012. - DOI - PubMed
    1. Chen S, et al. Regulation of microtubule stability and organization by mammalian Par3 in specifying neuronal polarity. Dev. Cell. 2013;24:26–40. doi: 10.1016/j.devcel.2012.11.014. - DOI - PMC - PubMed

Publication types