. 2022 Apr 19;13(1):2023.
doi: 10.1038/s41467-022-29517-9.

Heterogeneity of neuroendocrine transcriptional states in metastatic small cell lung cancers and patient-derived models

Affiliations

Heterogeneity of neuroendocrine transcriptional states in metastatic small cell lung cancers and patient-derived models

Delphine Lissa et al. Nat Commun. .

Abstract

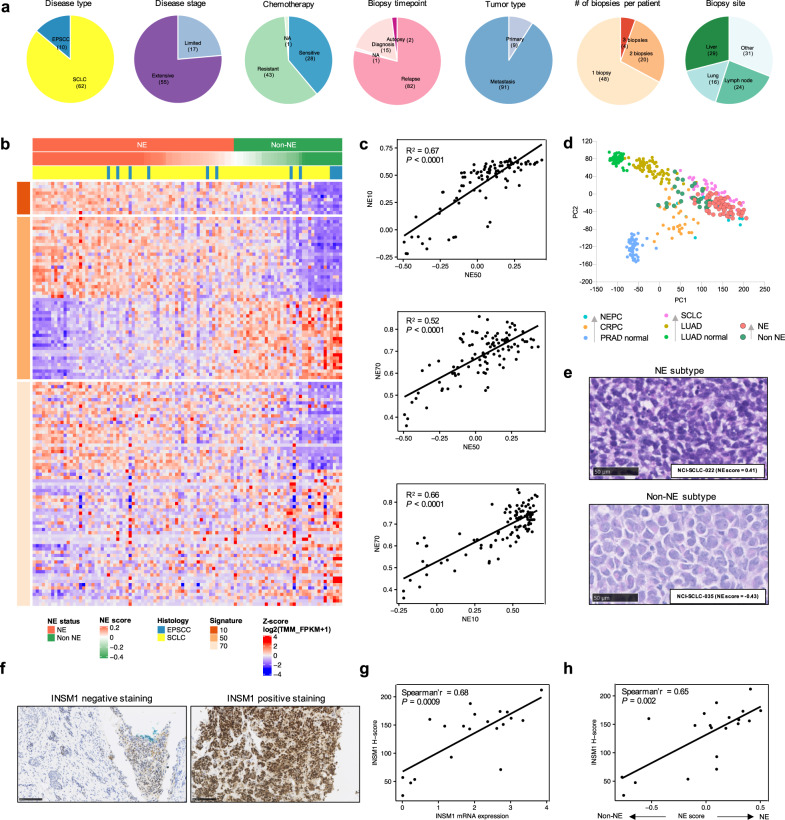
Molecular subtypes of small cell lung cancer (SCLC) defined by the expression of key transcription regulators have recently been proposed in cell lines and limited number of primary tumors. The clinical and biological implications of neuroendocrine (NE) subtypes in metastatic SCLC, and the extent to which they vary within and between patient tumors and in patient-derived models is not known. We integrate histology, transcriptome, exome, and treatment outcomes of SCLC from a range of metastatic sites, revealing complex intra- and intertumoral heterogeneity of NE differentiation. Transcriptomic analysis confirms previously described subtypes based on ASCL1, NEUROD1, POU2F3, YAP1, and ATOH1 expression, and reveal a clinical subtype with hybrid NE and non-NE phenotypes, marked by chemotherapy-resistance and exceedingly poor outcomes. NE tumors are more likely to have RB1, NOTCH, and chromatin modifier gene mutations, upregulation of DNA damage response genes, and are more likely to respond to replication stress targeted therapies. In contrast, patients preferentially benefited from immunotherapy if their tumors were non-NE. Transcriptional phenotypes strongly skew towards the NE state in patient-derived model systems, an observation that was confirmed in paired patient-matched tumors and xenografts. We provide a framework that unifies transcriptomic and genomic dimensions of metastatic SCLC. The marked differences in transcriptional diversity between patient tumors and model systems are likely to have implications in development of novel therapeutic agents.


Conflict of interest statement

D.L. in an employee of AstraZeneca. A.T. report research funding to the institution from the following entities: EMD Serono, AstraZeneca, Tarveda Therapeutics, Prolynx Inc, and Immunomedics. The other authors have no competing interest to declare. None of the authors have competing non-financial interests.

Figures

Fig. 1
Fig. 1. Neuroendocrine differentiation defines distinct SCNC subtypes.
a Pie charts summarizing patient and biopsy characteristics. b Heatmap of the 10-gene (top panel), 50-gene (middle panel), and 70-gene (lower panel) neuroendocrine signatures. The 50-gene signature was derived from differentially expressed genes between matched normal adrenal cortex and medulla, 25 genes each correlating positively and negatively with neuroendocrine differentiation. The 70-gene and 10-gene signatures were derived from resistant prostate cancers with small cell or neuroendocrine features. Neuroendocrine scores and subtypes (NE or non-NE) derived from the 50-gene signature, and histology are indicated above the heatmap. c Pearson correlation between the three neuroendocrine signatures. R-squared values and the P-values are indicated (P < 2.2e-16). d Projection of 100 SCNC tumors onto the PCA developed by Balanis et al., to evaluate the degree of neuroendocrine differentiation (trajectory indicated by arrows). e Representative photomicrograph images of H&E-stained small cell lung cancer of NE and non-NE subtypes. Black bars represent 50 μm (observations were repeated independently two times). f Representative images of IHC staining for INSM1 (observations were repeated independently two times). g Spearman correlation between INSM1 mRNA level and INSM1 H-score (n = 20 tumors). h Spearman correlation between 50-gene neuroendocrine signature score and INSM1 H-score (n = 20 tumors). All tests are two-tailed. Abbreviations: NE Neuroendocrine differentiation; SCLC Small cell lung cancer; EPSCC Extrapulmonary small cell cancer; TMM Trimmed Mean of M-values; FPKM Fragments Per Kilobase of Exon Per Million Fragments Mapped; H&E Hematoxylin and Eosin; NEPC neuroendocrine prostate cancer; CRPC castration-resistant prostate cancer; PRAD prostate adenocarcinoma; LUAD lung adenocarcinoma; PCA principal component analysis; NA not assessed.
Fig. 2
Fig. 2. Intratumoral heterogeneity of neuroendocrine differentiation in patient tumors and model systems.
a CIBERSORT analysis of the 50-gene signature in 100 tumors grouped by NE subtype (left stacked bar chart). Relative proportion of NE and non-NE cells within each SCNC NE subtype (right box plot) (n = 100 tumors; data are presented as mean ± SEM). Two-tailed Student-t test, ****P = 2.07e-20. b Representative photomicrograph images of H&E-stained small cell cancer of the NE subtype with heterogenous morphological features (observations were repeated independently two times). c Intratumoral proportion of NE cells based on CIBERSORT deconvolution in 84 recurrent and metastatic tumors from the current cohort and previously described cohorts of 81 early-stage tumors, 32 PDX, 120 CDX, models, and 39 immortalized cell lines,. Kruskal–Wallis test followed by Dunn’s multiple comparisons test with BH correction, ****P < 0.0001 (ranging from P = 2.13e-26 to 2.08e-07), *P = 0.023. d CIBERSORT analysis of the 50-gene signature in six patient-matched tumor biopsies (T) and xenograft tumors (P). e Proportion of NE cells based on CIBERSORT deconvolution in 6 PDX and corresponding donor patient tumors. Paired t-test, P = 0.048 (f) Box plots showing mRNA levels in NE and non-NE tumors for the four transcription factors. Two-tailed Mann–Whitney U-test, ****P < 0.0001 (ranging from P = 2.53e-09 to 4.56e-05), **P = 0.00103, ns, not significant (n = 72 patients). g Heatmap generated by unsupervised hierarchal clustering of the four transcription factors in 72 patients. Neuroendocrine scores and NE status derived from the 50-gene signature, and the molecular subtypes derived from the clustering and the histology are indicated above the heatmap. h Supervised PCA using the expression of the four transcription factors. Each dot represents a patient colored by the transcriptomic category. All tests are two-tailed. All box plots indicate the inter-quartile range (IQR), the middle line corresponds to the median, and the upper and lower whiskers represent observations within 1.5*IQR (Q3 + 1.5*IQR or Q1 − 1.5*IQR). Abbreviations: NE neuroendocrine differentiation; TMM Trimmed Mean of M-values; FPKM Fragments Per Kilobase of Exon Per Million Fragments Mapped; PCA principal component analysis. PDX patient-delivered xenografts; CDX CTC-derived xenografts.
Fig. 3
Fig. 3. SCNC subtypes exhibit unique transcriptional programs.
a, b, e, f Box plots showing mRNA levels in NE and non-NE tumors or in SCNC molecular subtypes, for (a, b) the MYC family of genes and (e, f) the Notch signaling pathway. Two-tailed Mann–Whitney U-test, ****P < 0.0001, ***P < 0.001, **P < 0.01, *P < 0.05, ns, not significant (n = 72 patients). c CIBERSORT analysis of the gene signatures derived at different time points of MYC-driven tumor transition toward a non-NE phenotype, in 72 patients grouped by molecular subtype. d Box plot of the relative proportion of early, mid/late and late tumor phenotypes within each SCNC molecular subtype. Two-tailed Mann–Whitney U-test with BH adjustment, ****P < 0.0001, *P < 0.05 (n = 72 patients). g Pearson correlation between the 50-gene signature score and an epithelial-mesenchymal transition (EMT) score determined by ssGSEA. Pearson’s R value and P-value are indicated. h Supervised PCA of gene expression data for 12 selected genes associating with SCNC transcriptome subtype, MYC, and Notch signaling. Each dot represents a patient colored by the transcriptomic category. Gray arrows correspond to PCA loadings. All tests are two-tailed. All box plots indicate the inter-quartile range (IQR), the middle line corresponds to the median, and the upper and lower whiskers represent observations within 1.5*IQR (Q3 + 1.5*IQR or Q1 − 1.5*IQR). Abbreviations: NE neuroendocrine differentiation; TMM Trimmed Mean of M-values; FPKM Fragments Per Kilobase of Exon Per Million Fragments Mapped; PCA principal component analysis; EMT epithelial-mesenchymal transition; ssGSEA single sample gene set enrichment analysis.
Fig. 4
Fig. 4. SCNC subtypes are characterized by distinct biological features.
a Heatmap of 25 DDR and 14 immune genes in 100 tumors. Neuroendocrine scores and NE status derived from the 50-gene signature are indicated on top. b, c Pearson correlation between the 50-gene signature score and (b) a replication stress response score or (c) an antigen processing and presenting machinery (APM) signature score. Pearson’s R values and P-values are indicated. A box plot of the distribution of the signature scores between NE and non-NE tumors is shown on the right of each graph. Two-tailed Mann–Whitney U-test, ****P = 3.79e-07, ***P = 0.0004 (n = 72 patients). d Heatmap clustered with Pearson’s correlation and average linkage of the top 1000 pathways differentially regulated between NE and non-NE tumors. The NEv2-related pathways are highlighted by a purple square on the heatmap (e) Distribution of correlations between neuroendocrine scores and selected pathway gene sets from BioCarta, Hallmark, KEGG, PID and Reactome. f Box plot of the NES for four xenobiotic metabolism and drug transporter pathways in NEv2-like and other tumors. Two-tailed Mann–Whitney U-test, ****P < 0.0001 (ranging from P = 1.72e-07 to 1.43e-06) (n = 72 patients). All tests are two-tailed. All box plots indicate the inter-quartile range (IQR), the middle line corresponds to the median, and the upper and lower whiskers represent observations within 1.5*IQR (Q3  +  1.5*IQR or Q1 − 1.5*IQR). Abbreviations: NE Neuroendocrine differentiation; TMM Trimmed Mean of M-values; FPKM Fragments Per Kilobase of Exon Per Million Fragments Mapped; DDR DNA damage response; ssGSEA single sample gene set enrichment analysis; NES Normalized Enrichment score.
Fig. 5
Fig. 5. Genomic alteration profiles of SCNC subtypes.
Genomic characteristics of NE (n = 22) and non-NE (n = 12) tumors. a Bar graph of TMB in 34 patients. Two-tailed Mann–Whitney U-test, **P = 0.0021. b Mutational signature proportions. c Neuroendocrine status (NE vs. non-NE), 50-gene signature score, histology (SCLC vs. EPSCC) and smoking status (former/current vs. never). Top heatmap indicates mutations in genes of TP53, RB1, NOTCH paralogues, and chromatin modifiers. Bar charts on the right of the heatmap indicates frequency of mutations in NE vs. non-NE tumors. Bottom heatmap shows copy number alteration of TP53, RB1, and MYC paralogue genes. Box plots indicate the inter-quartile range (IQR), the middle line corresponds to the median, and the upper and lower whiskers represent observations within 1.5*IQR (Q3 + 1.5*IQR or Q1 − 1.5*IQR). Abbreviations: NE neuroendocrine differentiation; TMB total mutational burden; COSMIC The Catalog of Somatic Mutations in Cancer; SCLC small cell lung cancer; EPSCC extrapulmonary small cell cancer.
Fig. 6
Fig. 6. Association between SCNC subtypes and response to therapy.
a Kaplan–Meier curves of OS from the date of diagnosis in patients with tumors of NE and non-NE phenotypes. b Proportion of patients deriving clinical benefit from ATR inhibition and immunotherapy categorized by NE subtypes. Two-tailed chi-square, **P = 0.0024, *P = 0.0464. c Kaplan–Meier curves of PFS in patients treated with ATR inhibitor and immunotherapy categorized by subtypes. d Univariate and multivariate Cox proportional-hazard regression analyses of PFS in patients with NE tumors. e Kaplan–Meier curves of OS from the date of diagnosis in patients with NEv2-like subtype and others. HR and p-values by log-rank test are indicated. P-values marked with bold indicate statistical significance. Abbreviations: NE neuroendocrine differentiation; OS overall survival; HR hazard ratio; CI confidence interval; ATRi ataxia telangiectasia and Rad3-related inhibitor; ICI immune checkpoint inhibitor; PFS progression free survival.
Fig. 7
Fig. 7. Summary of molecular characteristics and potential therapeutic vulnerabilities in NE and non-NE SCNC.
Subtype-specific upregulated genes, IHC markers, signaling pathways, genomic alterations, therapeutic vulnerability, and resistance are displayed.

Similar articles

Cited by

References

    1. Howlader N, et al. The effect of advances in lung-cancer treatment on population mortality. N. Engl. J. Med. 2020;383:640–649. doi: 10.1056/NEJMoa1916623. - DOI - PMC - PubMed
    1. Gazdar AF, Bunn PA, Minna JD. Small-cell lung cancer: what we know, what we need to know and the path forward (vol 17, pg 725, 2017) Nat. Rev. Cancer. 2017;17:765–765. doi: 10.1038/nrc.2017.106. - DOI - PubMed
    1. Carney DN, et al. Establishment and identification of small cell lung-cancer cell-lines having classic and variant features. Cancer Res. 1985;45:2913–2923. - PubMed
    1. Rudin CM, et al. Molecular subtypes of small cell lung cancer: a synthesis of human and mouse model data. Nat. Rev. Cancer. 2019;19:289–297. doi: 10.1038/s41568-019-0133-9. - DOI - PMC - PubMed
    1. Thomas A, Pattanayak P, Szabo E, Pinsky P. Characteristics and outcomes of small cell lung cancer detected by CT screening. Chest. 2018;154:1284–1290. doi: 10.1016/j.chest.2018.07.029. - DOI - PMC - PubMed

Publication types

MeSH terms

Substances