. 2022 Apr 19;13(1):2011.
doi: 10.1038/s41467-022-29498-9.

ESR1 mutant breast cancers show elevated basal cytokeratins and immune activation

Affiliations

ESR1 mutant breast cancers show elevated basal cytokeratins and immune activation

Zheqi Li et al. Nat Commun. .

Abstract

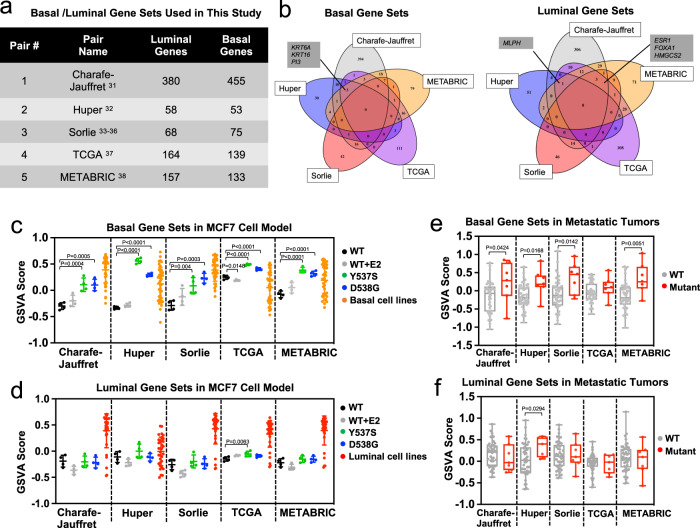
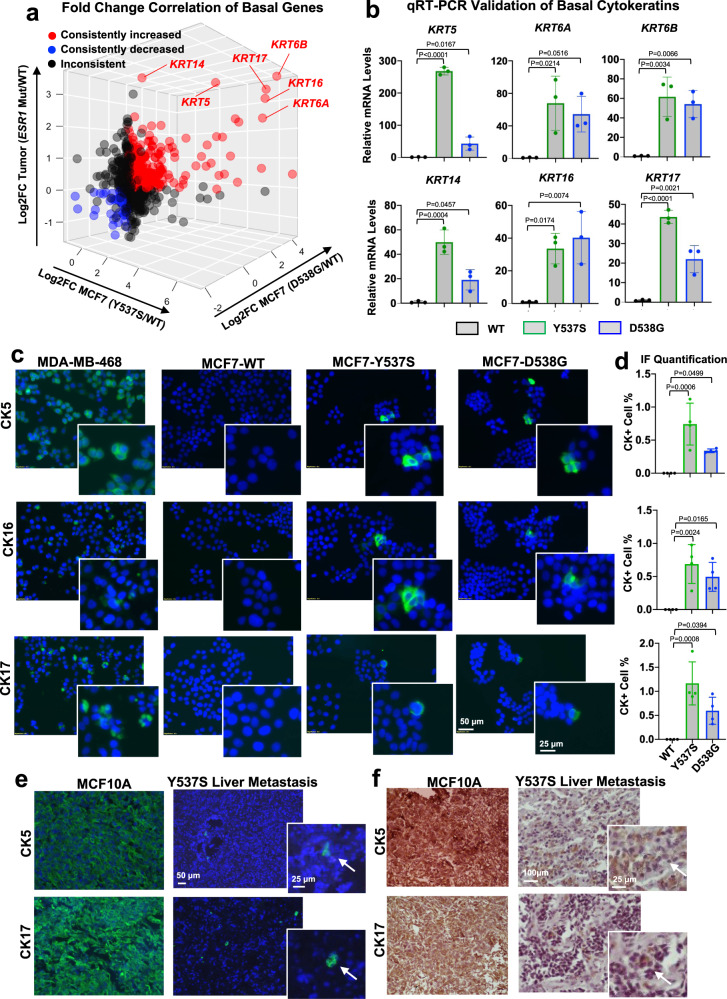
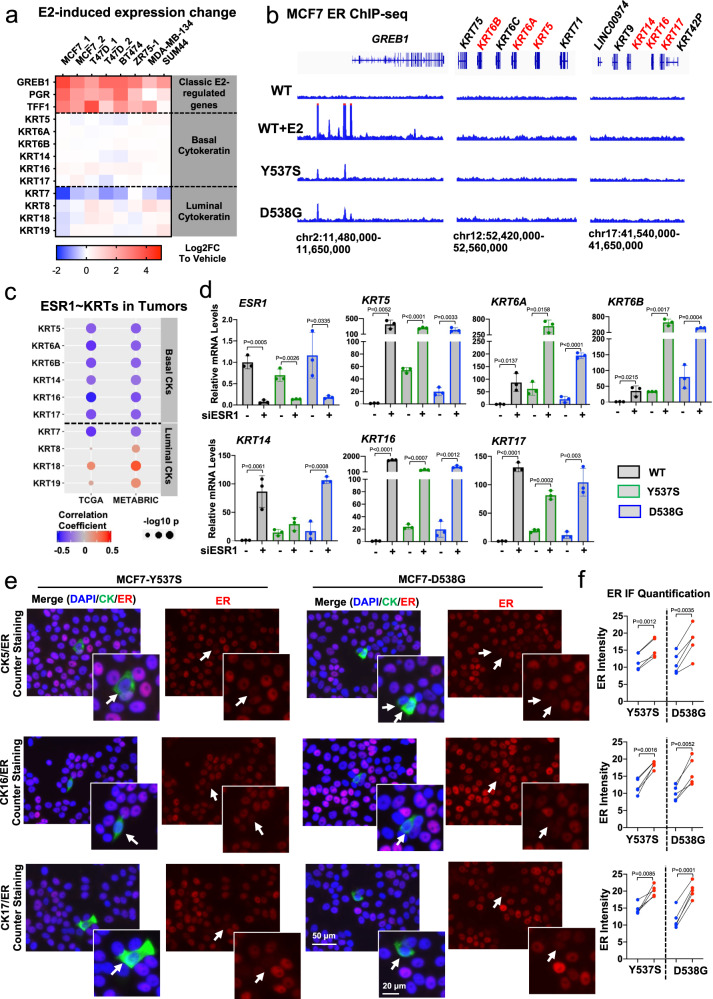
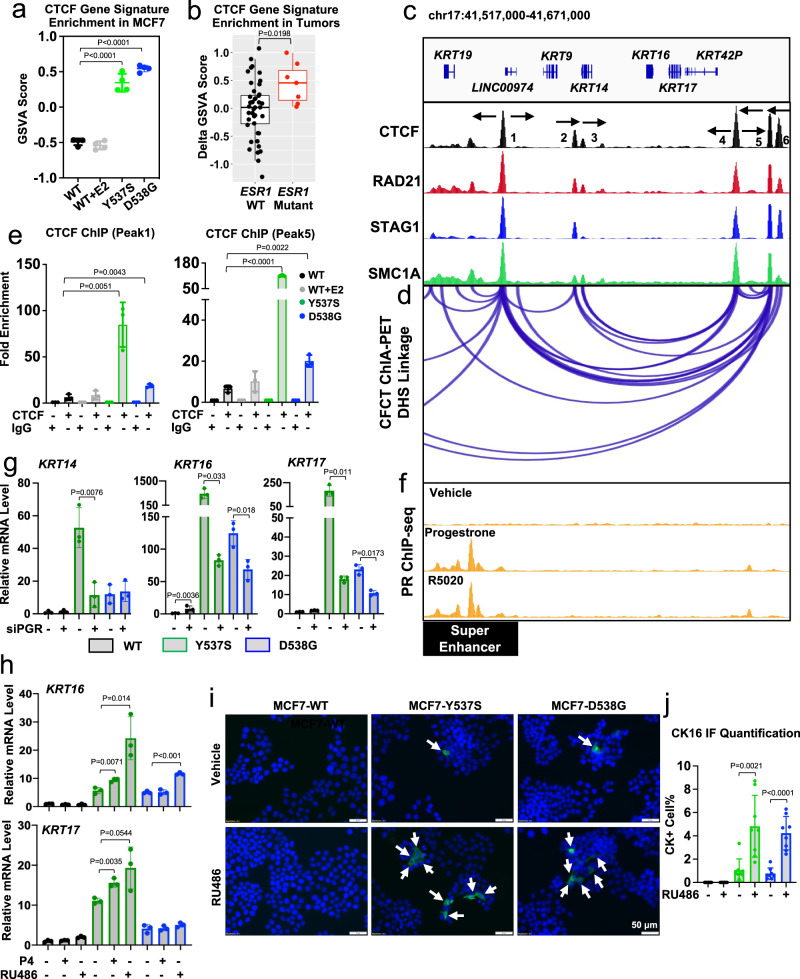
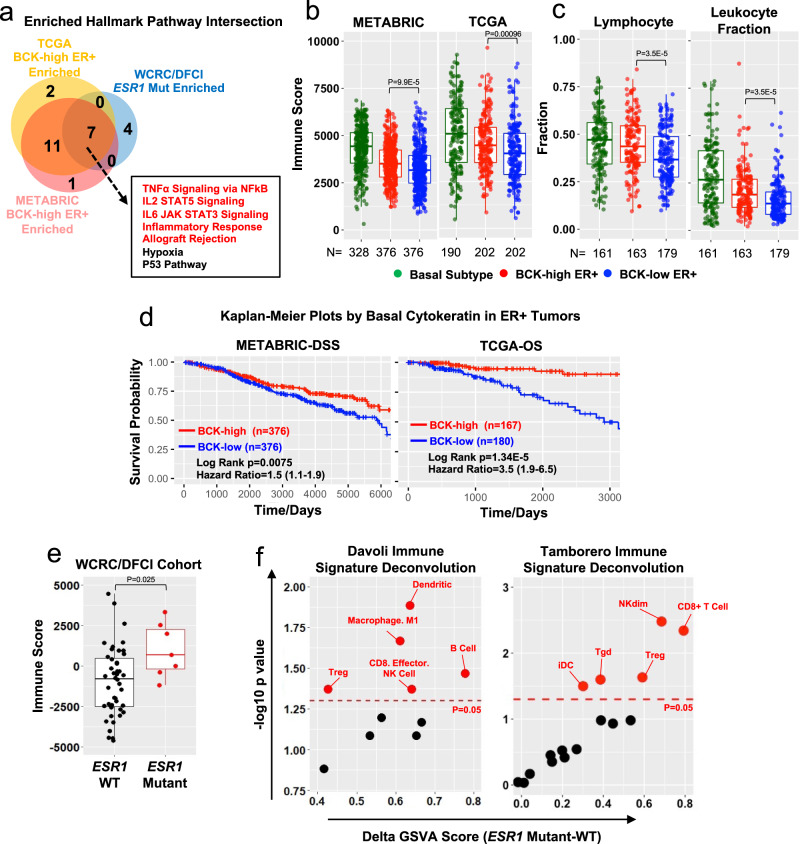
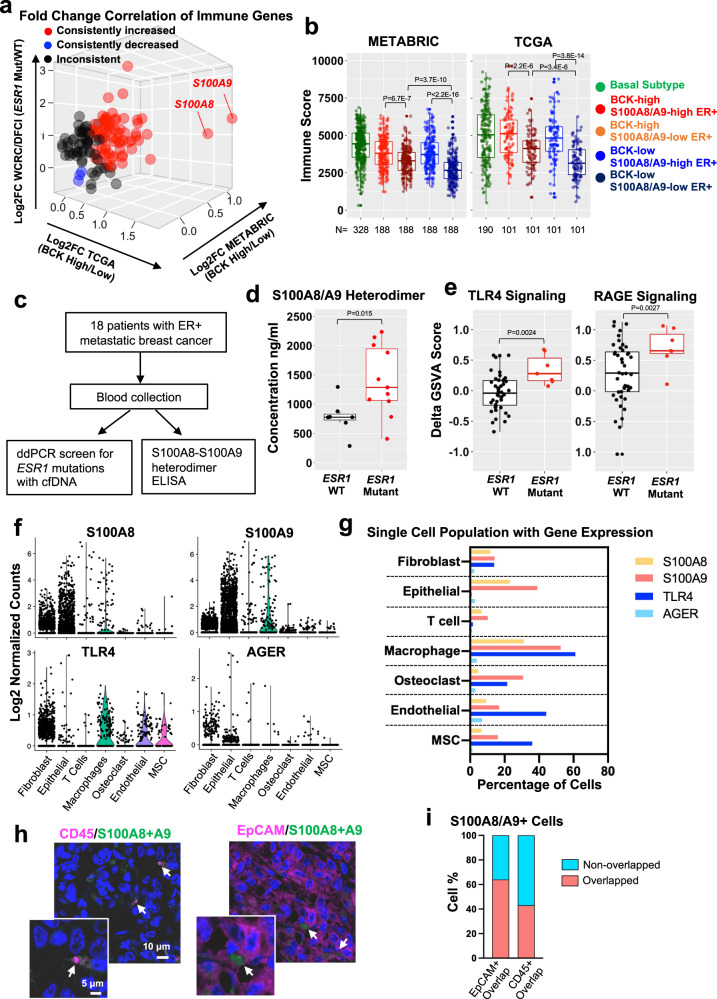
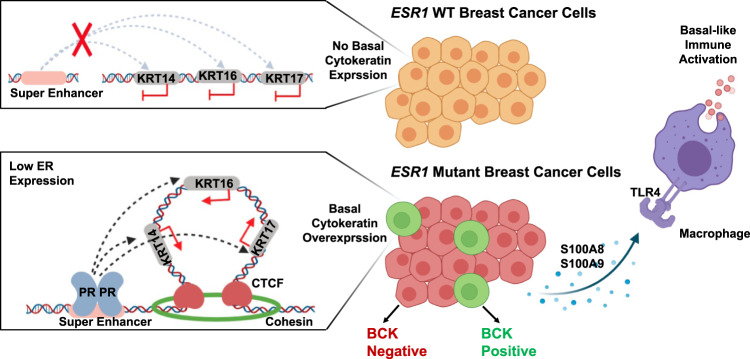
Estrogen receptor alpha (ER/ESR1) is frequently mutated in endocrine resistant ER-positive (ER+) breast cancer and linked to ligand-independent growth and metastasis. Despite the distinct clinical features of ESR1 mutations, their role in intrinsic subtype switching remains largely unknown. Here we find that ESR1 mutant cells and clinical samples show a significant enrichment of basal subtype markers, and six basal cytokeratins (BCKs) are the most enriched genes. Induction of BCKs is independent of ER binding and instead associated with chromatin reprogramming centered around a progesterone receptor-orchestrated insulated neighborhood. BCK-high ER+ primary breast tumors exhibit a number of enriched immune pathways, shared with ESR1 mutant tumors. S100A8 and S100A9 are among the most induced immune mediators and involve in tumor-stroma paracrine crosstalk inferred by single-cell RNA-seq from metastatic tumors. Collectively, these observations demonstrate that ESR1 mutant tumors gain basal features associated with increased immune activation, encouraging additional studies of immune therapeutic vulnerabilities.


Conflict of interest statement

S.Oe and A.V.L. receive research support from AstraZeneca PLC. A.V.L. is employee and consultant with UPMC Enterprises, and member of the Scientific Advisory Board, Stockholder and receives compensation from Ocean Genomics. Tsinghua University paid the stipend of University of Pittsburgh-affiliated foreign scholar Yang Wu from Tsinghua University. D.A.A.V. is cofounder and stock holder of Novasenta, Potenza, Tizona, Trishula; stock holder of Oncorus, Werewolf, Apeximmune; patents licensed and royalties of Astellas, BMS, Novasenta; scientific advisory board member—Tizona, Werewolf, F-Star, Bicara, Apeximmune; consultant of Astellas, BMS, Almirall, Incyte, G1 Therapeutics; research funding of BMS, Astellas, and Novasenta. The remaining authors declare no competing financial interests.

Figures

Fig. 1
Fig. 1. Basal breast cancer gene sets are enriched in ESR1 mutant breast cancers.
a Five pairs of luminal/basal gene sets applied in this study with gene numbers specified in each set. b Venn diagram representing the overlap of genes from the basal (left) and luminal (right) gene sets. Genes overlapping in at least four gene sets are indicated. c, d Dot plots showing GSVA score of the five pairs of basal (c) and luminal (d) gene sets enrichment in MCF7 genome-edited cell models. Four biologically independent replicates were used from the original RNA-seq data set (GSE89888) for one time computation. Scores from luminal (n = 33) and basal (n = 39) breast cancer cell lines were used as positive controls. Data are presented as mean ± SD. Dunnett’s test (two-sided) was used to compare with WT-vehicle set within each gene set. e, f Box plots representing basal (e) and luminal (f) gene set enrichments in intra-patient matched paired primary-metastatic samples. Delta GSVA score for each sample was calculated by subtracting the scores of primary tumors from the matched metastatic tumors. Box plots span the upper quartile (upper limit), median (center) and lower quartile (lower limit). Whiskers extend a maximum of 1.5× IQR. Mann–Whitney U-test (two-sided) was performed to compare the Delta GSVA scores between WT (N = 44) or ESR1 mutation-harboring (N = 7) paired tumors. Source data are provided as a Source Data file for cf.
Fig. 2
Fig. 2. Overexpression of basal cytokeratins (BCK) in ESR1 mutant breast cancer cells and tumors.
a Correlation between basal gene fold changes (FC) in MCF7-Y537S/D538G cells (normalized to WT vehicle) and intra-patient paired mutant tumors (normalized to WT tumors) (N = 742). Consistently increased or decreased genes in the two MCF7 mutant cells and tumors compared to their WT counterparts were highlighted in red or blue respectively, and six basal cytokeratin genes are indicated. Inconsistently changed genes among the three comparisons are labeled in black. b KRT5/6A/6B/14/16/17 mRNA levels in MCF7 WT and ESR1 mutant cells. Relative mRNA fold change normalized to WT cells and RPLP0 levels measured as the internal control. Each bar represents mean ± SD with three biological replicates. Representative results from three independent experiments are shown. Dunnett’s test (two-sided) was used to compare BCKs expression levels between WT and mutant cells. c Representative images of immunofluorescence staining on CK5, CK16, and CK17 in MCF7 WT and ESR1 mutant cells. Regions with CK positive cells were highlighted in the magnified images. MDA-MB-468 was included as positive control. Images were taken under ×20 magnification. d Quantification of percentages of CK positive cells in MCF7 WT and ESR1 mutant cells. Each bar represents mean ± SD from four different regions. Data shown are from one representative experiment of three independent experiments. Dunnett’s test (two-sided) was used to compare BCKs positive cell prevalence between WT and mutant cells. e, f Immunofluorescent (e) and immunohistochemistry (f) staining of CK5 and CK17 on sections from MCF10A (positive control) and a Y537S ESR1 mutant liver metastasis tissue. Images were taken under ×10 (IF) or ×20 (IHC) magnification. Subclones with CK5 or CK17 expression were further magnified and highlighted with white arrow. This experiment was done once on clinical specimens. Source data are provided as a Source Data file for a, b, d.
Fig. 3
Fig. 3. Basal cytokeratins induction is independent of mutant ER genomic binding but requires low ER expression.
a Heatmap representing fold change mRNA expression (E2/veh) of six basal cytokeratins and four luminal cytokeratins in ER+ breast cancer lines from six publicly available data sets (GSE89888, GSE94493, GSE108304, GSE3834, GSE38132, and GSE50693). GREB1, PGR, and TFF1 are canonical E2-regulated genes included as positive controls. b Genomic track showing ER binding intensities at KRT5/6A/6B and KRT14/16/17 loci from ER ChIP-seq data sets of MCF7 ESR1 mutant cells. GREB1 locus serve as a positive control. c Graphic view of Pearson correlation between expression of ESR1 and each basal or luminal cytokeratin in ER+ breast tumors in TCGA (n = 808) and METABRIC (n = 1505) cohorts. Color scale and size of dots represent correlation coefficient and significance, respectively. d qRT-PCR measurement of ESR1, KRT5/6A/6B/14/16/17 mRNA levels in MCF7 WT and ESR1 mutant cells with ESR1 siRNA knockdown for 7 days. mRNA fold changes were normalized to WT cells; RPLP0 levels were measured as internal control. Each bar represents mean ± SD with three biological replicates. Data shown are representative from three independent experiments. Student’s t-test (two-sided) was used to compare the gene expression between scramble and knockdown groups. e Representative images of ER, CK5, CK16, and CK17 staining in MCF7-Y537S and D538G cells. BCKs positive cells are highlighted with white arrows. Images were taken under ×20 magnification. f Dot plots quantifying the ER intensities in BCKs positive (blue) and the corresponding proximal negative (red) cells from each region. Individual data points from five different regions per group from one experiment, representative of three independent experiments are shown. Paired t-test (two-sided) was applied to compare ER intensities between BCKs positive and negative cells. Source data are provided as a Source Data file for a, c, d, f.
Fig. 4
Fig. 4. PR regulation of BCK expression through binding at a CTCF-driven chromatin loop.
a, b Enrichment levels of CTCF gene signature in MCF7 ESR1 mutant cells (n = 4) (a) and ESR1 WT (n = 44) and mutant (n = 7) metastases (b). Box plots span the upper quartile (upper limit), median (center) and lower quartile (lower limit). Whiskers extend a maximum of 1.5× IQR. Dunnett’s test (two-sided) (a) and Mann–Whitney U-test (two-sided) was used. c, d Genomic track illustrating the CTCF and cohesion complex (c) binding and CTCF-driven chromatin loops (d) at KRT14/16/17 proximal genomic region in MCF7 cells. CTCF motif orientations of each peak is labeled with arrows. Y-axis represents signal intensity of each track. e CTCF binding events at binding sites 1 and 5 in c. Each bar represents mean ± SD of fold enrichment normalized to IgG from three independent experiments. Pair-wise t-test (two-sided) was performed. f Genomic track view of PR ChIP-seq in MCF7 cells under R5020 and progesterone treatments. Y-axis represents signal intensity under the same scale. Super enhancer range is highlighted. g KRT14, 16, and 17 mRNA levels in MCF7 ESR1 WT and mutant cells with PGR siRNA knockdown for 7 days. Each bar represents mean ± SD of fold changes normalized to WT cells with three biological replicates as a representative from three independent experiments. Student’s t-test (two-sided) was used. h KRT16 and 17 mRNA levels in MCF7 ESR1 WT and mutant cells treated with 0.1% EtOH, 100 nM P4 or 1 μM RU486 for 3 days. Each bar represents mean ± SD of fold changes normalized to WT cells with three biological replicates as a representative from three independent experiments. Dunnett’s (two-sided) test was used. i Representative images of immunofluorescence staining of CK5 and CK16 in MCF7 WT and ESR1 mutant cells after 3 day treatment with 1% EtOH or 1 μM RU486. j Quantification of CK positive cells in i. Each bar represents mean ± SD from eight different regions combining from two independent experiments. Student’s t-test (two-sided) was used. Source data are provided as a Source Data file for a, b, e, g, h, j.
Fig. 5
Fig. 5. Gain of basal cytokeratin expression is associated with enhanced immune activation in ESR1 mutant tumors.
a Venn diagrams showing the intersection of significantly enriched hallmark pathways in three sets of comparisons: BCK-high vs low in 1) TCGA ER+ tumors (n = 202 in each group), 2) METABRIC ER+ tumors (n = 376 in each group) and 3) ESR1 mutant (n = 7) vs. WT (n = 44) metastatic tumors. BCKs high and low were defined by the upper and bottom quartiles of each subset. The seven overlapping pathways are shown in a frame, and immune-related pathways are highlighted in red. b Immune scores based on ESTIMATE evaluations in basal tumors (METABRIC n = 328; TCGA n = 190), BCK-high (METABRIC n = 376; TCGA n = 202) and low (METABRIC n = 376; TCGA n = 202) subsets of ER+ tumors. Box plots span the upper quartile (upper limit), median (center) and lower quartile (lower limit). Whiskers extend a maximum of 1.5× IQR. Mann–Whitney U-test (two-sided) was used for comparison. c Lymphocytes and leukocyte fractions comparisons among TCGA basal subtype tumors (n = 161), ER+ BCK-high (n = 163) and low (n = 179) tumors. Box plots span the upper quartile (upper limit), median (center) and lower quartile (lower limit). Whiskers extend a maximum of 1.5× IQR. Mann–Whitney U-test (two-sided) was applied. d Kaplan–Meier plots showing the disease-specific survival (DSS) (METABRIC) and overall survival (OS) (TCGA) comparing patients with ER+ BCKs high vs. low tumors. Censored patients were labeled in cross symbols. Log-rank test (two-sided) was used and hazard ratio with 95% CI were labeled. e Immune scores based on ESTIMATE evaluations in ESR1 mutant (n = 7) and WT metastatic (n = 44) lesions. Box plots span the upper quartile (upper limit), median (center) and lower quartile (lower limit). Whiskers extend a maximum of 1.5× IQR. Mann–Whitney U-test (two-sided) was used. f Dot plot showing the enrichment level alterations of immune cell subtypes in ESR1 mutant metastatic lesions using Davoli and Tamborero signatures between ESR1 mutant (n = 7) and WT (n = 44) tumors. Significantly increased immune cell subtypes in ESR1 mutant tumors were labeled in red (p < 0.05). Source data are provided as a Source Data file for bf.
Fig. 6
Fig. 6. Immune activation in ESR1 mutant tumors is associated with S100A8/A9-TLR4 paracrine crosstalk.
a Expressional fold changes of immune genes from ESTIMATE (n = 141) comparing ER+ BCK-high vs. low tumors (TCGA and METABRIC) and ESR1 WT/mutant tumors. Consistently increase, decreased or inconsistent genes in are highlighted in red, blue, and black. b BCK-high and low quantiles of ER+ tumors were further divided by the mean of S100A8 and S100A9. Immune scores were compared across all four subsets (n = 188 and 101 per group of METABRIC and TCGA) together with basal tumors (n = 328 METABRIC and n = 190 TCGA). Box plots span the upper quartile (upper limit), median (center) and lower quartile (lower limit). Whiskers extend a maximum of 1.5× IQR. Mann–Whitney U-test (two-sided) was used. c Graphical presentation of experimental strategy of d. d S100A8/9 heterodimer concentrations in plasma from patients with ESR1 WT (n = 7) and mutant (n = 11) metastatic breast cancer. Box plots span the upper quartile (upper limit), median (center) and lower quartile (lower limit). Whiskers extend a maximum of 1.5× IQR. Mann–Whitney U-test (two-sided) was utilized. This experiment was done once. e TLR4 and RAGE signature enrichments between ESR1 mutant (n = 7) and WT (n = 44) tumors. Delta GSVA score was calculated by subtracting the scores of primary tumors from the matched metastatic tumors. Box plots span the upper quartile (upper limit), median (center), and lower quartile (lower limit). Whiskers extend a maximum of 1.5× IQR. Mann–Whitney U-test (two-sided) was performed. f Violin plots showing expression of four genes by log2 normalized counts in different cell subtypes using single-cell RNA-seq data from two ER+ bone metastases. g Percent of cells expressing S100A8, S100A9, TLR4, and AGER, using single cell RNA seq data shown in f. h Immunofluorescent staining of S100A8/A9 with CD45 or EpCAM in a Y537S ESR1 mutant liver metastasis. Double positive cells are pointed out and magnified. This experiment was done once. i Percentage of S100A8/A9+ cells overlapped with EpCAM+ or CD45+ cells. Data were quantified based on six representative regions of the section. Source data are provided as a Source Data file for a, b, dg, i.
Fig. 7
Fig. 7. Graphical presentation of proposed mechanisms and relevance of basal cytokeratin induction in ESR1 mutant breast cancer.
ESR1 WT cells exhibit low basal cytokeratin expression with baseline insulated neighborhood prevalence spanning KRT14/16/17 loci. In contrast, a minor subpopulation of ESR1 mutant cells exhibit strong basal cytokeratin expression, due to PR activated enhancer at the KRT14/16/17 gene locus-spanning insulated neighborhoods. Increased expression of basal cytokeratin is associated with immune activation in ESR1 mutant tumor similar to that seen in basal tumors, at least in part mediated via enhanced S100A8/A9-TLR4 paracrine crosstalk between epithelial and stromal cells, including macrophages. Figure is generated using BioRender.

Similar articles

Cited by

References

    1. Sørlie T, et al. Gene expression patterns of breast carcinomas distinguish tumor subclasses with clinical implications. Proc. Natl Acad. Sci. 2001;98:10869–10874. doi: 10.1073/pnas.191367098. - DOI - PMC - PubMed
    1. Perou CM, et al. Molecular portraits of human breast tumours. Nature. 2000;406:747–752. doi: 10.1038/35021093. - DOI - PubMed
    1. Dai X, et al. Breast cancer intrinsic subtype classification, clinical use and future trends. Am. J. Cancer Res. 2015;5:2929. - PMC - PubMed
    1. Reis-Filho JS, Pusztai L. Gene expression profiling in breast cancer: classification, prognostication, and prediction. Lancet. 2011;378:1812–1823. doi: 10.1016/S0140-6736(11)61539-0. - DOI - PubMed
    1. Arpino G, et al. Gene expression profiling in breast cancer: a clinical perspective. Breast. 2013;22:109–120. doi: 10.1016/j.breast.2013.01.016. - DOI - PubMed

Substances