. 2022 May 27;130(11):1662-1681.
doi: 10.1161/CIRCRESAHA.121.320420. Epub 2022 Apr 20.

Perivascular Fibrosis Is Mediated by a KLF10-IL-9 Signaling Axis in CD4+ T Cells

Affiliations

Perivascular Fibrosis Is Mediated by a KLF10-IL-9 Signaling Axis in CD4+ T Cells

Rulin Zhuang et al. Circ Res. .

Abstract

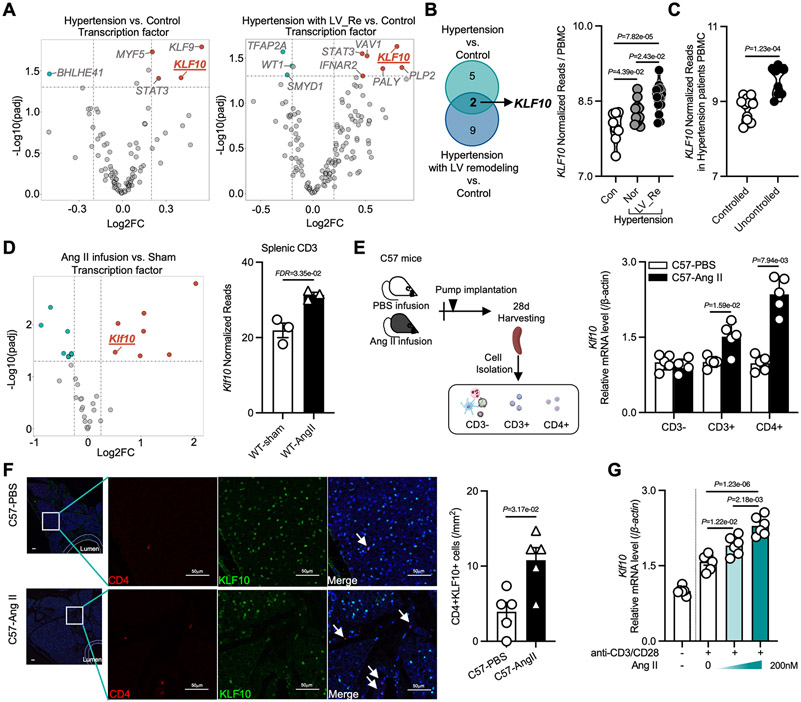
Background: Perivascular fibrosis, characterized by increased amount of connective tissue around vessels, is a hallmark for vascular disease. Ang II (angiotensin II) contributes to vascular disease and end-organ damage via promoting T-cell activation. Despite recent data suggesting the role of T cells in the progression of perivascular fibrosis, the underlying mechanisms are poorly understood.

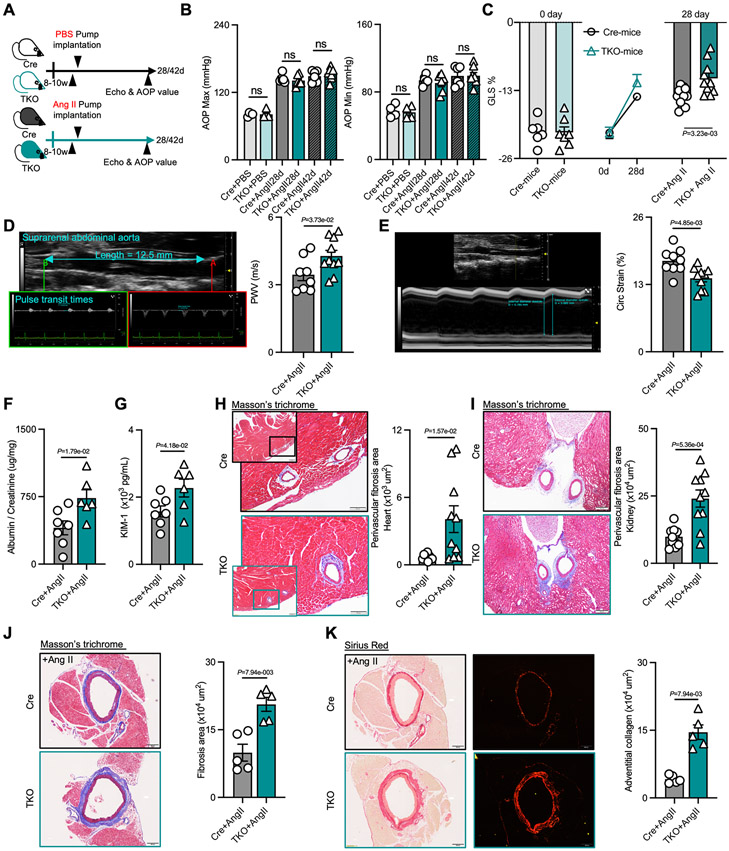
Methods: TF (transcription factor) profiling was performed in peripheral blood mononuclear cells of hypertensive patients. CD4-targeted KLF10 (Kruppel like factor 10)-deficient (Klf10fl/flCD4Cre+; [TKO]) and CD4-Cre (Klf10+/+CD4Cre+; [Cre]) control mice were subjected to Ang II infusion. End point characterization included cardiac echocardiography, aortic imaging, multiorgan histology, flow cytometry, cytokine analysis, aorta and fibroblast transcriptomic analysis, and aortic single-cell RNA-sequencing.

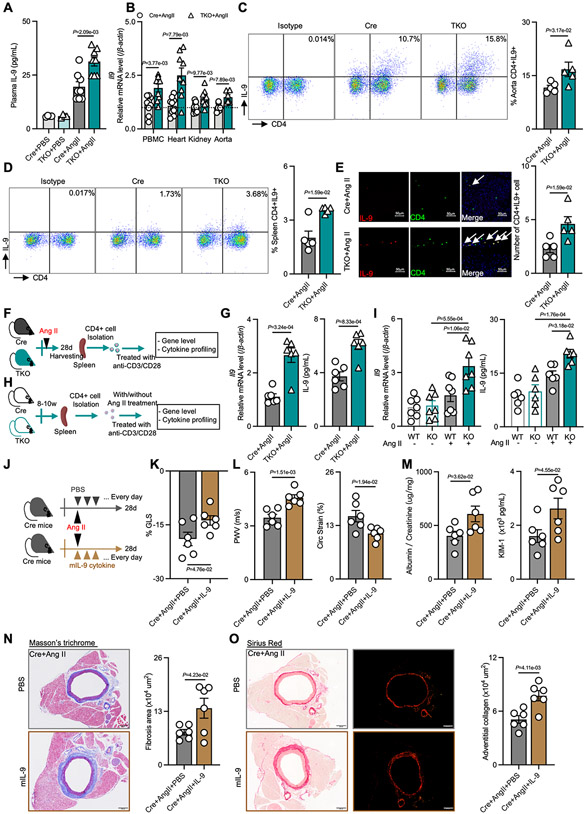
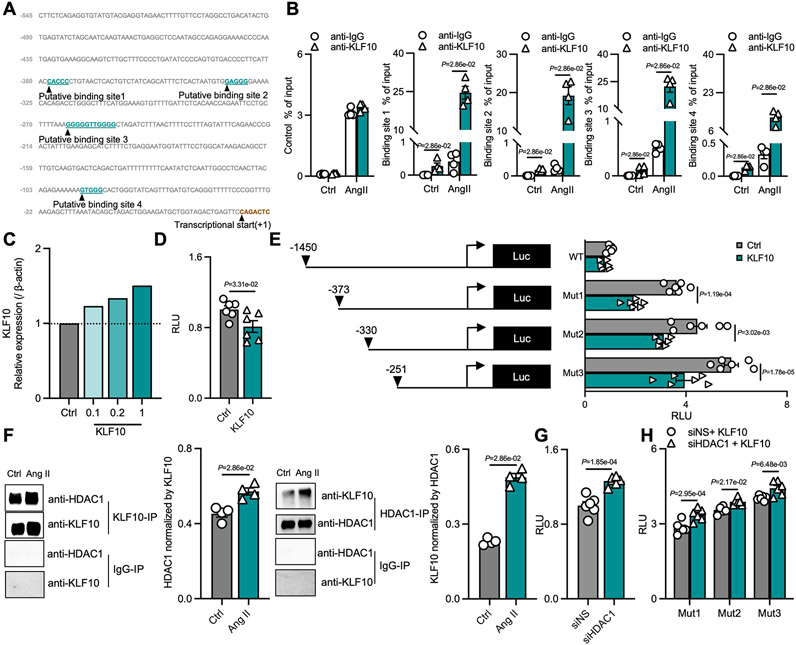
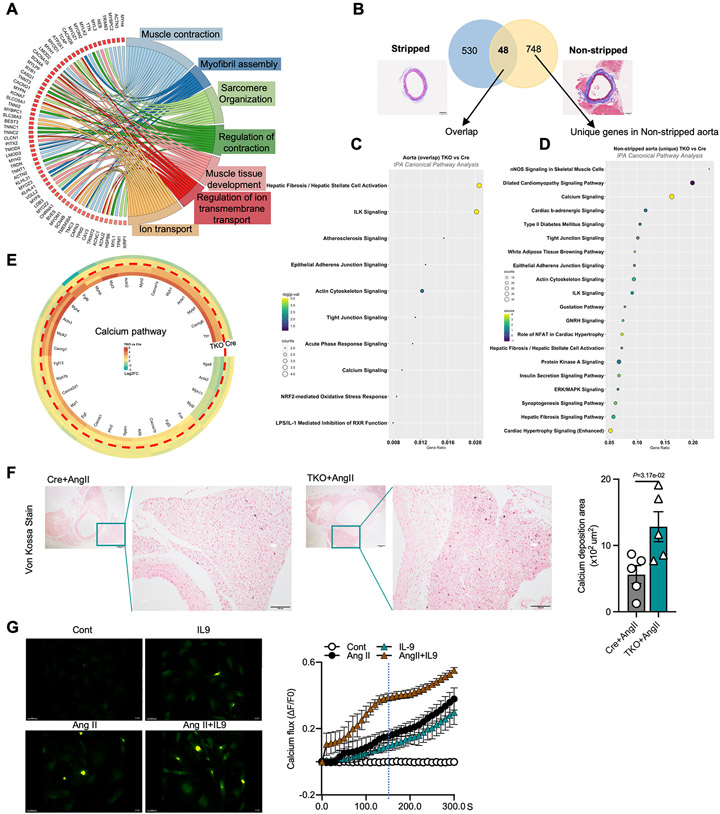
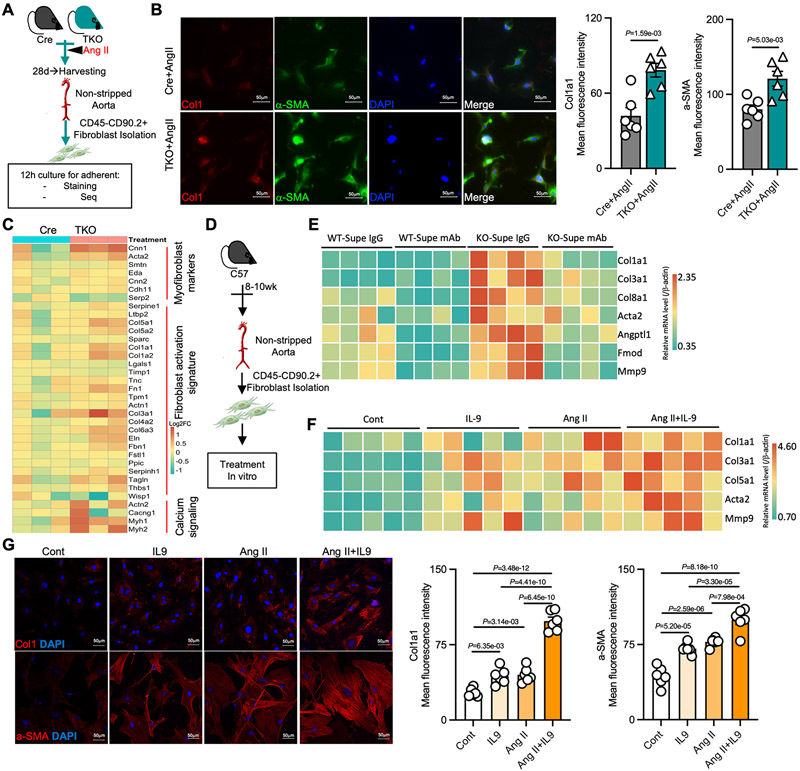
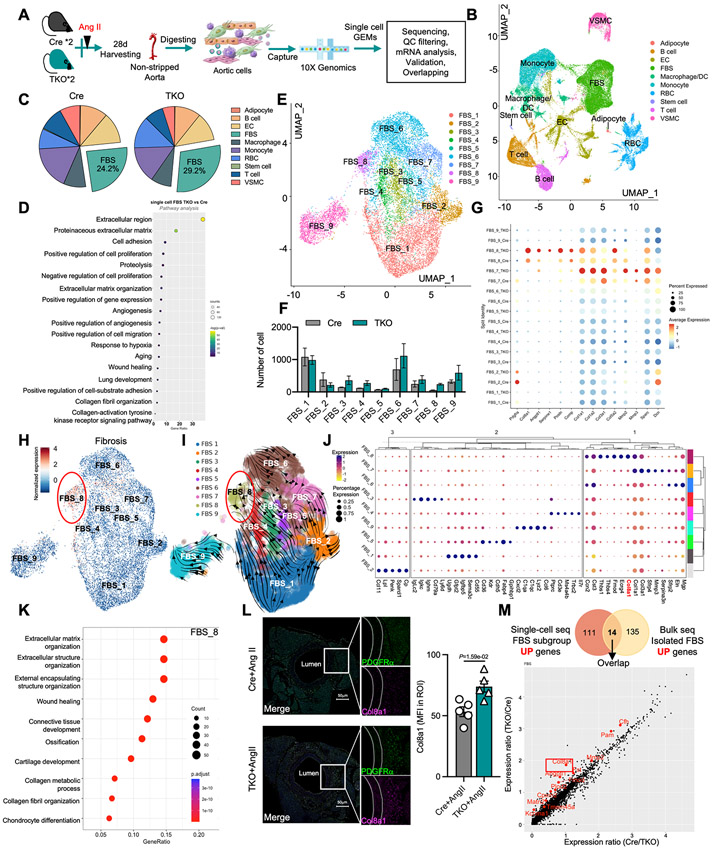
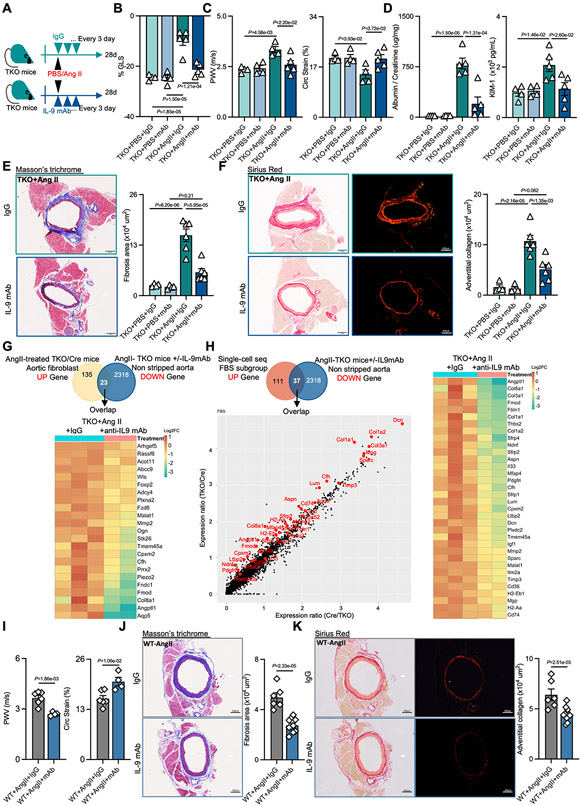
Results: TF profiling identified increased KLF10 expression in hypertensive human subjects and in CD4+ T cells in Ang II-treated mice. TKO mice showed enhanced perivascular fibrosis, but not interstitial fibrosis, in aorta, heart, and kidney in response to Ang II, accompanied by alterations in global longitudinal strain, arterial stiffness, and kidney function compared with Cre control mice. However, blood pressure was unchanged between the 2 groups. Mechanistically, KLF10 bound to the IL (interleukin)-9 promoter and interacted with HDAC1 (histone deacetylase 1) inhibit IL-9 transcription. Increased IL-9 in TKO mice induced fibroblast intracellular calcium mobilization, fibroblast activation, and differentiation and increased production of collagen and extracellular matrix, thereby promoting the progression of perivascular fibrosis and impairing target organ function. Remarkably, injection of anti-IL9 antibodies reversed perivascular fibrosis in Ang II-infused TKO mice and C57BL/6 mice. Single-cell RNA-sequencing revealed fibroblast heterogeneity with activated signatures associated with robust ECM (extracellular matrix) and perivascular fibrosis in Ang II-treated TKO mice.

Conclusions: CD4+ T cell deficiency of Klf10 exacerbated perivascular fibrosis and multi-organ dysfunction in response to Ang II via upregulation of IL-9. Klf10 or IL-9 in T cells might represent novel therapeutic targets for treatment of vascular or fibrotic diseases.

Keywords: Kruppel like factor 10 (KLF10); T cell; angiotensin II (Ang II); interleukins (IL)-9; perivascular fibrosis.


Figures

Figure 1.
Figure 1.. KLF10 expression is increased in T cells after Ang II treatment
A, Volcano plot highlighting regulated transcription factors in peripheral blood mononuclear cells (PBMCs) comparing hypertensive patients with normal left ventricular (LV) size and healthy controls (left), and hypertensive patients with LV remodeling and healthy controls (right). B, Venn diagram indicating the number of transcription factors regulated from two comparisons (left), and the normalized reads of KLF10 in PBMCs from the healthy control group (n=8), hypertensive patients with or without LV remodeling (n=14 in each group). C, Normalized reads of KLF10 in PBMCs from controlled (n=11) and uncontrolled hypertensives (n=9). D, Volcano plot highlighting regulated transcription factors in splenic CD3+ T cells (left), and the normalized reads of Klf10 in splenic CD3+ T cells in sham and Ang II-treated mice. E, Schematic diagram of CD3−, CD3+ and CD4+ cell isolation from PBS or Ang II treated C57BL/6 mice, and the mRNA expression of Klf10 in different cells (n=5). F, Representative Immunofluorescence staining, and the number of CD4+KLF10+ T cells in the adventitial regions in PBS or Ang II treated groups (n=5, scale bars =50μm). G, the expression of Klf10 in Ang II treated CD4+ T cells. P values correspond to one-way ANOVA with Tukey's multiple comparisons tests (B, G), or unpaired two-tailed t tests (C). D, differentially expressed transcription factors were calculated by DEseq2 package. E and F, P values correspond to unpaired two-tailed Mann-Whitney U-tests. LV indicates left ventricle; Con, control; Nor, normal LV size; Re, remodeling; WT, wild type; Ang II, Angiotensin II.
Figure 2.
Figure 2.. KLF10 deficiency in CD4+ T cells impairs the function of hypertension-related organs and triggers perivascular fibrosis independent of blood pressure.
A, Schematic diagram of experimental set-up of mice groups treated with PBS or Ang II infusion. B, Aortic blood pressure in Cre and TKO mice with PBS (n=4) or Ang II (n=6) treatment for 28 days or 42 days. C, Global longitudinal strain (GLS) in Cre and TKO mice before and after Ang II treatment (n=6 in Cre mice, n=7 in TKO mice, and n=10 in Ang II groups). D-E, Representative ultrasound imaging of the suprarenal abdominal aorta, and measurements of pulse wave velocity (PWV, D) and circumferential strain in Cre (n=8) and TKO mice (n=10) after 28 days of Ang II treatment. F-G, The ratio of albumin and creatinine (F), and the level of kidney injury molecule (KIM)-1 (G) in urine from Cre (n=7) and TKO mice (n=6) after Ang II treatment. H-I, Representative images of Masson trichrome staining, and quantification of perivascular fibrosis in the heart (H, scale bars =100μm) and kidney (I, scale bars= 200μm) (n=10). J-K, Representative images of Masson trichrome staining, and Sirius red staining and quantification of perivascular fibrosis and adventitial collagen in the aorta (n=5, scale bars= 200μm). B-I, P values correspond to unpaired two-tailed t tests. J and K, P values correspond to unpaired two-tailed Mann-Whitney U-tests. Ang II indicates angiotensin II; Echo, echocardiogram; AOP, aortic pressure; ns, not significant; GLS, global longitudinal strain; PWV, pulse wave velocity; Circ Strain, circumferential strain; KIM-1, kidney injury molecule-1.
Figure 3.
Figure 3.. KLF10 deficient CD4+ T cells release IL-9 that mediates perivascular fibrosis
A, IL-9 levels were measured in plasma in PBS or Ang II treated Cre and TKO mice (n=4 in PBS groups, and n=8 in Ang II-treated groups). B, mRNA expression level of Il9 in the PBMCs, heart, kidney, and aorta in Ang II-treated Cre and TKO mice (n=6 in aortic groups, and n=8 in others). C-D, Representative flow cytometry plots and the percentage of CD4+IL9+ T cells gated in CD3+ T cells in the aorta (C, n=5) and spleen (D, n=5). E, Representative immunofluorescence staining, and the number of CD4+IL9+ T cells in the aorta in Ang II treated Cre and TKO mice (n=5, scale bars= 50μm). F-G, Schematic diagram of the experimental setup for CD4+T cell isolation from Ang II-treated Cre or TKO mice (F), and quantification of Il9 mRNA in isolated CD4+ T cells, and IL-9 protein released into the supernatants of CD4+ T cells (G, n=6). H-I, Schematic diagram of the experimental setup of CD4+ T cell isolation from Cre control mice for in vitro treatment (H), quantification of Il9 mRNA in the treated CD4+ T cells, and IL-9 protein released into the supernatants of treated CD4+ T cells (I). J, Schematic diagram of the experimental setup for recombinant mIL-9 treatment in Cre mice. K, GLS in mIL-9 or PBS treated Cre mice after Ang II infusion (n=6). L, the value of PWV and circumferential strain in mIL-9 or PBS treated Cre mice after 28 days Ang II treatment (n=6). M, the ratio of albumin and creatinine, and the level of KIM-1 in urine in mIL-9 or IgG treated Cre mice after 28 days Ang II treatment (n=6). N-O, Representative images of Masson trichrome staining and Sirius red staining, and the area of perivascular fibrosis and adventitial collagen in the aorta (n=6, scale bars= 200μm). P values correspond to two-way ANOVA with Tukey's multiple comparisons tests (A, and I), or unpaired two-tailed t tests (B, G, and K-O). C-E, P values correspond to unpaired two-tailed Mann-Whitney U-tests. PBMC indicates peripheral blood mononuclear cells; Ang II, angiotensin II; GLS, global longitudinal strain; PWV, pulse wave velocity; Circ Strain, circumferential strain; KIM-1, kidney injury molecule-1.
Figure 4.
Figure 4.. KLF10 binds to the IL-9 promoter and interacts with HDAC to inhibit IL-9 activation
A, Putative KLF10 transcription factor-binding sites in the mouse IL-9 promoter region. The putative binding sequences are highlighted. The transcription initiation site is defined as +1. B, Primary CD4+ T cells were isolated from Cre control mice and subjected to the chromatin immunoprecipitation (ChIP) assay with antibodies against IgG or KLF10. The immunoprecipitated DNA was subjected to semiquantitative PCR and q-PCR. C, The protein level of KLF10 after transfection. D-E, HEK293T cells were transfected with a full-length mouse IL-9 promoter luciferase reporter or 5’ truncations of the IL-9 promoter, together with expression plasmids encoding full-length mouse KLF10 or empty vector (mock control). F, Primary CD4+ T cells were treated with Ang II for 12h, then cells were harvested, lysed, and subjected to immunoprecipitation by the indicated antibodies. Immunoprecipitation (IP) were subjected to Western blotting with the indicated antibodies, and the quantification of IP. G-H, HEK293T were co-transfected with mouse KLF10 expression vector and the indicated mouse IL-9 promoter luciferase reporters (WT, Mut1, Mut2, or Mut3), and siRNA (non-specific or HDAC1), and the relative luminescence units (RLU) after transfection. B, and F, P values correspond to unpaired two-tailed Mann-Whitney U-tests. For normal distributed data, P values correspond to unpaired two-tailed t tests (D, and G), or two-way ANOVA with Tukey's multiple comparisons tests (E, and H). Ctrl indicates control; Ang II, angiotensin II; Luc, luciferase reporters; RLU, relative luminescence units.
Figure 5.
Figure 5.. Transcriptomic changes involved in Ang II-induced perivascular fibrosis
A, GOChord plot showing the significantly regulated genes (log2 fold change >1.5; FDR <0.05) involved in the top 7 enriched pathways in non-stripped aorta. B, Differentially expressed genes in stripped and non-stripped aortas in Ang II treated Cre and TKO mice (FDR, <0.05). C, IPA Canonical pathway analysis after overlapping differentially expressed genes in stripped and non-stripped aortas. D, IPA Canonical pathway analysis by using unique differentially expressed genes in non-stripped aorta. E, Differentially expressed calcium pathway related genes. F, Representative images of Von Kossa staining, and the area of calcium deposition in the aorta (n=5, scale bars= 100μm). G, Real-time changes in intracellular calcium flux following IL-9, Ang II or Ang II and IL-9 treatment (Scale bars= 50 μm). F, P values correspond to unpaired two-tailed Mann-Whitney U-tests. Ang II indicates angiotensin II, Cont, Control.
Figure 6.
Figure 6.. TKO fibroblasts display an activation signature and IL-9 and Ang II treatment recapitulate the phenotype in control fibroblasts
A, Schematic diagram of fibroblast isolation from Ang II-treated Cre or TKO mice. B, Representative immunofluorescence images, and the mean fluorescence intensity of Col1a1 and α-SMA in the isolated fibroblasts from Ang II-treated Cre or TKO mice (n=6, scale bars= 50 μm). C, Heatmap of dysregulated genes related to myofibroblast markers, fibroblast activation signature, and calcium signaling in isolated fibroblasts. D, Schematic diagram of primary aortic fibroblast isolation from C57BL/6 mice for further in vitro experiment. E, Gene expression of fibrotic markers in primary aortic fibroblasts grown in supernatants from KO or Cre CD4+T cells treated with Ang II in the presence of IgG or anti-IL-9 mAbs. F, Gene expression of fibrotic markers in primary aortic fibroblasts after treatment with IL-9, Ang II, or Ang II and IL-9 treatment. G, Representative immunofluorescence images, and the mean fluorescence intensity of Col1a1 and α-SMA in primary aortic fibroblasts after IL-9, Ang II, or Ang II and IL-9 treatment (n=6, scale bars= 50μm). P values correspond to an unpaired two-tailed t test (B), one-way ANOVA with Tukey's multiple comparisons tests (G). Ang II indicates angiotensin II.
Figure 7.
Figure 7.. Single-cell RNA sequencing revealed fibroblast heterogeneity and activation signatures induced in TKO aortas.
A, Schematic diagram of aortic cells isolated from Ang II-treated Cre or TKO mice for single-cell RNA sequencing. B, Uniform Manifold Approximation and Projection (UMAP) of different aortic cell types. C, the percentage of different aortic cell types. D, IPA pathway analysis using total differentially expressed genes in fibroblasts. E, UMAP of 9 main fibroblast cell clusters. F, the number of different fibroblast clusters in Ang II treated Cre and TKO mice. G, dot plot of fibroblast activation signature-related genes. H, the UMAP of fibrosis genes by using add module score analysis. I, Velocity vector field displayed over the FBS UMAP. J, K-means cluster analysis for each fibroblast subclusters. K, Pathway analysis using the specific genes enriched in FBS_8. L, Representative immunofluorescence images of PDGFRα and Col8a1 in aorta (n=5, scale bars= 50μm). M, Overlapping upregulated genes from the indicated single-cell RNA seq dataset and isolated fibroblast bulk-RNA seq datasets (top); the overlapping increased genes from single-cell RNA seq (bottom). L, P values correspond to an unpaired two-tailed Mann-Whitney U-test. DC indicates dendritic cells; FBS, fibroblasts; EC, endothelial cells; RBC, red blood cells; VSMC, vascular smooth muscle cells; Ang II, angiotensin II.
Figure 8.
Figure 8.. Neutralization of endogenous IL-9 reversed the Ang II-induced perivascular fibrosis and ameliorated injury of hypertension-related organs
A, Schematic diagram of the experimental setup for treatment with anti-IL-9 antibodies (mAb) in PBS or Ang II treated-TKO mice. B-C, Quantification of GLS (B), PWV and Circ Strain (C) in anti-IL-9 antibodies (mAb) or IgG treated TKO mice after 28 days PBS (n=4) or Ang II (n=5) infusion. D, The ratio of albumin and creatinine, and the level of KIM-1 in urine (n=4 in PBS groups, and n=5 in Ang II groups). E-F, Representative images of Masson trichrome staining and Sirius red staining, and quantification of perivascular fibrosis and adventitial collagen in the aorta (n=4 in PBS groups, n=6 in Ang II groups, scale bars= 200μm). G, Venn diagram of overlapping dysregulated genes from the upregulated genes from the isolated fibroblast bulk-RNA seq dataset and the downregulated genes in the anti-IL-9 mAb or IgG treated TKO mice bulk-RNA seq datasets (top), and the heatmap of downregulated genes in IL-9 mAb and IgG treated TKO mice non-stripped aortas after overlapping (bottom). H, Venn diagram of overlapping dysregulated genes from upregulated genes in the single cell-RNA seq dataset and the downregulated genes in the anti-IL-9 mAb or IgG treated TKO mice bulk-RNA seq datasets (top), the increased overlapping genes from single-cell seq (bottom), and the heatmap of downregulated overlapping genes in anti-IL-9 mAb and IgG treated of non-stripped aortas from TKO mice (right). I, quantification of PWV and Circ Strain in anti-IL-9 mAb (n=4) or IgG (n=5) treated WT mice after 28 days of Ang II treatment. J-K, Representative images of Masson trichrome staining and Sirius red staining, and quantification of perivascular fibrosis and adventitial collagen in the aorta in anti-IL-9 mAb (n=10) or IgG (n=6) treated WT mice after 28 days of Ang II treatment (scale bars= 200μm)., P values correspond to two-way ANOVA with Tukey's multiple comparisons tests (B-F), or unpaired two-tailed t tests (I-K). Ang II indicates angiotensin II; PWV, pulse wave velocity; Circ Strain, circumferential strain; KIM-1, kidney injury molecule-1.

Similar articles

Cited by

References

    1. Mitchell GF. Arterial stiffness and hypertension: Chicken or egg? Hypertension. 2014;64:210–214 - PMC - PubMed
    1. McMaster WG, Kirabo A, Madhur MS, Harrison DG. Inflammation, immunity, and hypertensive end-organ damage. Circ Res. 2015;116:1022–1033 - PMC - PubMed
    1. Wu J, Saleh MA, Kirabo A, Itani HA, Montaniel KR, Xiao L, Chen W, Mernaugh RL, Cai H, Bernstein KE, Goronzy JJ, Weyand CM, Curci JA, Barbaro NR, Moreno H, Davies SS, Roberts LJ, Madhur MS, Harrison DG. Immune activation caused by vascular oxidation promotes fibrosis and hypertension. J Clin Invest. 2016;126:1607 - PMC - PubMed
    1. Mills KT, Stefanescu A, He J. The global epidemiology of hypertension. Nat Rev Nephrol. 2020;16:223–237 - PMC - PubMed
    1. Lewington S, Clarke R, Qizilbash N, Peto R, Collins R. Age-specific relevance of usual blood pressure to vascular mortality: A meta-analysis of individual data for one million adults in 61 prospective studies. Lancet. 2002;360:1903–1913 - PubMed

Publication types