. 2022 Jun 29;7(3):e0100621.
doi: 10.1128/msphere.01006-21. Epub 2022 Apr 20.

Distinct Survival, Growth Lag, and rRNA Degradation Kinetics during Long-Term Starvation for Carbon or Phosphate

Affiliations

Distinct Survival, Growth Lag, and rRNA Degradation Kinetics during Long-Term Starvation for Carbon or Phosphate

Yusuke Himeoka et al. mSphere. .

Abstract

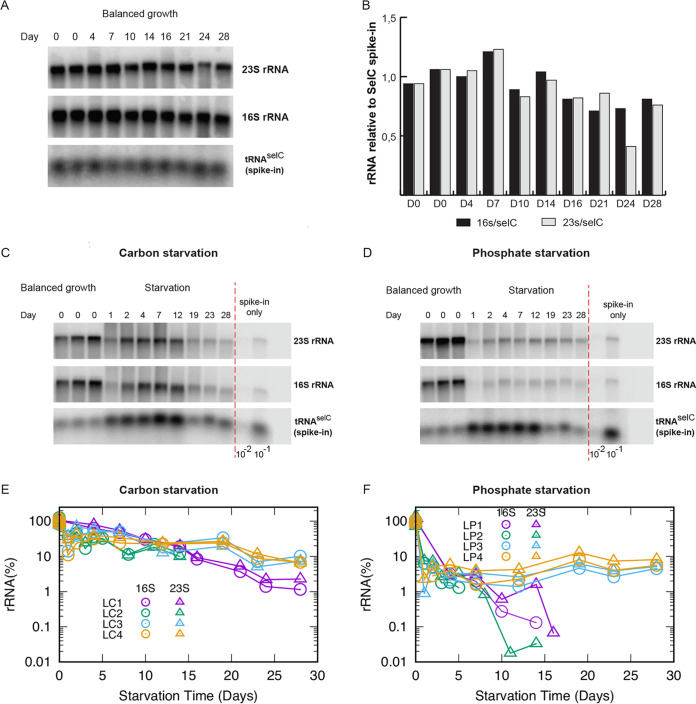
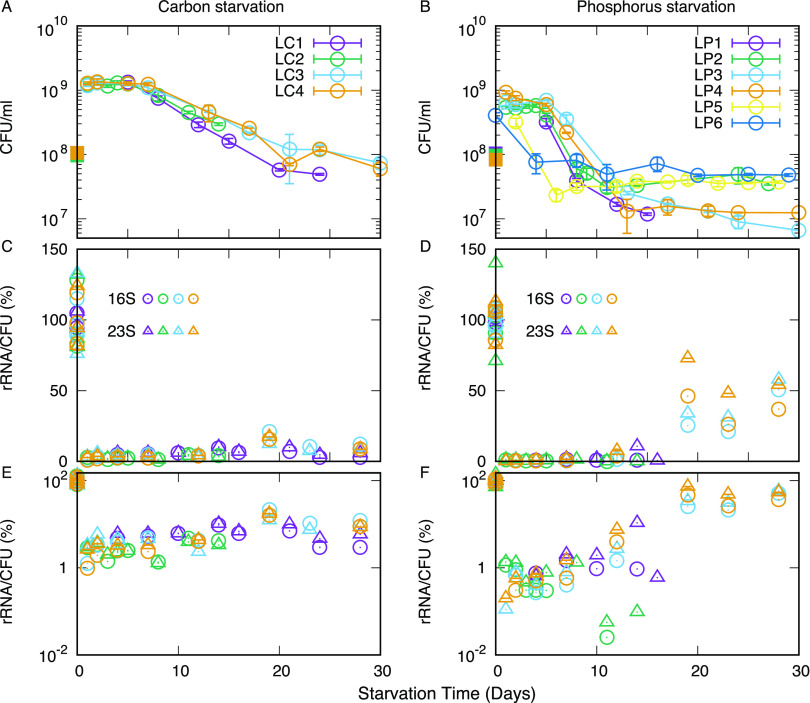
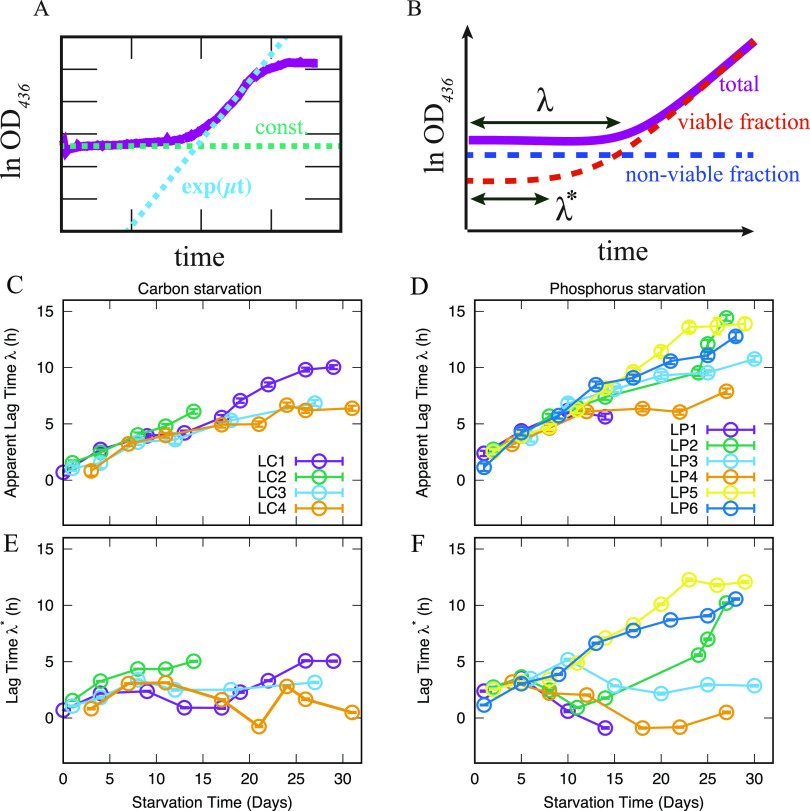
The stationary phase is the general term for the state a bacterial culture reaches when no further increase in cell mass occurs due to exhaustion of nutrients in the growth medium. Depending on the type of nutrient that is first depleted, the metabolic state of the stationary phase cells may vary greatly, and the subsistence strategies that best support cell survival may differ. As ribosomes play a central role in bacterial growth and energy expenditure, ribosome preservation is a key element of such strategies. To investigate the degree of ribosome preservation during long-term starvation, we compared the dynamics of rRNA levels of carbon-starved and phosphorus-starved Escherichia coli cultures for up to 28 days. The starved cultures' contents of full-length 16S and 23S rRNA decreased as the starvation proceeded in both cases, and phosphorus starvation resulted in much more rapid rRNA degradation than carbon starvation. Bacterial survival and regrowth kinetics were also quantified. Upon replenishment of the nutrient in question, carbon-starved cells resumed growth faster than cells starved for phosphate for the equivalent amount of time, and for both conditions, the lag time increased with the starvation time. While these results are in accordance with the hypothesis that cells with a larger ribosome pool recover more readily upon replenishment of nutrients, we also observed that the lag time kept increasing with increasing starvation time, also when the amount of rRNA per viable cell remained constant, highlighting that lag time is not a simple function of ribosome content under long-term starvation conditions. IMPORTANCE The exponential growth of bacterial populations is punctuated by long or short periods of starvation lasting from the point of nutrient exhaustion until nutrients are replenished. To understand the consequences of long-term starvation for Escherichia coli cells, we performed month-long carbon and phosphorus starvation experiments and measured three key phenotypes of the cultures, namely, the survival of the cells, the time needed for them to resume growth after nutrient replenishment, and the levels of intact rRNA preserved in the cultures. The starved cultures' concentration of rRNA dropped with starvation time, as did cell survival, while the lag time needed for regrowth increased. While all three phenotypes were more severely affected during starvation for phosphorus than for carbon, our results demonstrate that neither survival nor lag time is correlated with ribosome content in a straightforward manner.

Keywords: Escherichia coli; bacterial stress response; lag time; nutrient starvation; ribosomal RNA; stable RNA degradation; stationary phase.


Conflict of interest statement

The authors declare no conflict of interest.

Figures

FIG 1
FIG 1
Quantification of rRNA in cultures undergoing long-term starvation. (A) Northern blot of total RNA from samples harvested during balanced growth. Day 0 indicates the start of the experiment, and days 4, 7, 10, 14, 16, 21, 24, and 28 indicate the number of days the spike-in cells were stored prior to mixing with a fresh aliquot of cells in balanced growth. The resulting blot was probed for 23S, 16S, and the spike-in-cell-specific tRNAselC as indicated. (B) The levels of rRNA (16S, black bars; 23S, gray bars) were quantified by normalizing to tRNASelC from the spike-in cells and shown relative to the average of the two RNA samples harvested on day 0. (C) Northern blot of total RNA from cultures starved for carbon (days 1, 2, 4, 7, 12, 19, 23, and 28 indicate the number of starvation days, while day 0 indicates samples harvested in triplicate while the culture was still growing exponentially, before the carbon source was depleted). (D) Northern blot of total RNA from cultures starved for phosphate (days 1, 2, 4, 7, 12, 19, 23, and 28 indicate the number of starvation days, while day 0 indicates samples harvested in triplicate while the culture was still growing exponentially, before the phosphate source was depleted). For both Northern blots in panels C and D, the right panel shows 1/100 and 1/10 dilutions of samples harvested from the spike-in cells. The blots were probed for 23S rRNA, 16S rRNA, and tRNASelC as indicated. (E) The plots show 16S and 23S rRNA levels relative to balanced growth during carbon starvation; (F) the quantification of 16S and 23S rRNA during phosphate starvation. Independent biological replicates are labeled as LC1 to LC4 for carbon starvation and as LP1 to LP4 for phosphate starvation. In the later time samples for phosphorus starvation, the rRNA level in the culture sometimes became too low to distinguish from the contribution from spike-in cells. Those data points are not shown (see Materials and Methods).
FIG 2
FIG 2
Survival kinetics of E. coli during long-term starvation and the population-averaged rRNA content. (A and B) Time course of CFU/mL for (A) the carbon starvation case and (B) the phosphorus starvation case. Independent measurements are labeled as LC1 to LC4 for carbon starvation and as LP1 to LP6 for phosphate starvation (amounts of rRNAs were not quantified for LC5 and LC6). Square symbols on day 0 show the estimated CFU/mL at the time of RNA harvest from exponentially growing cultures, calculated based on OD436. (C and D) The relative levels of 16S and 23S rRNA per surviving (colony-forming) bacterium. (E and F) rRNAs per colony-forming cell are plotted on a semi-log scale. The error bars in panels A and B indicate the unbiased standard error.
FIG 3
FIG 3
Lag time measurements after carbon or phosphorus starvation. (A) An example of the time series of resuscitation and fitting parameters. The growth curve of the bacterial culture is shown in magenta. The lag phase is fitted by a constant function f (dashed green line), and the exponential phase is fitted by an exponential function g (dashed blue line). The value of f, the slope of g, and the intersection point of f and g correspond to the initial OD436 value (N0), the specific growth rate (μ), and the lag time (λ), respectively. (B). An illustration of how the effect of nonviable cells is subtracted from the average lag time. We decomposed the total population into viable (red) and nonviable (blue) fractions based on the measured cell viability (CFU/mL) and recalculated the lag time for the viable fraction (λ*). (C and D) The average apparent lag time λ for (C) carbon starvation and (D) phosphorus starvation. (E and F) The lag time λ* after subtraction of the effect of nonviable cells for (E) carbon starvation and (F) phosphorus starvation. The error bars are the unbiased standard error of the mean (The number of samples taken to measure OD curves used to estimate the lag time for one biological replicate is typically more than 80 per time point. For the propagated errors, see Materials and Methods). For panel C to F, each biological replicate is shown separately.

Similar articles

Cited by

References

    1. Maaløe O. 1979. Regulation of the protein-synthesizing machinery: ribosomes, tRNA, factors, and so on, p 487–542. In Goldberger RF (ed), Biological regulation and development. Springer, Boston, MA.
    1. Scott M, Hwa T. 2011. Bacterial growth laws and their applications. Curr Opin Biotechnol 22:559–565. doi:10.1016/j.copbio.2011.04.014. - DOI - PMC - PubMed
    1. Schaechter M, Maaløe O, Kjeldgaard NO. 1958. Dependency on medium and temperature of cell size and chemical composition during balanced growth of Salmonella Typhimurium. J Gen Microbiol 19:592–606. doi:10.1099/00221287-19-3-592. - DOI - PubMed
    1. Scott M, Gunderson CW, Mateescu EM, Zhang Z, Hwa T. 2010. Interdependence of cell growth and gene expression: origins and consequences. Science 330:1099–1102. doi:10.1126/science.1192588. - DOI - PubMed
    1. Li SH-J, Li Z, Park JO, King CG, Rabinowitz JD, Wingreen NS, Gitai Z. 2018. Escherichia coli translation strategies differ across carbon, nitrogen and phosphorus limitation conditions. Nat Microbiol 3:939–947. no. doi:10.1038/s41564-018-0199-2. - DOI - PMC - PubMed

Publication types