. 2022 Apr 27;289(1973):20220162.
doi: 10.1098/rspb.2022.0162. Epub 2022 Apr 20.

Cross-ocean patterns and processes in fish biodiversity on coral reefs through the lens of eDNA metabarcoding

Affiliations

Cross-ocean patterns and processes in fish biodiversity on coral reefs through the lens of eDNA metabarcoding

Laetitia Mathon et al. Proc Biol Sci. .

Abstract

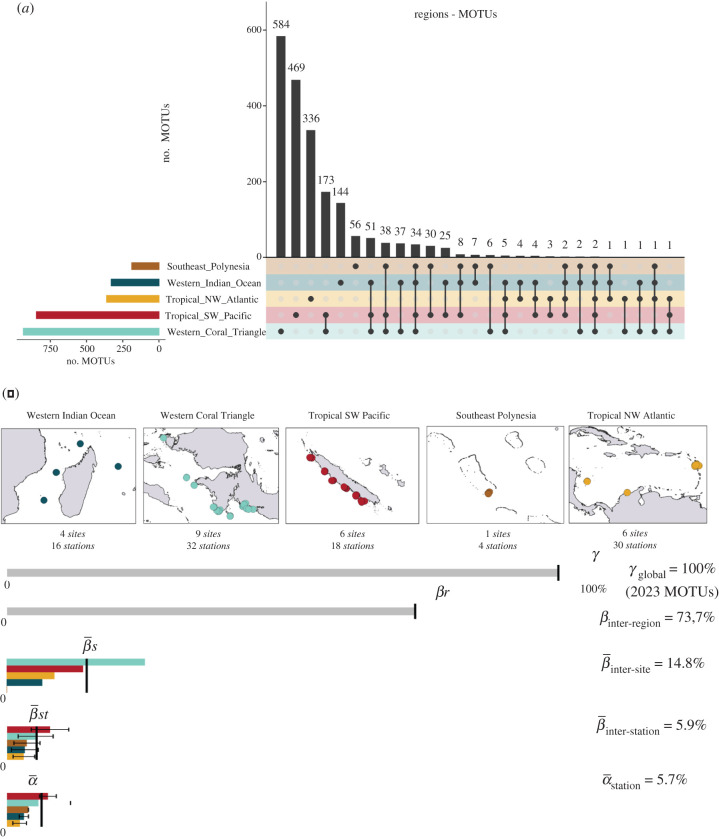
Increasing speed and magnitude of global change threaten the world's biodiversity and particularly coral reef fishes. A better understanding of large-scale patterns and processes on coral reefs is essential to prevent fish biodiversity decline but it requires new monitoring approaches. Here, we use environmental DNA metabarcoding to reconstruct well-known patterns of fish biodiversity on coral reefs and uncover hidden patterns on these highly diverse and threatened ecosystems. We analysed 226 environmental DNA (eDNA) seawater samples from 100 stations in five tropical regions (Caribbean, Central and Southwest Pacific, Coral Triangle and Western Indian Ocean) and compared those to 2047 underwater visual censuses from the Reef Life Survey in 1224 stations. Environmental DNA reveals a higher (16%) fish biodiversity, with 2650 taxa, and 25% more families than underwater visual surveys. By identifying more pelagic, reef-associated and crypto-benthic species, eDNA offers a fresh view on assembly rules across spatial scales. Nevertheless, the reef life survey identified more species than eDNA in 47 shared families, which can be due to incomplete sequence assignment, possibly combined with incomplete detection in the environment, for some species. Combining eDNA metabarcoding and extensive visual census offers novel insights on the spatial organization of the richest marine ecosystems.

Keywords: biogeographic patterns; coral reef fish; eDNA metabarcoding; visual census.


Conflict of interest statement

All authors declare that there is no conflict of interest regarding the publication of this article.

Figures

Figure 1.
Figure 1.
Estimates of overall fish richness from environmental DNA (eDNA) and visual census. (a) Accumulation curve of MOTUs from eDNA (eDNA MOTUs), (b) accumulation curve of species from the visual census database, (c) accumulation curve of eDNA families and (d) accumulation curve of visual census families. For (a–d), species accumulation model is fitted according to Lomolino method (see methods). (e) Linear regression (black line) between the number of species per family in visual census data and the number of MOTUs per family in eDNA (log(x + 1) transformation) over n = 77 families. Each point is a family. Red line is x = y. (f) percentage of MOTUs assigned to each family at global scale and proportion in each region. (no. = number of) (Online version in colour.)
Figure 2.
Figure 2.
Estimates of overall fish richness from eDNA and visual census across habitat categories. (a) Accumulation curve of crypto-benthic eDNA MOTUs (i) and visual census species (ii). (b) Accumulation curve of pelagic MOTUs (i) and visual census species (ii). (c) Accumulation curve of demersal MOTUs (i) and visual census species (ii). Accumulation model is fitted with a nonlinear Lomolino model (see Methods). (Online version in colour.)
Figure 3.
Figure 3.
Partial dbRDA of MOTU proportions of each family in each site. (a) dbRDA on eDNA dataset, with 133 families in 26 sites (R2 = 0.21, F = 3.11, p = 0.001). (b) Families with scores greater than 95% of scores distribution on each axis for eDNA. (c) dbRDA on a subset of visual census dataset to select only the sites in the same regions as in the eDNA dataset, with 76 families in 68 sites (R2 = 0.5, F = 15.8, p = 0.001). (d) Families with scores greater than 95% of scores distribution on each axis for visual census. Axis labels indicate the percentage of variance explained by the 2 first dbRDA dimensions (CAP1 and CAP2). (Online version in colour.)
Figure 4.
Figure 4.
Hierarchical partitioning of MOTU occurrences across spatial scales. (a) Number of MOTUs found in only one region, or shared between 2, 3, 4 or all 5 regions. Histograms indicate the number of MOTUs present in all the regions identified by the dots in the lower part. (b) Global fish diversity (γglobal) is partitioned into βinter-region + mean βinter-site + mean βinter-station + mean station. Mean values at global scales are indicated with the black vertical segments. For βinter-site, βinter-station and station, mean values are given for each region (coloured bars) with the standard errors. βinter-region contributes the highest to gamma global (73.7%). (Online version in colour.)

References

    1. Parravicini V, et al. 2013. Global patterns and predictors of tropical reef fish species richness. Ecography (Cop) 36, 1254-1262. (10.1111/j.1600-0587.2013.00291.x) - DOI
    1. Cowman PF, Bellwood DR. 2013. The historical biogeography of coral reef fishes: global patterns of origination and dispersal. J. Biogeogr. 40, 209-224. (10.1111/jbi.12003) - DOI
    1. Cinner JE, et al. 2020. Meeting fisheries, ecosystem function, and biodiversity goals in a human-dominated world. Science 368, 307-311. (10.1126/science.aax9412) - DOI - PubMed
    1. Hoegh-Guldberg O, et al. 2019. The human imperative of stabilizing global climate change at 1.5°C. Science 365, eaaw6974. (10.1126/science.aaz4390) - DOI - PubMed
    1. Victor BC. 2015. How many coral reef fish species are there? Cryptic diversity and the new molecular taxonomy. In Ecology of fishes on coral reefs, pp. 76-88. Cambridge, UK: Cambridge University Press.

Publication types

Substances

LinkOut - more resources