. 2022 Apr 19;13(1):2025.
doi: 10.1038/s41467-022-29714-6.

Distinct and additive effects of calorie restriction and rapamycin in aging skeletal muscle

Affiliations

Distinct and additive effects of calorie restriction and rapamycin in aging skeletal muscle

Daniel J Ham et al. Nat Commun. .

Erratum in

Abstract

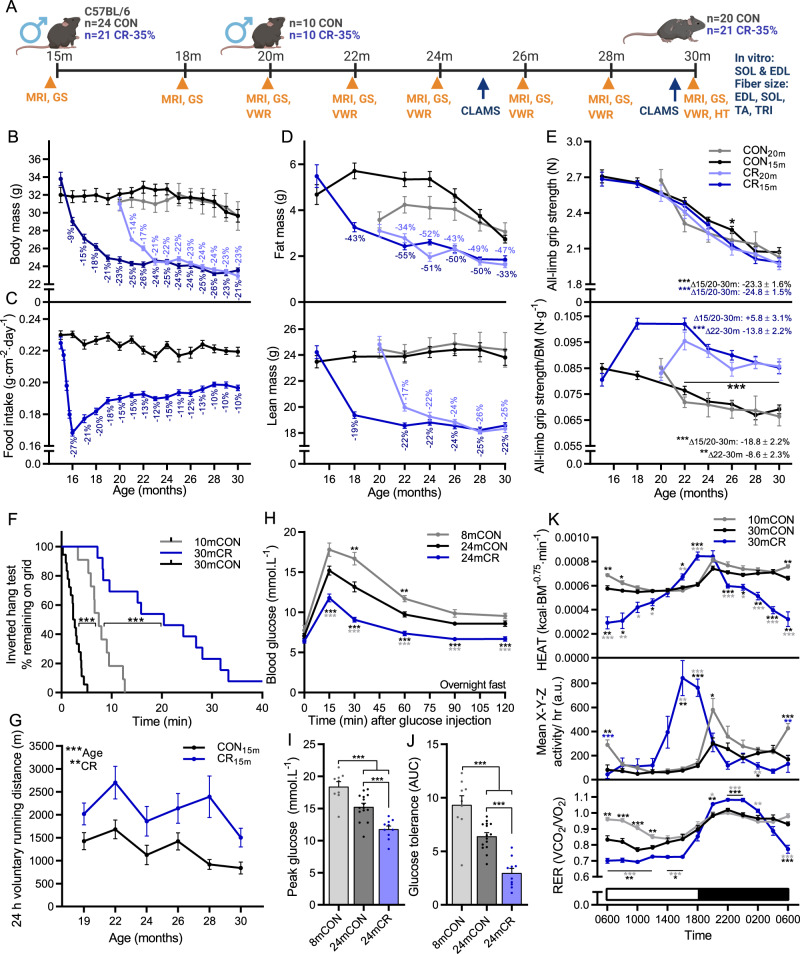
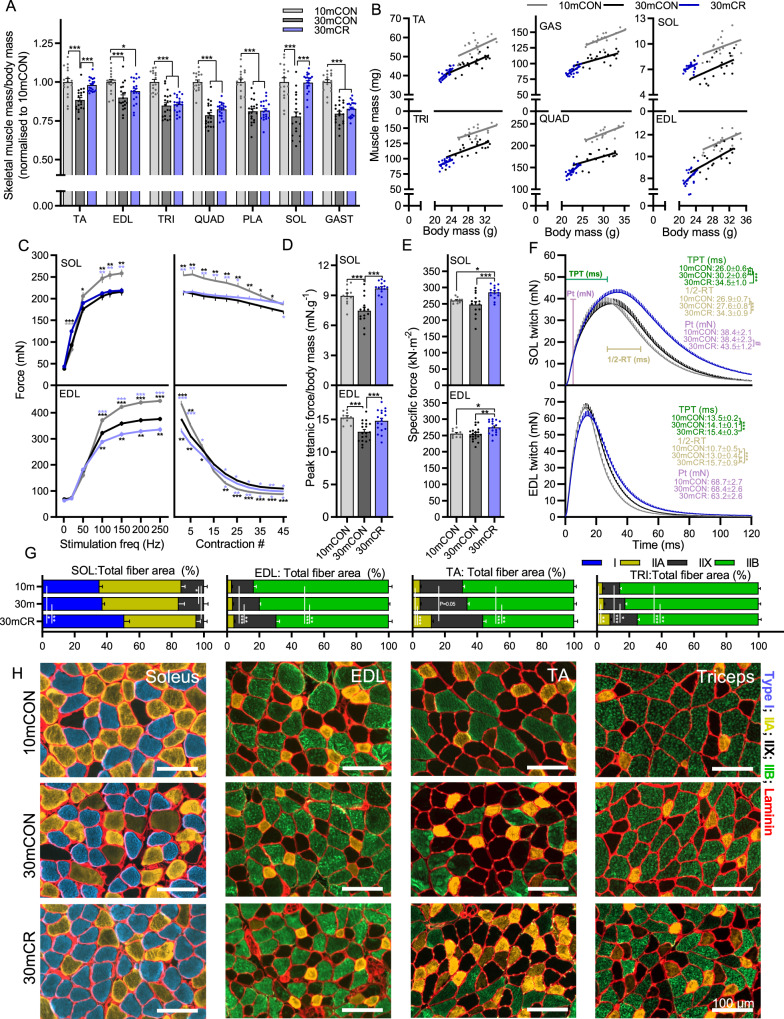
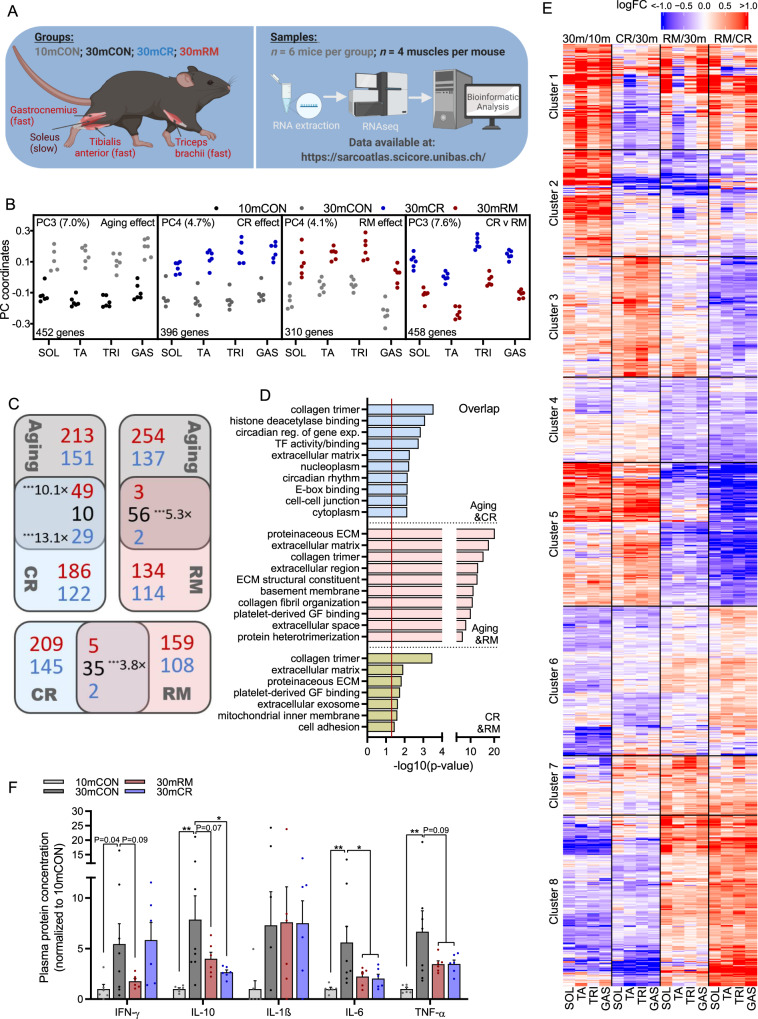
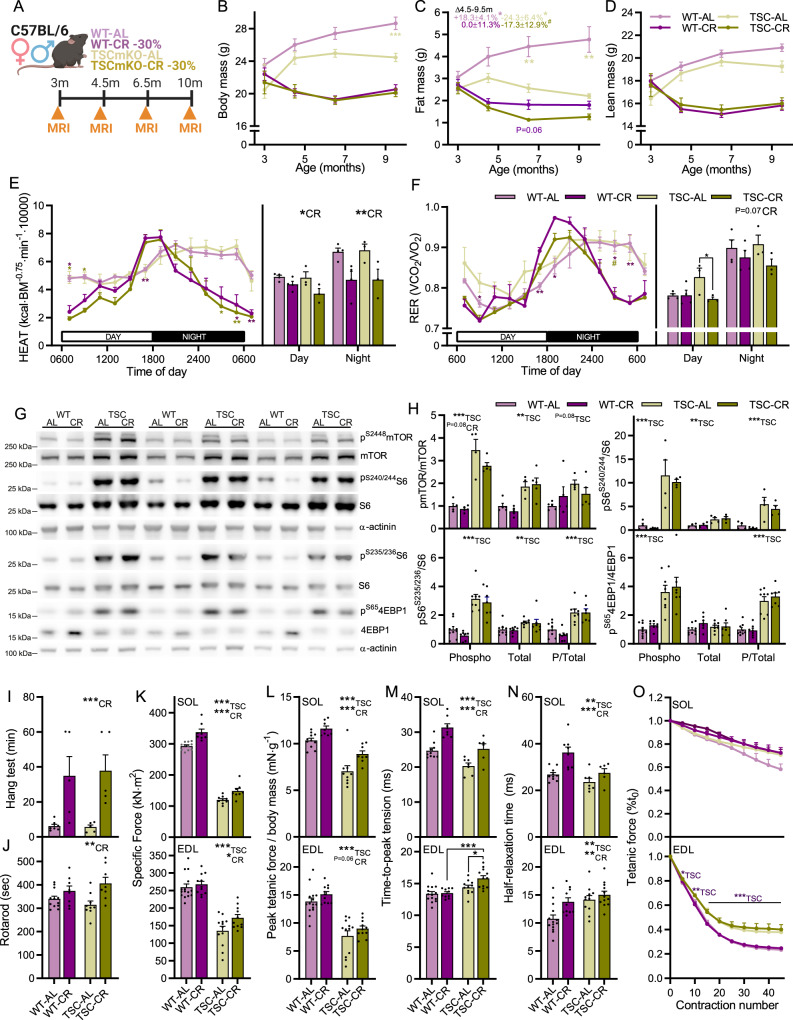
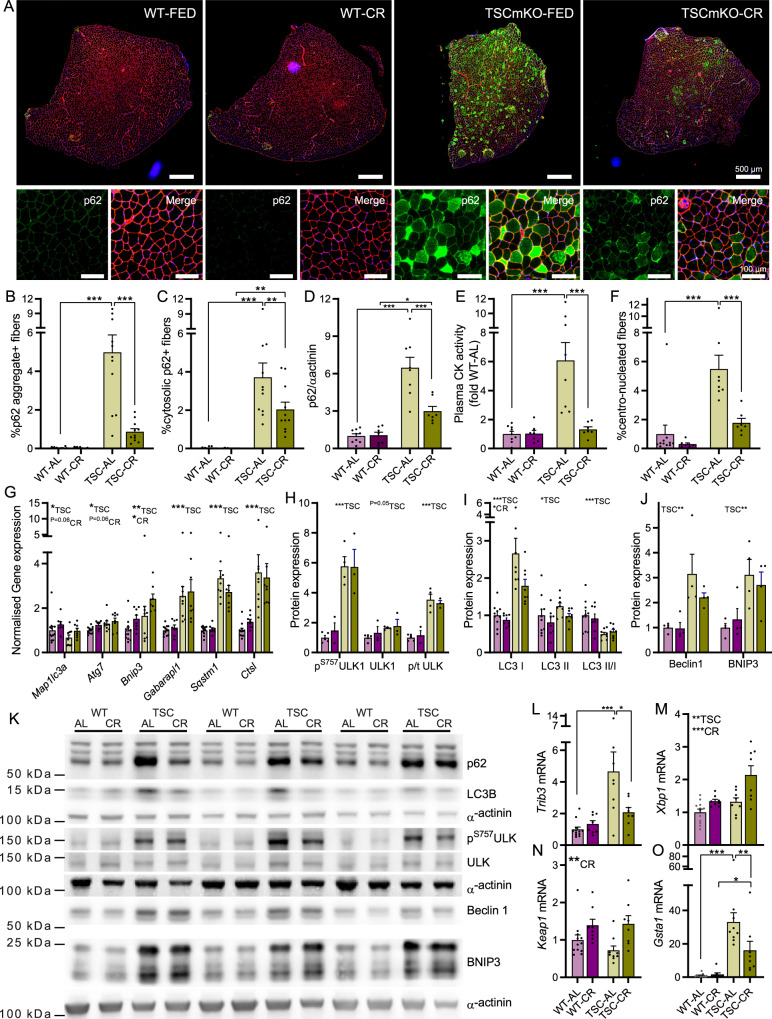
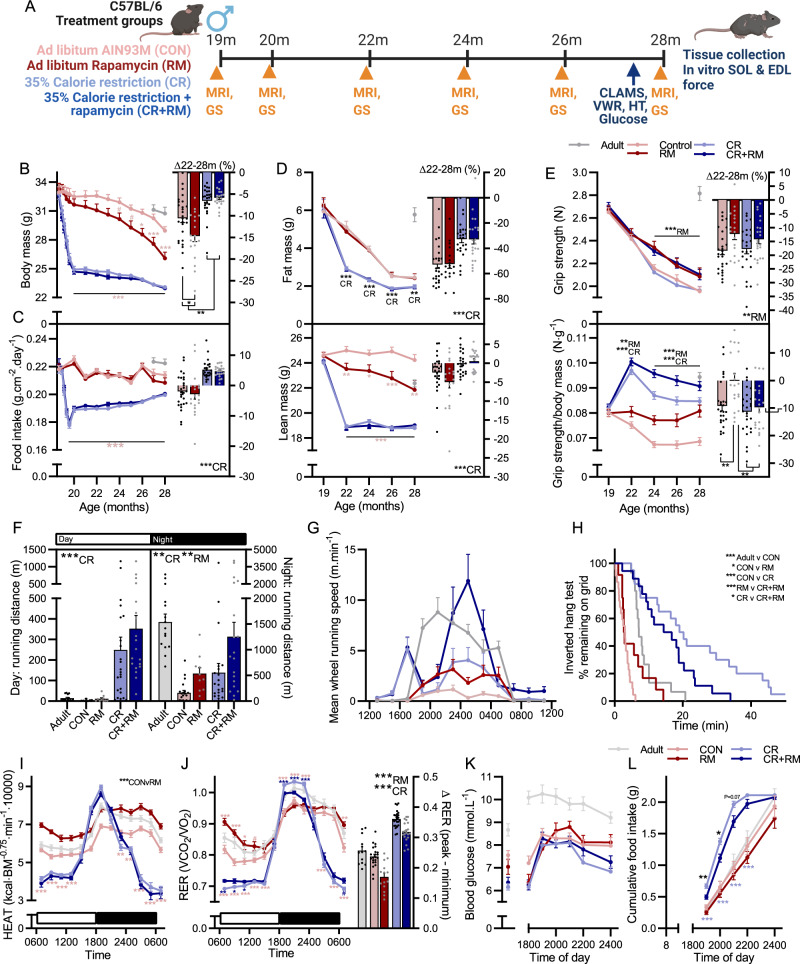
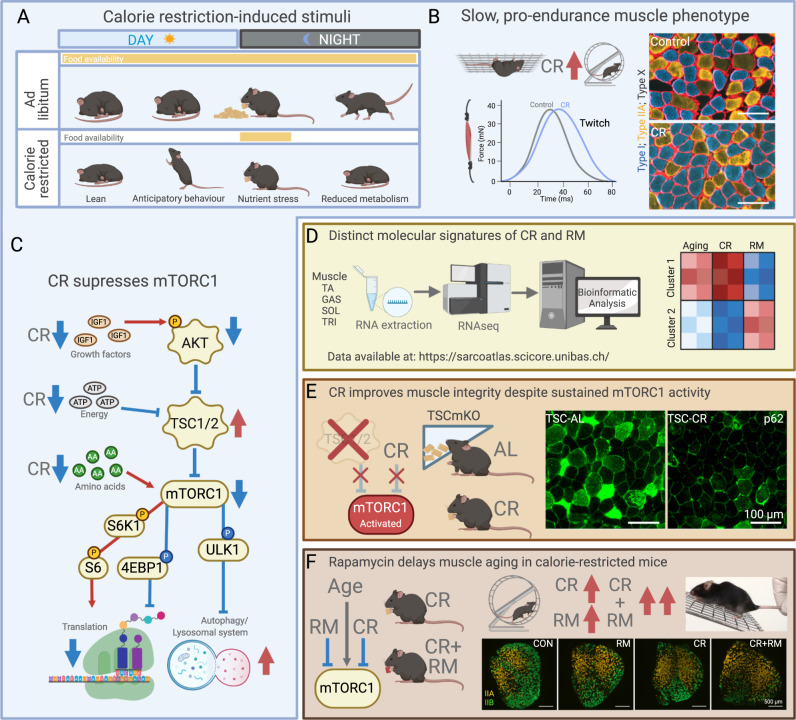
Preserving skeletal muscle function is essential to maintain life quality at high age. Calorie restriction (CR) potently extends health and lifespan, but is largely unachievable in humans, making "CR mimetics" of great interest. CR targets nutrient-sensing pathways centering on mTORC1. The mTORC1 inhibitor, rapamycin, is considered a potential CR mimetic and is proven to counteract age-related muscle loss. Therefore, we tested whether rapamycin acts via similar mechanisms as CR to slow muscle aging. Here we show that long-term CR and rapamycin unexpectedly display distinct gene expression profiles in geriatric mouse skeletal muscle, despite both benefiting aging muscles. Furthermore, CR improves muscle integrity in mice with nutrient-insensitive, sustained muscle mTORC1 activity and rapamycin provides additive benefits to CR in naturally aging mouse muscles. We conclude that rapamycin and CR exert distinct, compounding effects in aging skeletal muscle, thus opening the possibility of parallel interventions to counteract muscle aging.


Conflict of interest statement

The authors declare no competing interests.

Figures

Fig. 1
Fig. 1. CR promotes beneficial metabolic and functional adaptations but does not prevent the age-related loss of muscle function.
A Experimental design schematic showing start and endpoints of middle and late intervention groups as well as time course of physiological measures, including body composition (MRI), grip strength (GS), voluntary wheel running (VWR), whole-body metabolism (CLAMS), hang test (HT) and glucose tolerance test (GTT). B Body mass for mouse groups fed ad libitum or 65% of ad libitum beginning at 15 months (CON15m and CR15m) or 20 months (CON20m and CR20m) of age; n = 18 (CON15m), 13 (CR15m), 5 (CON20m) and 8 (CR20m). C Mean daily food intake normalized to body surface area for middle-aged groups; n = 18 (CON15m) and 13 (CR15m). D Bimonthly recordings of whole-body fat (upper) and lean mass (lower); n = 18 (CON15m), 13 (CR15m), 6 (CON20m), and 8 (CR20m) mice. E absolute (upper) and body mass normalized (lower) all-limb grip strength; n = 19 (CON15m), 14 (CR15m), 6 (CON20m), and 8 (CR20m) mice. F Kaplan–Meier plot for the inverted grid-hang test performed prior to endpoint measures at 30 months of age for the middle-aged group; n = 11 (10mCON), 18 (CON15m), and 13 (CR15m) mice. G Twenty-four hours of voluntary running-wheel distance; n = 16 (CON15m), 13 (CR15m), 6 (CON20m), and 9 (CR20m) mice. Glucose tolerance test parameters including H blood glucose response to 2 mg·kg−1 glucose injection (I.P.), I peak glucose and J area under the curve/glucose tolerance; n = 15 (24mCON), 10 (24mCR) and 9 (8mCON). K Whole-body metabolic analysis of energy expenditure normalized to body surface area (upper), mean X-Y-Z activity (middle) and respiratory exchange ratio (VCO2/VO2; lower) reported every 2 h across one full day (white)/night (black) cycle in the month prior to endpoint measures; n = 12 (10mCON), 9 (30mCON), and 7 (30mCR) mice. Data are presented as mean ± SEM. Two-way repeated-measures ANOVA with Tukey post hoc tests (BE, G, H, K), Mantel–Cox log rank (F), and one-way ANOVA with Fisher’s LSD post hoc tests (I, J) was used to compare the data. *, **, and *** denote a significant difference between groups of P < 0.05, P < 0.01, and P < 0.001, respectively. Colored asterisks refer to the group of comparison. Experimental scheme in A created with BioRender.com.
Fig. 2
Fig. 2. CR promotes a fast-to-slow muscle fiber phenotype shift.
A Muscle mass for quadriceps (QUAD), gastrocnemius (GAS), tibialis anterior (TA), plantaris (PLA), extensor digitorum longus (EDL), soleus (SOL), and triceps brachii (TRI) was averaged across both limbs, normalized to body mass and then to 10-month-old control mice. B Scatterplots and linear regressions of the relationship between body and muscle mass of the fast twitch TA, TRI, GAS, QUAD and EDL muscles and the slow twitch SOL muscle. Isolated muscle function parameters, including C force-frequency curve (left) and fatigue response to multiple stimulations (right), D peak force normalized to body mass, E peak force normalized to cross sectional area (specific force), and F mean twitch responses including time-to-peak tension (TPT), half-relaxation time (1/2-RT) and peak twitch (Pt) for SOL (top panel) and EDL muscle (bottom panel). G Proportional total fiber-type-specific cross-sectional area analyzed on whole cross-sections of (left to right) SOL (n = 6), EDL (n = 7, 9 and 8), TA (n = 11, 13 and 7) and TRI (n = 5, 9 and 9) for 10mCON, 30mCON and 30mCR, stained with antibodies against type I (blue), type IIA (yellow), and type IIB (green) fibers as well as laminin (red), while fibers without staining were classified as IIX. H Representative magnifications of images from whole-muscle cross sections for SOL, EDL, TA and TRI, quantified in 2G and Supplementary Fig. 2. Group numbers for 10mCON are n = 17 (A, B), 10 (CF: EDL) and 8 for fatigue, 11 (CE: SOL) or 9 for fatigue, for 30mCON n = 20 (A, B), 19 (CF: EDL), 15 (C, D, F: SOL) and 14 (E: SOL), and for 30mCR n = 20 (A, B), 18 (CE: EDL) or 16 for fatigue, 15 (CE: SOL) or 13 for fatigue, 12 (F: SOL) and 15 (F: EDL). Data are presented as mean ± SEM. One-way (A and DF) or two-way repeated- measure (C, G) ANOVAs with Fisher’s LSD or Tukey’s post hoc tests, respectively, were used to compare between data. *, **, and *** denote a significant difference between groups of P < 0.05, P < 0.01, and P < 0.001, respectively. Colored asterisks refer to the group of comparison.
Fig. 3
Fig. 3. CR and RM induce distinct gene expression signatures.
A Scheme of treatment groups, muscles, and numbers of samples used in sequencing analysis. Data for 10mCON, 30mCON, and 30mRM have been previously reported. B Coordinates of principal components representing aging (PC3 for 10mCON and 30mCON) CR (PC4 for 30mCON and 30mCR), RM (PC4 for 30mCON and 30mRM) and CR vs. RM (PC3 for 30mCR and 30mRM) effects for gene expression collected in soleus (SOL), tibialis anterior (TA), triceps brachii (TRI) and gastrocnemius (GAS). The fraction of variance in gene expression and the number of genes aligned (Pearson correlation coefficient ≥0.4, z score projection ≥1.96) with each PC is displayed for each comparison. C Pairwise Venn diagram comparisons of genes significantly aligned to aging, CR and RM effects. Numbers in red, blue and black represent increasing, decreasing and oppositely regulated genes, respectively, with level of significance and representation factor denoted. D Top-ten DAVID gene ontology terms enriched (P < 0.05; gray and red dashed lines; one-sided, modified Fisher’s exact test) for genes aligned to both aging and CR effects, aging and RM effects or CR and RM effects. E Heatmap of fold-changes for genes aligned with any of the four PCs described in B for all four muscles. Hierarchical clustering based on the Euclidean distance of these changes rendered 8 gene clusters. n = 6 mice per muscle per group, except for SOL 30mCON where one data point was removed due to a technical error. F Plasma cytokine protein concentration; n = 6 (10mCON), 8 (30mCON), 6 (30mCR) and 6 (30mRM). Data are mean ± SEM and displayed as fold-change from 10mCON group. Cytokine levels below the fit curve range were set as 0. A one-way ANOVA with Fishers post hoc test was used to make comparisons between 10mCON and 30mCON, 30mCON and 30mRM and 30mCON and 30mCR. *, **, and *** denote a significant difference between groups of P < 0.05, P < 0.01, and P < 0.001, respectively. Where 0.05 < P < 0.10, P values are reported. Experimental scheme in A created with BioRender.com.
Fig. 4
Fig. 4. CR improves muscle function without suppressing mTORC1 activity in the TSCmKO model of accelerated muscle aging.
A Experimental design schematic. B Body, C whole-body fat, and D lean mass for WT and TSCmKO mice fed ad libitum (WT-AL and TSC-AL) or 70% of ad libitum (WT-CR and TSC-CR) beginning at 3 months of age. E Whole-body metabolic analysis of energy expenditure normalized to body surface area and F respiratory exchange ratio (VCO2/VO2; lower) reported every 2 h across one full day (white)/night (black) cycle (left) and day and night-time averages (right) in the month prior to endpoint measures; n = 12 (10mCON), 9 (30mCON), and 10 (30mCR) mice. G Representative western blot analysis of mTORC1 pathway components in gastrocnemius (GAS) muscle. H Quantification of western blots showing the abundance of phosphorylated protein normalized to total protein for mTOR, S6 and 4EBP1. I Inverted grid hang time and J time spent on a rotating rod. Isolated muscle function parameters for SOL (upper panel) and EDL (lower panel), including K specific force, L peak tetanic force normalized to body mass, M twitch time-to-peak tension, and N half-relaxation time as well as (O) fatigue response to multiple stimulations. For B-D, n = 12, 8, 9 and 8 except for the final time point where n = 16, 13, 12, and 12 for WT-AL, WT-CR, TSC-AL and TSC-CR, respectively. For E, F, n = 4, 4, 3, and 3; for G-H, n = 9, 7, 8, and 7 (pS6S235/236 and p4EBP1S65), 5, 5, 4, and 5 (pmTORS2448) and 4, 4, 4, and 4 (pS6S240/244); for I, n = 12, 8, 9 and 8; for J, n = 7, 5, 5 and 5; for K, L, n = 15, 11, 12, 11 (EDL) and 11, 8, 9, 8 (SOL); for M, N, n = 14, 10, 11, 12 (EDL) and 10, 8, 7, 6 (SOL) and; for O, n = 12, 9, 8, 8 (EDL) and 8, 7, 6, 7 (SOL) for WT-AL, WT-CR, TSC-AL and TSC-CR, respectively. Data are mean ± SEM. Two-way ANOVAs with Tukey post hoc tests were used to compare the data. *, **, and *** denote a significant difference between groups of P < 0.05, P < 0.01, and P < 0.001, respectively. #Denotes a trend where 0.05 < P < 0.10. Colored asterisks refer to the group of comparison. Experimental scheme in A created with BioRender.com.
Fig. 5
Fig. 5. CR attenuates p62 accumulation and improves muscle integrity in TSCmKO mice.
A Representative tibialis anterior (TA) cross sections stained with antibodies against p62 and laminin and counterstained with DAPI. Quantification of fibers with B p62+ aggregates and C p62+ cytosolic staining. D Western blot quantification of p62 protein expression in gastrocnemius muscle. E Plasma creatine kinase activity and F percentage centro-nucleated fibers in WT-AL, WT-CR, TSC-AL and TSC-CR mice. G RT-qPCR analysis of autophagy associated genes in gastrocnemius muscle. Western blot quantification of the abundance of H phosphorylated and total ULK1 protein, I LC3I, LC3II and the ratio of LC3II to I, and J beclin1 and BNIP3 protein as well as K representative gels. Two and three independent blots were performed for p62 and LC3B, respectively. RT-qPCR analysis of ER-stress and autophagy interacting genes, including L Trib3, M Xbp1, N Keap1, and O Gsta1. For B, C, n = 15, 12, 11, 11; for D, E, n = 9, 7, 8, 7; for F, n = 11, 7, 8, 7; for G and N, O n = 12, 8, 9, 8; for H, n = 5, 3, 4, 3; for I, n = 10, 8, 8, 8; for J, n = 4, 4, 4, 4, for L, M, n = 12, 8, 8, 8 and; for N, O, n = 12, 8, 9, 8 for WT-AL, WT-CR, TSC-AL, and TSC-CR, respectively. Data are presented as mean ± SEM. Two-way ANOVAs with Tukey post hoc tests were used to compare data. *, **, and *** denote a significant difference between groups of P < 0.05, P < 0.01, and P < 0.001, respectively. #Denotes a trend where 0.05 < P < 0.10. Colored asterisks refer to the group of comparison.
Fig. 6
Fig. 6. RM and CR exert distinct and additive effects on whole-body muscle function and metabolism.
A Experimental design schematic showing experimental groups as well as time course of physiological measures. Repeated measures (left) of B body mass, C food intake normalized to body surface area, D whole-body fat (upper), and lean (lower) mass as well as E absolute (upper) and body mass normalized (lower) all-limb grip strength measured across the treatment period from 19 to 28 months as well as the percentage change between 22 months after adaptation to CR and 28 months (right). F Day and night-time voluntary running distance and G running speed patterns across a 24 h period, as well as H Kaplan–Meier plot for the inverted grid-hang test performed prior to endpoint measures at 28 months. Whole-body metabolic analysis of I energy expenditure normalized to body surface area and J respiratory exchange ratio reported every 2 h across one full day (white)/night (black) cycle in the month prior to endpoint measures. K blood glucose levels and L voluntary food intake over the night-time feeding period following a day-time fast in 10mCON, 28mCON, 28mRM, 28mCR and 28mCR+RM groups. For BE, n = 15 (Adult), 27 (CON), 19 (RM), 25 (CR), 22 (CR + RM). For F, G, n = 15 (Adult), 21 (CON), 10 (RM), 23 (CR), 19 (CR + RM). For H, n = 15 (Adult), 21 (CON), 12 (RM), 20 (CR), 18 (CR + RM). For I, J, n = 13 (Adult), 22 (CON), 14 (RM), 25 (CR), 21 (CR + RM). For K, L, n = 15 (Adult), 15 (CON), 12 (RM), 20 (CR), 18 (CR + RM). Data are presented as mean ± SEM. Two-way ANOVAs with Tukey post hoc tests (AG and IL) and Mantel–Cox log rank tests (H) were used to compare the data. *, **, and *** denote a significant difference between groups of P < 0.05, P < 0.01, and P < 0.001, respectively. #Denotes a trend where 0.05 < P < 0.10. Colored asterisks refer to the group of comparison. Experimental scheme in A created with BioRender.com.
Fig. 7
Fig. 7. CR and RM have additive effects on muscle mass, function and fiber size and composition.
A Muscle mass for tibialis anterior (TA), quadriceps (QUAD), extensor digitorum longus (EDL), soleus (SOL), plantaris (PLA), gastrocnemius (GAS), brachioradialis (BR), biceps brachii (BIC) and triceps brachii (TRI) were averaged across both limbs, normalized to body mass and then to 10-month-old control mice. Isolated muscle function parameters, including B force–frequency curve and C fatigue response to multiple stimulations, D peak force normalized to body mass, E peak force normalized to cross sectional area (specific force), and F mean twitch responses including time-to-peak tension (TPT), half-relaxation time (1/2-RT) and peak twitch (Pt) for SOL (top panel) and EDL muscle (bottom panel). G Representative cross sectional images along with H fiber-type-specific minimum fiber feret distribution showing ad libitum-fed (upper) and calorie restricted (lower) groups, I fiber type-specific fiber numbers, and J total fiber-type-specific cross-sectional area of the forelimb BR muscle stained with antibodies against type I (blue), type IIA (yellow), and type IIB (green) fibers as well as laminin (red), while fibers without staining were classified as IIX. For A, group numbers are n = 15 (14 for SOL, 13 for BR and BIC; Adult), 21 (17 for BR, 19 for BIC; CON), 10 (9 for TRI; RM), 23 (22 for SOL and BIC, 21 for BR and TRI; CR) and 19 (18 for BR and BIC; CR + RM). For B, DF (SOL), n = 8 (Adult), 15 (CON), 7 (RM), 15 (CR) and 15 (CR + RM). For C (SOL), n = 8 (Adult), 15 (CON), 7 (RM), 12 (CR) and 14 (CR + RM). For B, DF (EDL), n = 7 (Adult), 15 (CON), 7 (RM), 14 (CR), 15 (CR + RM). For C (EDL), n = 4 (Adult), 14 (CON), 7 (RM), 12 (CR) and 14 (CR + RM). For G, H, n = 6 (Adult), 5 (CON), 6 (RM), 8 (CR) and 8 (CR + RM). Data are mean ± SEM. Two-way repeated-measure ANOVAs with Tukey’s post hoc tests were used to compare between data. *, **, and *** denote a significant difference between groups of P < 0.05, P < 0.01, and P < 0.001, respectively. Colored asterisks refer to the group of comparison.
Fig. 8
Fig. 8. Is rapamycin a calorie restriction mimetic?
A Calorie restriction (CR) induces broad changes in activity (e.g., anticipatory behavior), metabolism (e.g., reduced metabolic rate), nutrition (e.g., nutrient stress and temporally compressed food intake) and body composition (e.g., reduced body mass and lean phenotype). B Long-term CR promotes a slow, pro-endurance muscle phenotype including improved endurance performance, slower contraction speeds and a fast-to-slow fiber type shift, particularly in the depicted soleus muscle. C CR suppresses mTORC1 activity by lowering the availability of its positive regulators, including growth factors, energy, and amino acids, leading to reduced translation and increased autophagy. D Despite both RM and CR suppressing mTORC1 activity, long-term treatments exert distinct and often opposing molecular signatures in aging skeletal muscle. E CR improves muscle quality in TSCmKO mice, which display sustained, nutrient-insensitive mTORC1 activity and a premature sarcopenic phenotype, indicating that muscle mTORC1 suppression is not required for CR-induced benefits. F While CR and RM both improve whole-body muscle function and promote a fast-to-slow fiber type switch, the effects are frequently additive in calorie-restricted mice treated with RM. Together, these data demonstrate that RM is not a CR mimetic, but could rather be an adjunct therapy for CR-like interventions. Figure created with BioRender.com.

References

    1. Most J, Tosti V, Redman LM, Fontana L. Calorie restriction in humans: an update. Ageing Res. Rev. 2017;39:36–45. - PMC - PubMed
    1. McCracken AW, Adams G, Hartshorne L, Tatar M, Simons MJP. The hidden costs of dietary restriction: implications for its evolutionary and mechanistic origins. Sci. Adv. 2020;6:eaay3047. - PMC - PubMed
    1. Fontana L, Partridge L. Promoting health and longevity through diet: from model organisms to humans. Cell. 2015;161:106–118. - PMC - PubMed
    1. Powers RW, 3rd, Kaeberlein M, Caldwell SD, Kennedy BK, Fields S. Extension of chronological life span in yeast by decreased TOR pathway signaling. Genes Dev. 2006;20:174–184. - PMC - PubMed
    1. Bjedov I, et al. Mechanisms of life span extension by rapamycin in the fruit fly Drosophila melanogaster. Cell Metab. 2010;11:35–46. - PMC - PubMed

Publication types

Substances