. 2022 Apr 19;13(1):2133.
doi: 10.1038/s41467-022-29719-1.

TNF is a potential therapeutic target to suppress prostatic inflammation and hyperplasia in autoimmune disease

Affiliations

TNF is a potential therapeutic target to suppress prostatic inflammation and hyperplasia in autoimmune disease

Renee E Vickman et al. Nat Commun. .

Abstract

Autoimmune (AI) diseases can affect many organs; however, the prostate has not been considered to be a primary target of these systemic inflammatory processes. Here, we utilize medical record data, patient samples, and in vivo models to evaluate the impact of inflammation, as seen in AI diseases, on prostate tissue. Human and mouse tissues are used to examine whether systemic targeting of inflammation limits prostatic inflammation and hyperplasia. Evaluation of 112,152 medical records indicates that benign prostatic hyperplasia (BPH) prevalence is significantly higher among patients with AI diseases. Furthermore, treating these patients with tumor necrosis factor (TNF)-antagonists significantly decreases BPH incidence. Single-cell RNA-seq and in vitro assays suggest that macrophage-derived TNF stimulates BPH-derived fibroblast proliferation. TNF blockade significantly reduces epithelial hyperplasia, NFκB activation, and macrophage-mediated inflammation within prostate tissues. Together, these studies show that patients with AI diseases have a heightened susceptibility to BPH and that reducing inflammation with a therapeutic agent can suppress BPH.


Conflict of interest statement

The authors declare no competing interests.

Figures

Fig. 1
Fig. 1. Men with autoimmune disease have increased BPH prevalence.
Chi-square tests were utilized to compare the proportion of BPH diagnoses in men with an AI condition versus men with no AI condition. Colors indicate categories of patients, where black = patients without AI disease, gray = patients with AI disease, green = patients diagnosed with AI disease prior to BPH diagnosis, and yellow = patients diagnosed with AI disease after BPH diagnosis. a Flow chart indicating the breakdown of patients into groups based on the presence of AI disease diagnosis (9.6% with and 90.4% without AI disease diagnosis). Patients with AI disease diagnosis were further separated into groups based on whether AI disease diagnosis occurred prior to or after BPH diagnosis. b BPH prevalence in patients without AI disease is 20.3%. c BPH prevalence in patients with AI disease is 30.6%. d Graph indicates the significant increase in BPH prevalence in patients with different AI diseases compared to patients without AI disease using chi-square tests. e The BPH incidence in patients previously diagnosed with AI conditions, when patients may have been treated for these conditions, is 19.4%. f Chi-square tests indicate the significant changes in BPH incidence in patients diagnosed with different AI diseases prior to BPH diagnosis compared to the baseline BPH prevalence of 20.3%. a indicates a significantly higher BPH incidence than the 20.3% reference, although this is decreased from 38.0% prevalence in all RA patients (d). *p < 0.05, **p < 0.01, and ***p < 0.001.
Fig. 2
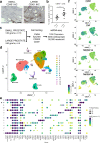
Fig. 2. Analysis of CD45+ cells from human BPH tissues indicate macrophages express high levels of TNF and TNF receptors.
a CD45 IHC in human prostate transition zone from small or large prostates (n = 4 patients per group). Staining was confirmed in two independent experiments. Brown color indicates positive CD45 staining and scale bars = 500 µm. b Human prostate transition zone from small or large prostates (n = 10 patients per group) were digested, stained, and analyzed by flow cytometry. Graph indicates % CD45+ cells, gated on viable cells. A significant difference in %CD45+ cells (**p = 0.0021) using a two-tailed t test. Error bars represent the mean ± SEM. Source data are provided as a Source Data file. c Schematic representing the setup for scRNA-seq studies of human BPH leukocytes (CD45+ cells). A total of 10 small and 4 large prostate transition zone tissues were digested and CD45+EpCAM-CD200 cells sorted by FACS. scRNA-seq was conducted using the 10X Chromium system, aiming for 5000 cells/sample at a depth of 50,000 reads/cell. df scRNA-seq of BPH associated leukocytes. d Uniform manifold approximation and projection (UMAP) plot of 69,850 individual cells from 14 patient samples, demonstrating dominant T cell and macrophage populations. Each color indicates a unique cell cluster. e Dot plot of the top 4 marker genes from each cluster ranked by fold-change. Gene names are shown on the x-axis and clusters on the y-axis. The size of the dots corresponds to the percentage of cells in a given cluster that express the marker gene. The color of the dots represents the mean log2(counts + 1) of each gene in the corresponding cluster. f Feature plots highlighting gene expression of CD68, TNF, TNFRSF1A (TNFR1), and TNFRSF1B (TNFR2), where the blue color indicates elevated expression of the indicated gene. a indicates a small contaminating epithelial population as cluster 12.
Fig. 3
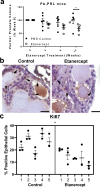
Fig. 3. TNF-antagonist treatment reduces prostate size and epithelial proliferation in Pb-PRL mice.
Pb-PRL mice (20-22 months) were treated with 4 mg/kg etanercept or PBS vehicle for 12 weeks. a Volume of ventral prostate by ultrasound every four weeks during the 12-week treatment with etanercept or PBS vehicle control. Measurements are normalized to pre-treatment volume (151 ± 10 mm3), and the plot indicates the mean ± SEM. One control mouse was removed from the 12-week evaluation, but the data point is included for reference and indicated by a gray point •. A two-sided linear mixed model analysis showed a significant difference based on treatment (p < 0.0001) and Bonferroni correction determined a reduction in ventral prostate volume compared to PBS-treated mice at 12 weeks (*p = 0.0365; n = 5 per group). Source data are provided as a Source Data file. b Representative images of Ki67 staining in control or etanercept-treated mice, where brown color indicates positive staining. c Quantitation of IHC staining for epithelial Ki67 in control or etanercept-treated mice (n = 5 animals per group), indicated as the percent Ki67 positive epithelial cells per field of view. Data indicate the mean ± SEM of the percent positive cells in three prostate tissue fields for each animal. Comparison of control and etanercept-treated groups determined a significant difference (*p = 0.0105) using a two-tailed nested t test. Source data are provided as a Source Data file. Scale bars = 20 µm. a indicates an animal excluded from statistical analysis.
Fig. 4
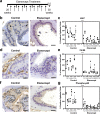
Fig. 4. TNF-antagonist treatment reduces prostatic epithelial proliferation, macrophage infiltration, and NFκB activity in NOD mice.
a Diagram representing the timeline of treatment in NOD mice. Mice were treated twice per week for 5 weeks with 4 mg/kg etanercept or PBS vehicle, indicated with black arrows. At the end of the 5-week treatment period, tissues were harvested for analysis. b Representative images of Ki67 staining in control or etanercept-treated mice, where brown color indicates positive staining. c Graph indicating the quantitative summary of Ki67 IHC as the percent of positive epithelial cells per field (***p = 0.0002). d Representative images of F4/80+ staining in control or etanercept-treated mice, where brown color indicates positive staining. e Quantitative summary of IHC staining for F4/80+ cells, represented as the portion of all immune cells in each field (***p = 0.0002). f Representative images of phospho-p65 staining in control or etanercept-treated mice, where brown color indicates positive staining. g Data presented indicate the percentage of phospho-p65 positive epithelial cells counted per field of view (****p < 0.0001). c, e, g Data indicate the mean ± SEM of the percent positive cells in the indicated number of prostate tissue fields for each animal (n = 8 for control-treated and n = 12 for etanercept-treated). Comparison of control and etanercept-treated groups for statistical purposes was conducted using a two-tailed nested t test and asterisks indicate the significance of the treatment. Source data are provided as a Source Data file. Scale bars = 20 µm.
Fig. 5
Fig. 5. Etanercept treatment induces pathway alterations in NOD prostate tissues.
Bulk RNA-seq was conducted on the prostate tissues from control and etanercept-treated NOD mice (n = 4 per group) after five weeks of treatment. a Hierarchical clustering of samples based on DE genes indicates separate clustering of the two treatment groups. Clustering analysis is carried out by log2(FPKM + 1) of union DE genes. Red color indicates upregulated genes and blue color indicates downregulated genes. b, c KEGG enrichment analysis using a one-tailed Fisher’s exact test identified significantly upregulated (b) and downregulated (c) pathways in response to etanercept treatment (adjusted p-value< 0.05). Numbers listed with each bar indicate the number of altered genes within each pathway. Source data are provided as a Source Data file.
Fig. 6
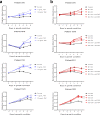
Fig. 6. Macrophage-derived TNF promotes prostate fibroblast cell growth.
Primary prostate fibroblasts from two BPH tissues (patients 376, 1579, 012, and 1531) were subjected to indicated treatments. Crystal violet growth assays were performed in low serum conditions (0.5%) over six days. a Fibroblast cultures (n = 4 independent patients) were grown in the presence or absence of 1 or 10 ng/mL recombinant TNF (dark and light blue, respectively). Asterisks indicate significant differences compared to control samples (black lines), determined by two-sided, two-way ANOVA with multiple comparisons test. b Fibroblast cultures (n = 4 independent patients) were grown in the presence of 50% M1 (dark red) or M2 (light red) macrophage conditioned medium (generated from THP-1 cells) ±40 µg/mL TNF neutralizing antibody. Conditions containing anti-TNF neutralizing antibody are indicated with dashed lines. Points indicate the mean ± SEM of at least five technical replicates and graphs are representative of three independent experiments. Asterisks indicate significant differences compared to the paired conditioned medium condition without anti-TNF neutralization, using a two-sided, two-way ANOVA with Tukey’s multiple comparisons test. Source data are provided as a Source Data file. n.s.=not significant, *p < 0.05, **p < 0.01, ***p < 0.001, and ****p < 0.0001.
Fig. 7
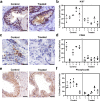
Fig. 7. Patients treated with TNF-antagonists have decreased prostatic epithelial proliferation, macrophage infiltration, and NFκB activation.
Human transition zone tissues from patients taking TNF-antagonists at the time of radical prostatectomy or matched controls (n = 5 per group) were used for histological evaluation. a Representative images of IHC staining for Ki67 in control or treated patients, where brown color in the nucleus indicates positive staining. b Quantitation of IHC staining for epithelial Ki67 in control or treated patients, indicated as the percent Ki67+ epithelial cells per field (*p = 0.0123). c Representative images of IHC staining for CD68 in control or treated patients, where brown color indicates positive staining. d IHC quantitation indicating the abundance of CD68+ macrophages, represented as the portion of all immune cells per field (*p = 0.0148). e Representative images of phospho-p65 staining via IHC in control or treated patients, where brown color in the nucleus indicates positive staining. f Data represents the quantitation of IHC staining for epithelial phospho-p65 staining in control or treated patients, represented as the percent positive epithelial cells per field (*p = 0.0172). b, d, f Data indicate the mean ± SEM of the percent positive cells per field, where individual points indicate separate fields for each patient. Comparison of control and TNF-antagonist treated groups were conducted using a two-tailed nested t test and asterisks indicate the significance of the treatment. Source data are provided as a Source Data file. Scale bars = 20 µm.

Comment in

  • Could TNF-antagonists be a novel treatment strategy for BPH patients?
    Vickman RE, Franco OE, Hayward SW. Vickman RE, et al. Cell Stress. 2022 Jun 7;6(6):65-67. doi: 10.15698/cst2022.06.268. eCollection 2022 Jun. Cell Stress. 2022. PMID: 36072128 Free PMC article.
  • Uro-Science.
    Atala A. Atala A. J Urol. 2022 Dec;208(6):1340-1342. doi: 10.1097/JU.0000000000002980. Epub 2022 Sep 26. J Urol. 2022. PMID: 36154669 No abstract available.

References

    1. Berry SJ, Coffey DS, Walsh PC, Ewing LL. The development of human benign prostatic hyperplasia with age. J. Urol. 1984;132:474–479. doi: 10.1016/S0022-5347(17)49698-4. - DOI - PubMed
    1. McVary KT. BPH: epidemiology and comorbidities. Am. J. Manag Care. 2006;12:S122–S128. - PubMed
    1. Nicholson TM, Ricke WA. Androgens and estrogens in benign prostatic hyperplasia: past, present and future. Differentiation. 2011;82:184–199. doi: 10.1016/j.diff.2011.04.006. - DOI - PMC - PubMed
    1. Fowke JH, Koyama T, Fadare O, Clark PE. Does inflammation mediate the obesity and bph relationship? An epidemiologic analysis of body composition and inflammatory markers in blood, urine, and prostate tissue, and the relationship with prostate enlargement and lower urinary tract symptoms. PLoS ONE. 2016;11:e0156918. doi: 10.1371/journal.pone.0156918. - DOI - PMC - PubMed
    1. Nandeesha H, Koner BC, Dorairajan LN, Sen SK. Hyperinsulinemia and dyslipidemia in non-diabetic benign prostatic hyperplasia. Clin. Chim. Acta. 2006;370:89–93. doi: 10.1016/j.cca.2006.01.019. - DOI - PubMed

Publication types