. 2022 Apr 19;13(1):2112.
doi: 10.1038/s41467-022-29635-4.

Bird populations most exposed to climate change are less sensitive to climatic variation

Affiliations

Bird populations most exposed to climate change are less sensitive to climatic variation

Liam D Bailey et al. Nat Commun. .

Abstract

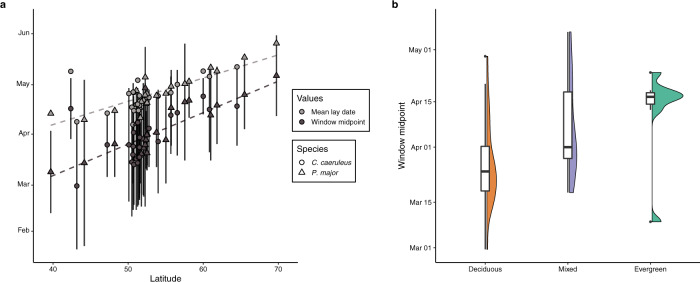
The phenology of many species shows strong sensitivity to climate change; however, with few large scale intra-specific studies it is unclear how such sensitivity varies over a species' range. We document large intra-specific variation in phenological sensitivity to temperature using laying date information from 67 populations of two co-familial European songbirds, the great tit (Parus major) and blue tit (Cyanistes caeruleus), covering a large part of their breeding range. Populations inhabiting deciduous habitats showed stronger phenological sensitivity than those in evergreen and mixed habitats. However, populations with higher sensitivity tended to have experienced less rapid change in climate over the past decades, such that populations with high phenological sensitivity will not necessarily exhibit the strongest phenological advancement. Our results show that to effectively assess the impact of climate change on phenology across a species' range it will be necessary to account for intra-specific variation in phenological sensitivity, climate change exposure, and the ecological characteristics of a population.


Conflict of interest statement

The authors declare no competing interests.

Figures

Fig. 1
Fig. 1. Illustration of key terms.
a Temperature window of a population (grey shaded area) is identified. b Population-specific temperature cue is used to estimate climate change exposure and phenological sensitivity. c Expected phenological advancement is the product of a population’s climate change exposure and phenological sensitivity. Darker background colour represents higher phenological advancement.
Fig. 2
Fig. 2. Intra-specific variation in temperature windows.
a Latitudinal change in temperature window midpoint (black) and mean annual laying date (grey) of European populations of great tits (triangles) and blue tits (circles). Temperature window midpoint increased with latitude in both species, while window duration (vertical lines) and the delay (difference between window midpoint and mean laying date; dashed lines) did not change significantly. b Difference in temperature window midpoint for great and blue tits inhabiting deciduous (orange), mixed (blue), or evergreen (green) habitats (n = 27, 13, and 7 biologically independent populations respectively). Shown are box and violin plots of temperature window midpoints of both great and blue tits in each habitat type. Boxplots shows median (centre line), 25th and 75th quantiles (lower and upper hinges), and 1.5× inter-quartile range (whiskers). Observations further than 1.5× inter-quartile range are shown as outlier points.
Fig. 3
Fig. 3. Variation in phenological sensitivity.
Phenological sensitivity (days advanced/C) differed between habitat types: deciduous (orange), mixed (blue), or evergreen (green; n = 27, 13, and 7 biologically independent populations respectively). Phenological sensitivity is higher in deciduous habitats than either evergreen or mixed habitats. Shown are box and violin plots of phenological sensitivity of both great and blue tits in each habitat type. Boxplots shows median (centre line), 25th and 75th quantiles (lower and upper hinges), and 1.5× inter-quartile range (whiskers). Observations further than 1.5× inter-quartile range are shown as outlier points.
Fig. 4
Fig. 4. Estimated phenological advancement.
Phenological advancement (days advanced/year of great tit (Parus major; triangle) and blue tit (Cyanistes caeruleus; circle) populations in deciduous (orange), mixed (blue), and evergreen (green) dominant habitats. Phenological advancement (background colour) is a product of phenological sensitivity and climate change exposure. A darker background colour represents greater phenological advancement over time. Populations with the highest recorded phenological sensitivity do not show the highest expected phenological advancement due to their lower climate change exposure. Coloured points represent each population’s expected phenological advancement, the product of estimated phenological sensitivity and climate change exposure. Note that phenological sensitivity and climate change exposure are calculated within population-specific temperature windows, which accounts for observed intra-specific variation in temperature window midpoints (Fig. 2). Vertical and horizontal lines represent standard errors of slope estimates for climate change exposure and phenological sensitivity respectively. Number of biologically independent years used to estimate phenological sensitivity for each population is available in Supplementary Data 1. Climate change exposure is estimated in each population using 68 biologically independent years (1950–2017).
Fig. 5
Fig. 5. Distribution of study populations from which phenological data were collected.
a Phenological information (laying date) was recorded at a site for either great tit (Parus major; triangle), blue tits (Cyanistes caeruleus; circle), or both species (square). Data was collected on both species at the majority of sites (68%; 27 sites). Sites are classified as either deciduous dominant (black), evergreen dominant (white), or mixed (grey). Insets (b, c) show populations across Belgium and Netherlands and the UK respectively.

References

    1. Gienapp P, Reed TE, Visser ME. Why climate change will invariably alter selection pressures on phenology. Proc. R. Soc. B. 2014;281:20141611. doi: 10.1098/rspb.2014.1611. - DOI - PMC - PubMed
    1. Parmesan C. Influences of species, latitudes and methodologies on estimates of phenological response to global warming. Glob. Change Biol. 2007;13:1860–1872. doi: 10.1111/j.1365-2486.2007.01404.x. - DOI
    1. Root TL, et al. Fingerprints of global warming on wild animals and plants. Nature. 2003;421:57–60. doi: 10.1038/nature01333. - DOI - PubMed
    1. Thackeray SJ, et al. Phenological sensitivity to climate across taxa and trophic levels. Nature. 2016;535:241–245. doi: 10.1038/nature18608. - DOI - PubMed
    1. Thackeray SJ, et al. Trophic level asynchrony in rates of phenological change for marine, freshwater and terrestrial environments. Glob. Change Biol. 2010;16:3304–3313. doi: 10.1111/j.1365-2486.2010.02165.x. - DOI

Publication types