. 2022 Apr 19;13(1):2043.
doi: 10.1038/s41467-022-29623-8.

New seasonal pattern of pollution emerges from changing North American wildfires

Affiliations

New seasonal pattern of pollution emerges from changing North American wildfires

Rebecca R Buchholz et al. Nat Commun. .

Abstract

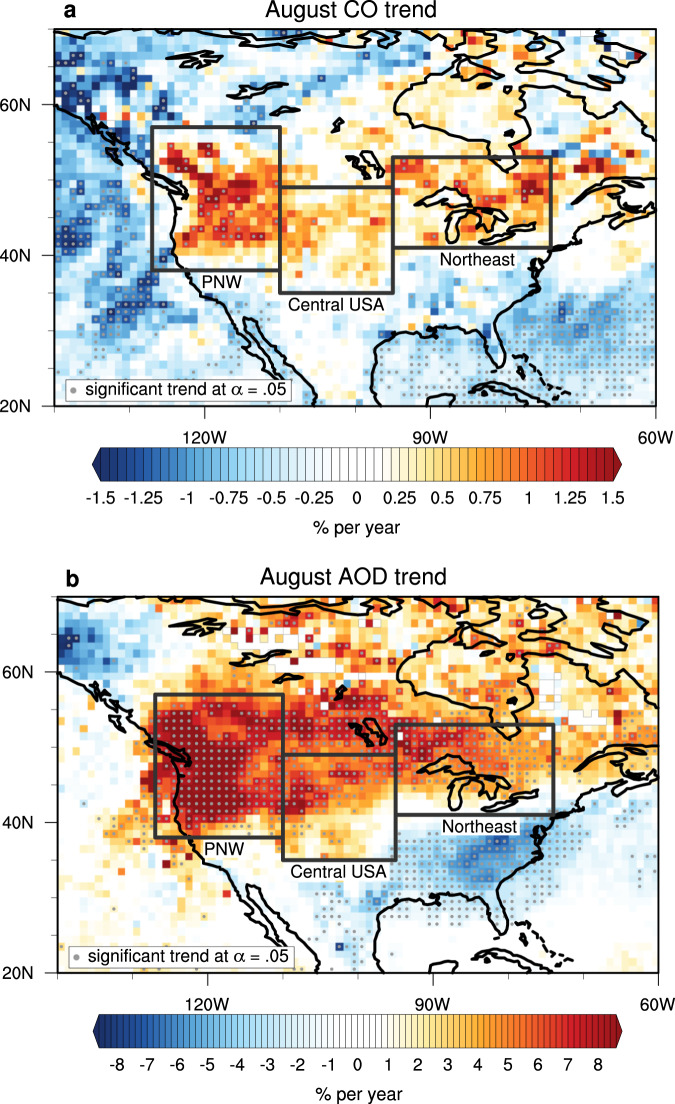
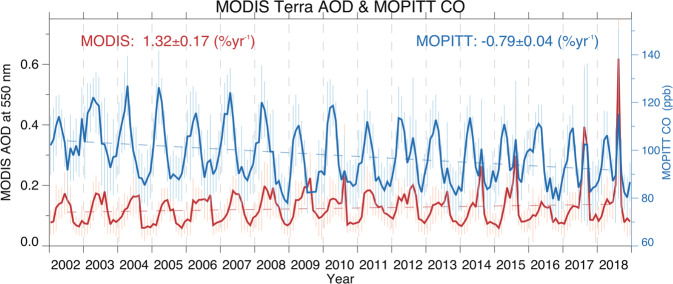
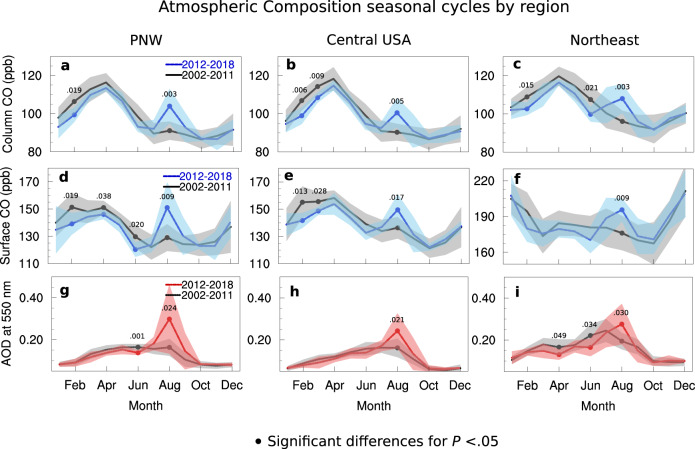
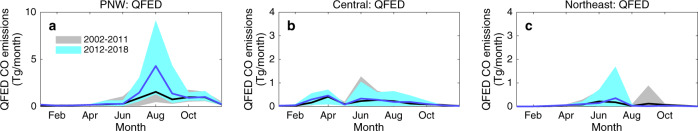
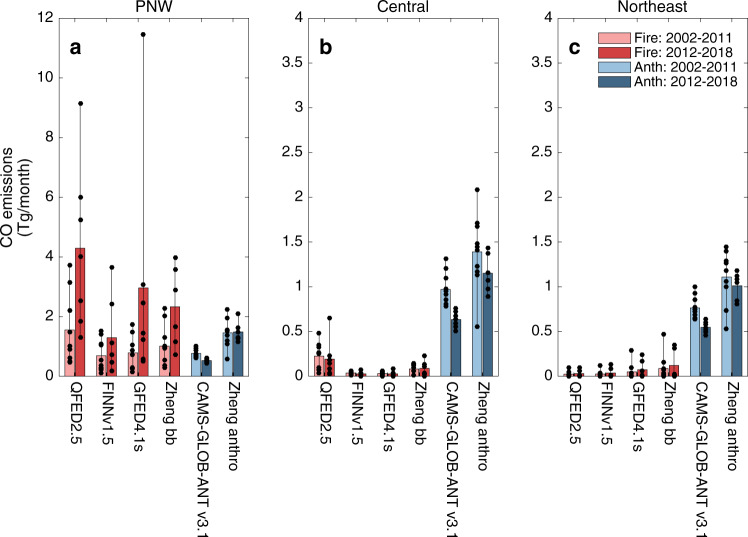
Rising emissions from wildfires over recent decades in the Pacific Northwest are known to counteract the reductions in human-produced aerosol pollution over North America. Since amplified Pacific Northwest wildfires are predicted under accelerating climate change, it is essential to understand both local and transported contributions to air pollution in North America. Here, we find corresponding increases for carbon monoxide emitted from the Pacific Northwest wildfires and observe significant impacts on both local and down-wind air pollution. Between 2002 and 2018, the Pacific Northwest atmospheric carbon monoxide abundance increased in August, while other months showed decreasing carbon monoxide, so modifying the seasonal pattern. These seasonal pattern changes extend over large regions of North America, to the Central USA and Northeast North America regions, indicating that transported wildfire pollution could potentially impact the health of millions of people.


Conflict of interest statement

The authors declare no competing interests.

Figures

Fig. 1
Fig. 1. August trend analysis of atmospheric composition.
August trend (2002–2018) in satellite-measured atmospheric composition is shown in a 1×1 degree grid. a Column carbon monoxide (CO) trends (n = 16) and b aerosol optical depth (AOD) trends (n = 17). Gray dots indicate significant non-zero trends, α = 0.05. Defined regions are outlined in black: Pacific Northwest (PNW, 38–57N, 127–110W), Central USA (35–49N, 110–95W), and the Northeast (41–53N, 95–74W). White areas outlined in gray denote missing data.
Fig. 2
Fig. 2. Pacific Northwest time series and trend analysis of atmospheric composition from 2002 to 2018.
We show Measurements of Pollution in the Troposphere (MOPITT) monthly average carbon monoxide (CO) as units of column average volume mixing ratio in parts per billion (ppb, blue) and Moderate Resolution Imaging Spectroradiometer (MODIS) monthly average aerosol optical depth (AOD, red). Error bars represent monthly standard deviation. Vertical gray dashed lines indicate the beginning of each year. Trends are determined using the weighted least squares estimate of the slope from data anomalies, and include the standard error of the slope estimate. For CO the mean sample size, n, is 1110 observations; for AOD the mean sample size, n, is 240 observations. Full details of all n values are provided in the Source Data file.
Fig. 3
Fig. 3. Seasonal patterns of atmospheric composition.
Regional seasonal patterns of atmospheric composition are shown for two different time periods: 2002–2011 (black line with gray shading) and 2012–2018 (blue or red). ac Measurements of Pollution in the Troposphere (MOPITT) carbon monoxide (CO) as column average volume mixing ratio (VMR) in parts per billion (ppb). df MOPITT surface CO VMR. gi Moderate Resolution Imaging Spectroradiometer (MODIS) aerosol optical depth (AOD). Regions are the Pacific Northwest (PNW), Central USA, and the Northeast. The shaded area shows the standard deviation and filled circles represent data means that are significantly different between the two time periods with P values noted for a two-tailed t-test. More complete statistics relevant for the August differences can be found in Table 1. The Northern Hemisphere background CO trend 2002–2018 of −0.50 ppb per year was removed prior to seasonal cycle calculation for (a)–(f).
Fig. 4
Fig. 4. Seasonal patterns of wildfire carbon monoxide (CO) emissions.
Mean seasonal cycles for wildfire CO emissions in terragrams (Tg) in each region, a PNW, b Central USA and c Northeast, for each time period using the Quick Fire Emissions Dataset (QFED) inventory. Black lines follow the averaged monthly mean for 2002–2011, blue lines for 2012–2018. Shading represents the range in inter-annual variability for each month.
Fig. 5
Fig. 5. Regional comparison of August carbon monoxide (CO) emissions.
Mean August CO emissions are shown in terragrams (Tg) for the two time periods (2002–2011, light colors, and 2012–2018, dark colors) for the three study regions: a PNW, b Central USA and c Northeast. We assess wildfire emissions from four inventories (Fire, red): QFED2.5, FINN1.5, GFED4.1s, and Zheng reanalysis, and two anthropogenic inventories (Anth, blue): CAMS-GLOB-ANT v3.1 and Zheng reanalysis. Note, Zheng reanalysis ends in 2017. Black circles represent regional August means for each year within the time periods.

References

    1. Dennison PE, Brewer SC, Arnold JD, Moritz MA. Large wildfire trends in the western United States, 1984–2011. Geophys. Res. Lett. 2014;41:2928–2933. doi: 10.1002/2014GL059576. - DOI
    1. Westerling AL. Increasing western US forest wildfire activity: Sensitivity to changes in the timing of spring. Philos. Trans. R. Soc. B: Biol. Sci. 2016;371:20150178. doi: 10.1098/rstb.2015.0178. - DOI - PMC - PubMed
    1. Schoennagel T, et al. Adapt to more wildfire in western North American forests as climate changes. Proc. Natl Acad. Sci. USA. 2017;114:4582–4590. doi: 10.1073/pnas.1617464114. - DOI - PMC - PubMed
    1. Westerling AL, Hidalgo HG, Cayan DR, Swetnam TW. Warming and earlier spring increase western U.S. forest wildfire activity. Science. 2006;313:940–943. doi: 10.1126/science.1128834. - DOI - PubMed
    1. Abatzoglou JT, Williams AP. Impact of anthropogenic climate change on wildfire across western US forests. Proc. Natl Acad. Sci. USA. 2016;113:11770–11775. doi: 10.1073/pnas.1607171113. - DOI - PMC - PubMed

Publication types