. 2022 Apr 19;13(1):2083.
doi: 10.1038/s41467-022-29302-8.

Astroblastomas exhibit radial glia stem cell lineages and differential expression of imprinted and X-inactivation escape genes

Affiliations

Astroblastomas exhibit radial glia stem cell lineages and differential expression of imprinted and X-inactivation escape genes

Norman L Lehman et al. Nat Commun. .

Erratum in

Abstract

Astroblastomas (ABs) are rare brain tumors of unknown origin. We performed an integrative genetic and epigenetic analysis of AB-like tumors. Here, we show that tumors traceable to neural stem/progenitor cells (radial glia) that emerge during early to later brain development occur in children and young adults, respectively. Tumors with MN1-BEND2 fusion appear to present exclusively in females and exhibit overexpression of genes expressed prior to 25 post-conception weeks (pcw), including genes enriched in early ventricular zone radial glia and ependymal tumors. Other, histologically classic ABs overexpress or harbor mutations of mitogen-activated protein kinase pathway genes, outer and truncated radial glia genes, and genes expressed after 25 pcw, including neuronal and astrocyte markers. Findings support that AB-like tumors arise in the context of epigenetic and genetic changes in neural progenitors. Selective gene fusion, variable imprinting and/or chromosome X-inactivation escape resulting in biallelic overexpression may contribute to female predominance of AB molecular subtypes.


Conflict of interest statement

The authors declare no competing interests.

Figures
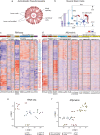
Fig. 1
Fig. 1. Astroblastoma and neural stem/progenitor cell morphologies and AB-like tumor molecular subtypes.
a Classic astroblastic pseudorossette. b Neural stem cell morphologies. NEC, neuroepithelial cell; vRG, ventricular  zone radial glia cell; oRG, outer radial glia cell; tRG, truncated radial glia cell; VZ, ventricular zone; SVZ, subventricular zone; OSVZ, outer subventricular zone. c Unsupervised hierarchical clustering of RNAseq expression data separates AB-like tumors into MN1-rearranged and MAPK/PI3K pathway transcriptomic groups. Genes overexpressed in MN1-BEND2 tumors are highlighted in red, those overexpressed in MAPK-ABC tumors in blue and PTPR in bronze. Some genes highly expressed in both MN1-BEND2 tumors and PTPR are depicted in red. Abbreviations: AFL, adult frontal lobe; AAM, adult amygdala; ACP, adult choroid plexus; ATH, adult thalamus; FCE, fetal cerebrum; FCM, fetal cerebellum; FCG, fetal germinal matrix; FHP, fetal hippocampus; PCM, pediatric cerebellum, PHP, pediatric hippocampus; PTH, pediatric thalamus. d tSNE analysis of RNAseq expression data. e Hierarchical clustering and f tSNE analysis of Affymetrix HTA2 RNA expression data. Classical PXA tumors cluster separately from MAPK-ABC AB-like tumors demonstrating that they are separate biologic entities. Source data: Supplementary Fig. 1, Gene Expression Omnibus (GEO) accession numbers GSE165351, GSE165813.
Fig. 2
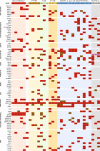
Fig. 2. Gene mutations and fusions segregate AB-like tumor genetic groups.
Pathway gene alterations across AB-like tumors, ATAB, PTPR and RELA STE are grouped. Missense = MS, splice region variant = SV, stop gained = SG, stop lost = SL, frameshift = FS, deletion = DEL, insertion = INS, fusion = FU, PT = PTPR. Detected genetic alterations are highlighted in red. Brown cells indicate fusions detected by only one read. Pink indicates a FathmmMLK score <0.5, but predicted to be damaging by PolyPhen or deleterious by SIFT. Source data: Supplementary Data 1 and 2.
Fig. 3
Fig. 3. Unsupervised tSNE analysis of genomic DNA methylation data reveals a distinct tumor DNA methylation class for Group C tumors.
a 3-dimensional tSNE plot of all study samples with the German Cancer Center (DKFZ) reference sample set. b Enlargement of MAPK/PI3K (MAPK-A & -B) and Group C methylation classes. 32,000 methylation sites were used for the analyses. LGG ST PA/GG, low-grade glioma, supratentorial pilocytic astrocytoma/ganglioglioma (nonspecific methylation class); LGG GG, low-grade glioma, ganglioglioma methylation class. Source data: GEO GSE125450 and GSE166569.
Fig. 4
Fig. 4. Astroblastoma-like tumor subtypes exhibit characteristic histologies and genetic alterations.
a AB tumor histology is characterized by astroblastic pseudorosettes, and oRG-like morphology in Group C tumors. ai H&E-stained AB-like tumor cases. Top row MN1-BEND2 cases; Middle row BRAFV600E-mutant MAPK-A cases; Bottom row Group C methylation class tumor cases. Subpial accumulations of tumor cells in C22 (g) demonstrated long basal processes extending to the pial surface and inconspicuous apical processes, morphologically resembling outer radial glial. Similar cells extend basal processes to blood vessels in C27 and C19 (hi). b Astroblastoma tumors cells within astroblastic pseudorosettes from Bailey and Bucy’s original cohort. a, b Tumor cells with long basal processes resembling those in Group C tumors (Plate III, Figs. 1. and 2). c Tumor cells from a case more similar in appearance to those in MAPK-AB tumors (Plate IV, Fig. 1). Mallory-Davidoff stain (a, b 850× and c, 600×). Reproduced with the publisher’s permission. c MN1-BEND2 and MAPK-ABC AB-like tumors show characteristic GFAP immunoreactivity. ac Only focal staining for GFAP is observed in MN1-BEND2 tumors. df MAPK-ABC tumors are strongly and diffusely GFAP immunoreactive. d MN1 diffusely highlights tumor nuclei in all MN1-BEND2 tumors tested (ac). Significant nuclear MN1 immunoreactivity is absent in non-MN1-BEND2 AB cases (df). e MN1-BEND2 tumors showed strong granular cytoplasmic IGF2 immunostaining (ac), not seen in non-MN1-BEND2 AB-like tumors (df). Immunohistochemical staining for all antibodies and samples was performed at least twice with equivalent results. f, g Mutations in AB-like tumor related genes occur in a patient age dependent manner. ABCC1 mutations and fusions all occurred in patients 16 years old or less. Its highest expression in the Allen Human Developmental Transcriptome (AHDT) was before 25 pcw. VEZT and VEZF mutations and CTD-2152M20.2-GOLPH3 fusions were all found in tumors from patients aged 25 and younger (Supplementary Data 2). The highest GOLPH3, VEZT and VEZF1 expression in the AHDT was under 25 pcw. MEG8 fusions occurred only in females 30 years of age and younger, most below 16 years, and only in MN1-BEND2 and MAPK-A tumors. GRIA2 mutations were present in MAPK-ABC cases. ANK3, PARP8 and PTEN alterations were mostly present in non-BRAFV600E MAPK-AB patients. A PARP8 fusion was present in a BRAFV600E tumor. Conversely, high GRIA2 expression spans the fetal and postnatal AHDT, but not below approximately 12 pcw. GRIA2 mutations are absent in MN1-rearranged tumors. Some genetic lesions were relatively specific to AB-like tumor genetic types: MN1-BEND2 fusions and ABCC1 mutation or fusion in MN1-rearranged tumors, and TRIO and KALRN fusions in BRAFV600E tumors. SON mutations span the gamut of patient ages, as does its expression in the AHDT. These presumed somatic mutations were found in tumors clinically presenting at the indicated ages, however this data only indicates that the mutation was acquired in a patient sometime prior to that age, and some could have indeed been germline. Colors are arbitrary in f. In g MN1-BEND2 tumor mutated genes are in red and MAPK-ABC tumor mutated genes are in blue. Source data: Supplementary Data 1 and 2.
Fig. 5
Fig. 5. MN1-BEND2 and MAPK-ABC tumor-associated genes demonstrate fetal age-specific expression and cluster with vRG and oRG marker genes, respectively.
The developmental expression time course of NSC markers and select genes overexpressed or mutated in MN1-BEND2 and MAPK-ABC AB-like tumors was obtained from the Allen Human Developmental Transcriptome database and subjected to unsupervised hierarchical clustering. MN1-BEND2 tumor-associated genes (relatively overexpressed or mutated) are depicted in red and MAPK-ABC tumor associated genes are in blue. Genes associated with NEC, vRG, tRG and oRG are indicated. The x-axis age bar progressive color scheme is arbitrary. Transcript expression is normalized by reads per kilobase of transcript per million mapped reads (RPKM) to compensate for RNAseq generation of more sequencing reads from longer RNA molecules. Data is from up to 16 brain regions from 42 specimens (Allen Human Brain Atlas Developmental Transcriptome, Institute for Brain Science, available from: human.brain-map.org). The figure source data is available in the Source Data File.
Fig. 6
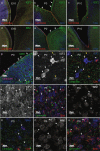
Fig. 6. MN1 and IGF2 are expressed by differentiating ependymal cells in the P0 to P6 mouse ventricular zone.
ag Immunofluorescence stained embryonic (E16), newborn (P0) and postnatal day 10 (P10) mouse brain coronal sections are shown. a, c, d and f In E16 and P10 coronal sections MN1 and IGF2 staining is not apparent. b IGF2 staining is seen in the ventricular zone of the medial and lateral ventricular walls in P0 animal brains (arrows). e MN1 labels immature ependymal cells in the P0 lateral ventricular wall covering the striatum on the right (arrows). The medial wall ependyma are mature and demonstrate multiple centrioles (red) and motile cilia (blue). MN1 staining is not evident in these cells. g High power image of P0 lateral ventricular wall showing green MN1 staining of immature ependymal cell nuclei and cytoplasm (white arrows) and more basally located striatal cells (arrowheads), which could explain the cortical or juxtacortical location of MN1-BEND2 tumors. The pink arrow indicates a more mature differentiating ependymal cell demonstrating multiple centrioles (pink fluorescence). h, i P0 whole mounts of the lateral ventricular wall show IGF2-positive microglia situated on the ependymal surface (arrows). An IGF2-positive, late differentiating ependymal cell with short multiple cilia is indicated by the arrowhead. Earlier stage differentiating ependymal cells with focal IGF2 staining are indicated by yellow arrows. Red circles highlight very early “halo stage” differentiating ependymal cells (i, l), which are IGF2-negative (i). j, k In P6 whole mount lateral wall, IGF2 again stains microglia (arrows) and immature ependyma with short cilia (arrowheads). l, m Mostly unciliated differentiating ependymal cells show MN1 staining in the P0 lateral wall (arrows). Very early halo stage nascent ependyma are MN1-negative (l). n, o In P6 lateral wall, differentiating ependymal cells with few cilia are MN1-positive (arrows). A later differentiating multiciliated ependymal cell is MN1-negative (arrowhead). Experiments were performed twice with equivalent results.
Fig. 7
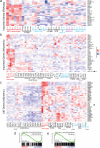
Fig. 7. MN1-BEND2 AB-like tumors exhibit relative overexpression of imprinted genes while MAPK-ABC tumors show relative overexpression of X-inactivation escape genes.
a Heatmap of unsupervised hierarchical clustering of RNAseq expression data for a subset of imprinted genes. b Similar data from the Affymetrix analysis including controls and PXA. c Heatmaps for expression of subsets of XIE genes from the Affymetrix data. IGF2 is absent in the NCBI annotation for the HTA 2.0 array as of April 2021. IGF2-AS (arrow) may serve as a surrogate marker for IGF2 and was upregulated in MN1-rearranged tumors and normal choroid plexus (choroid plxs). The latter develops as an out-pouching of the ependyma and is known to express IGF2. The XIST gene message is indicated by the arrowhead. MN1-rearranged tumors are highlighted in red, MAPK-AB in blue, and MAPK-C in purple. Complete source data for heatmaps are available as Supplementary Fig. 8-9 and 13. d GSEA plot showing enrichment of imprinted gene expression in MN1-BEND2 versus MAPK-ABC tumors. e GSEA plot depicting enrichment of XIE gene expression in MAPK-ABC versus MN1-BEND2 tumors. GSEA is two-sided with adjustment for multiple comparisons. Tumors or control tissues comparatively enriched for neural stem cell gene sets are depicted in larger and bold font. Colors are arbitrary.
Fig. 8
Fig. 8. Astroblastoma-like tumors show neural stem cell type-specific transcriptional lineage of developmentaly early (vRG) to later (oRG and tRG) radial glia and clinically present in comensurate sequencial patient ages.
a Summary of anatomic locations and patient age groups of molecular subtypes of AB-like tumors. b Hypothetical model for EET MN1-BEND2 tumorigenesis. c Hypothetical model for MAPK-ABC astroblastoma tumorigenesis. GSEA and RNA expression patterns of FOXJ1 and IGF2 suggest a temporal progression of early to late vRG to tRG and oRG genes and development of related tumor types: EET MN1-BEND2, FOXJ1+/IGF2+; RELA STE, FOXJ1+/IGF2+; PTPR, FOXJ1+/IGF2−; MAPK-ABC and PXA, FOXJ1−/IGF2.

References

    1. Bailey P, Bucy PC. Astroblastomas of the brain. Acta Psychiatr. Scand. 1930;5:439–461. doi: 10.1111/j.1600-0447.1930.tb08230.x. - DOI
    1. Lehman NL, et al. Morphological and molecular features of astroblastoma, including BRAFV600E mutations, suggest an ontological relationship to other cortical-based gliomas of children and young adults. Neuro Oncol. 2017;19:31–42. doi: 10.1093/neuonc/now118. - DOI - PMC - PubMed
    1. Aldape K. D., Rosenblum M. K. Astroblastoma. In: WHO Classification of Tumours of the Central Nervous System (eds Louis, D. N., Ohgaki, H., Wiestler, O. D. & Cavenee, W. K.). International Agency for Research on Cancer (2016).
    1. Lehman NL, et al. Genomic analysis demonstrates that histologically-defined astroblastomas are molecularly heterogeneous and that tumors with MN1 rearrangement exhibit the most favorable prognosis. Acta Neuropathol. Commun. 2019;7:42. doi: 10.1186/s40478-019-0689-3. - DOI - PMC - PubMed
    1. Mhatre R, et al. MN1 rearrangement in astroblastoma: study of eight cases and review of literature. Brain Tumor Pathol. 2019;36:112–120. doi: 10.1007/s10014-019-00346-x. - DOI - PubMed

Publication types