. 2022 Apr 19;13(1):2139.
doi: 10.1038/s41467-022-29696-5.

Analysis of sub-kilobase chromatin topology reveals nano-scale regulatory interactions with variable dependence on cohesin and CTCF

Affiliations

Analysis of sub-kilobase chromatin topology reveals nano-scale regulatory interactions with variable dependence on cohesin and CTCF

Abrar Aljahani et al. Nat Commun. .

Abstract

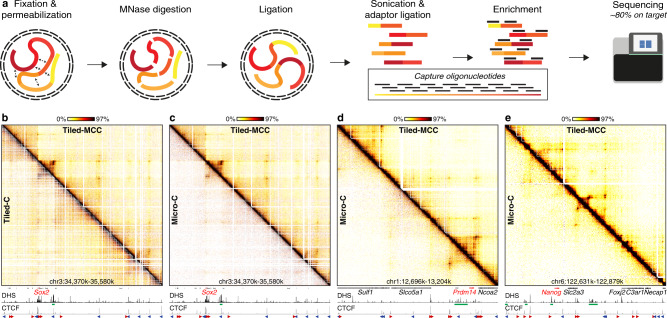
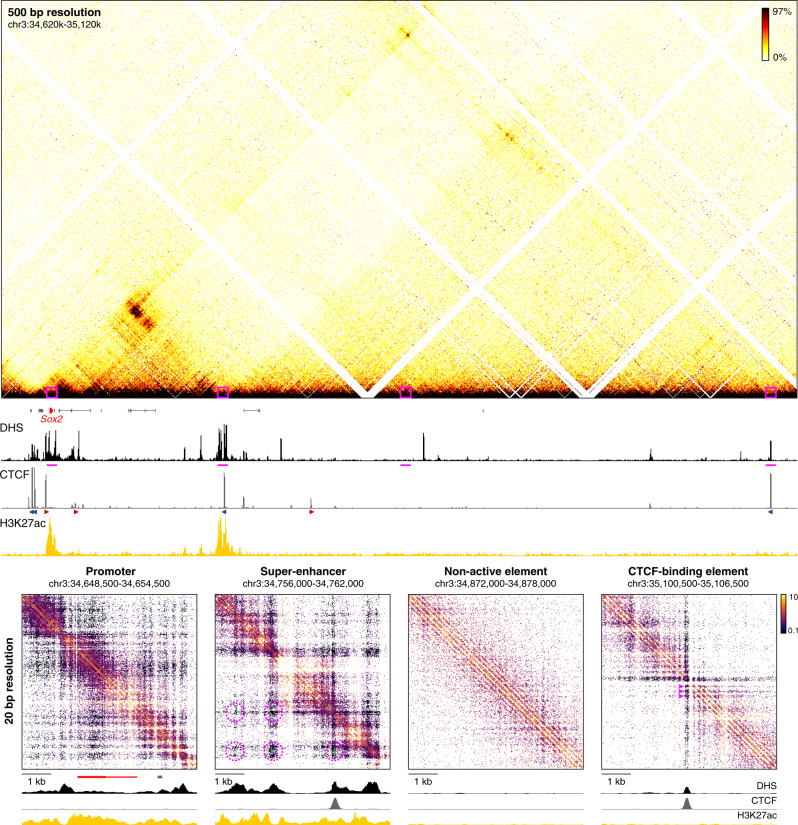
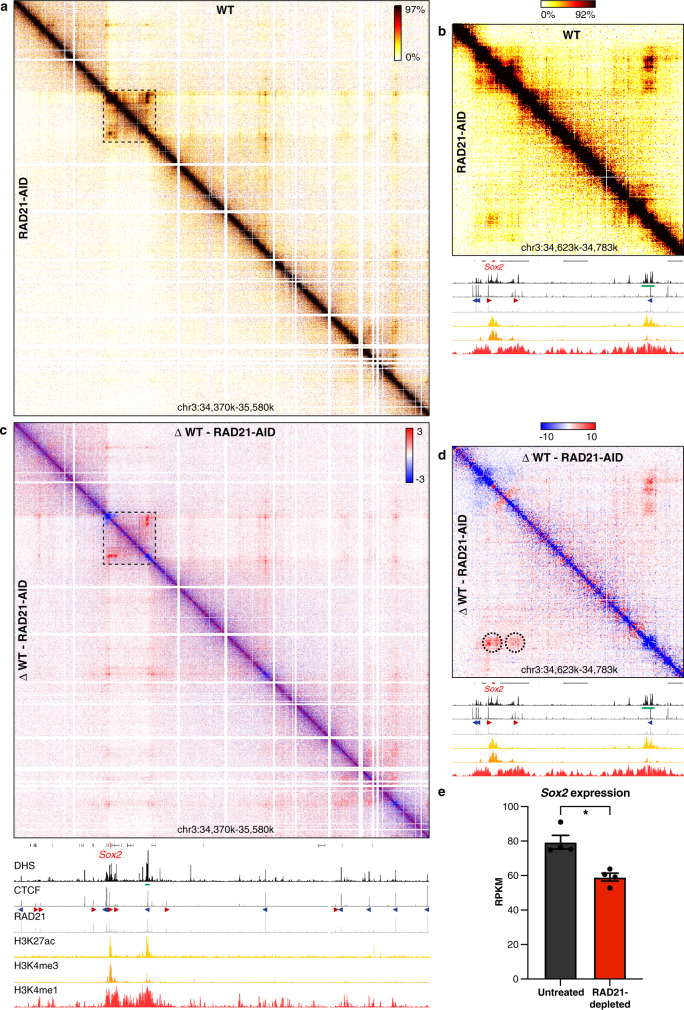
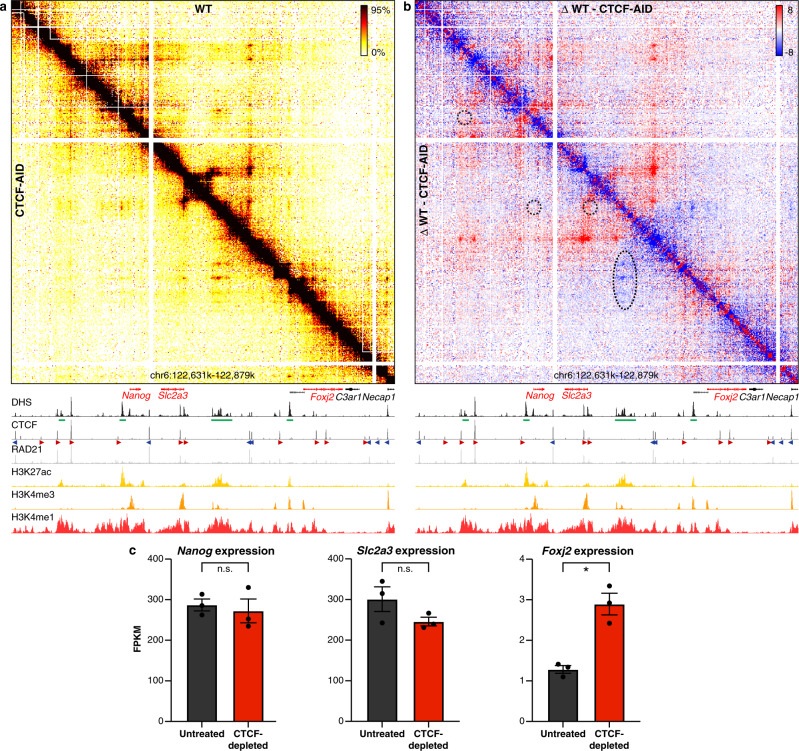
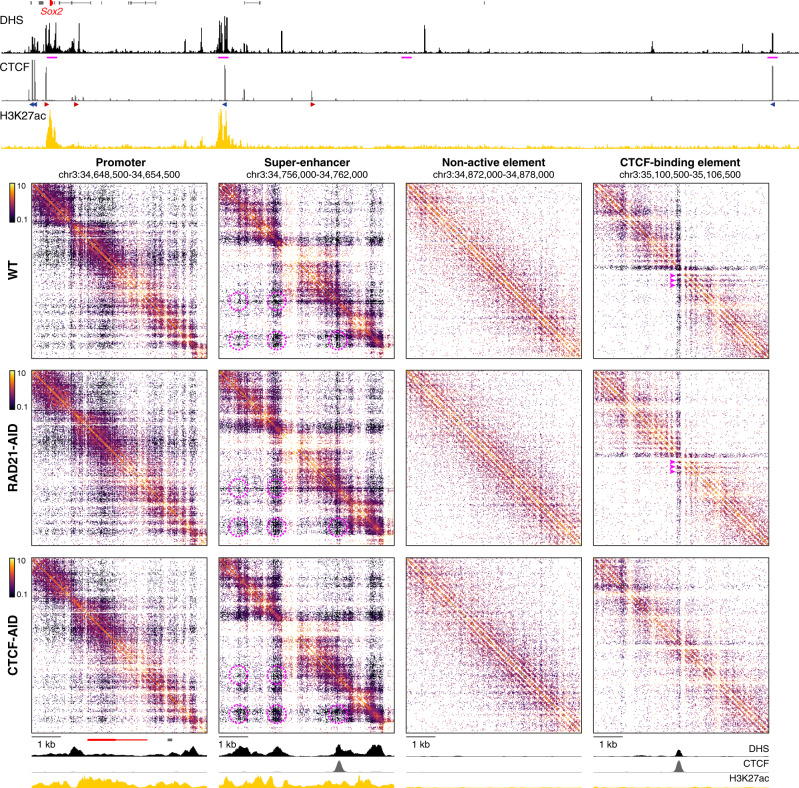
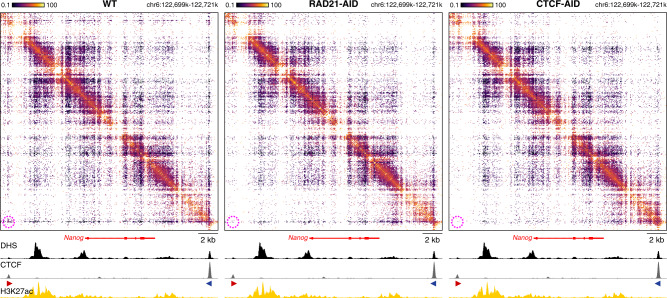
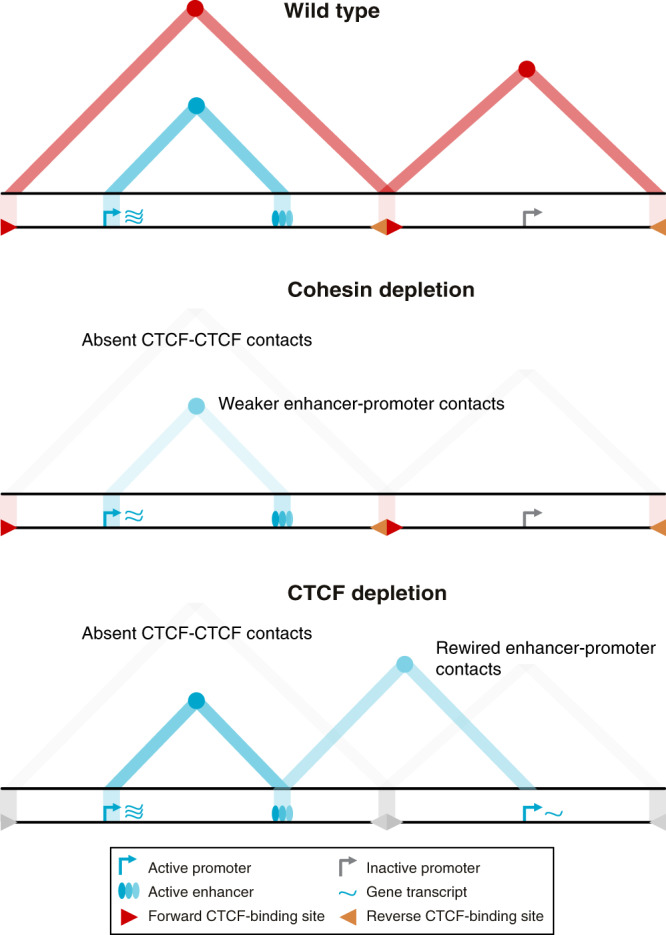
Enhancers and promoters predominantly interact within large-scale topologically associating domains (TADs), which are formed by loop extrusion mediated by cohesin and CTCF. However, it is unclear whether complex chromatin structures exist at sub-kilobase-scale and to what extent fine-scale regulatory interactions depend on loop extrusion. To address these questions, we present an MNase-based chromosome conformation capture (3C) approach, which has enabled us to generate the most detailed local interaction data to date (20 bp resolution) and precisely investigate the effects of cohesin and CTCF depletion on chromatin architecture. Our data reveal that cis-regulatory elements have distinct internal nano-scale structures, within which local insulation is dependent on CTCF, but which are independent of cohesin. In contrast, we find that depletion of cohesin causes a subtle reduction in longer-range enhancer-promoter interactions and that CTCF depletion can cause rewiring of regulatory contacts. Together, our data show that loop extrusion is not essential for enhancer-promoter interactions, but contributes to their robustness and specificity and to precise regulation of gene expression.


Conflict of interest statement

J.O.J.D. is a co-founder of Nucleome Therapeutics and provides consultancy to the company. The remaining authors declare no competing interests.

Figures

Fig. 1
Fig. 1. Tiled-MCC generates local contact matrices with high sensitivity and resolution.
a Overview of the Tiled-MCC procedure. Cells are initially crosslinked with formaldehyde and permeabilized with digitonin. The chromatin is subsequently digested with MNase, which is followed by proximity ligation. After DNA extraction, the MCC libraries are sonicated and ligated with indexed sequencing adaptors. Multiplexed libraries are subsequently enriched for regions of interest using panels of biotinylated capture oligonucleotides, which are optimized for hybridization to MNase-digested 3C libraries, and sequenced. b Comparison of Tiled-MCC (top-right) and Tiled-C (bottom-left) contact matrices at 500 bp resolution of the Sox2 locus in mES cells. ce Comparison of Tiled-MCC (top-right) and Micro-C (bottom-left) contact matrices at 500 bp resolution of the Sox2 (c), Prdm14 (d), and Nanog (e) loci in mES cells. Gene annotation (genes of interest in red, coding genes in black, non-coding genes in gray), DNase hypersensitive sites (DHS), and ChIP-seq data for CTCF are shown below the matrices. The axes of the DHS and CTCF ChIP-seq profiles are scaled to signal and have the following ranges; DHS: Sox2 = 0–4.46, Prdm14 = 0–6.45, Nanog = 0–10.25; CTCF: Sox2 = 0–1833, Prdm14 = 0–2168, Nanog = 0–3092. Enhancers of interest are indicated in green below the DHS profiles. The orientations of CTCF motifs at prominent CTCF-binding sites are indicated by arrowheads (forward orientation in red; reverse orientation in blue).
Fig. 2
Fig. 2. High-resolution analysis of Tiled-MCC ligation junctions identifies micro-topologies of cis-regulatory elements in the Sox2 locus.
The fine-scale contact matrices at the bottom show ligation junctions identified by Tiled-MCC in the Sox2 locus at 20 bp resolution. A large-scale contact matrix (500 bp resolution), gene annotation (Sox2 in red, coding genes in black, non-coding genes in gray), DNase hypersensitive sites (DHS), and ChIP-seq data for CTCF and H3K27ac for the extended Sox2 locus are shown in the top panels. The 6 kb regions covered in the fine-scale contact matrices are highlighted with magenta boxes in the contact matrix at the top and with magenta bars below the top DHS profile, and show a promoter, super-enhancer, non-active element, and CTCF-binding element. The axes of the top and bottom DHS and ChIP-seq profiles for CTCF and H3K27ac are fixed and have the following ranges: DHS = 0–5; CTCF = 0–1500; H3K27ac = 0–50. The orientations of CTCF motifs at prominent CTCF-binding sites are indicated by arrowheads (forward orientation in red; reverse orientation in blue). The magenta highlights in the contact matrix covering the super-enhancer indicate enriched interactions between DHSs; the magenta highlights in the contact matrix covering the CTCF-binding element indicate phased nucleosomes.
Fig. 3
Fig. 3. Cohesin depletion results in reduced enhancer–promoter interactions in the Sox2 locus.
a Tiled-MCC contact matrices of the Sox2 locus in wild-type (WT) mES cells (top-right) and auxin-treated RAD21-AID mES cells (bottom-left) at 500 bp resolution. b Zoomed view of the dashed region in a to highlight the interactions between the Sox2 promoter and its super-enhancer. c Differential contact matrix of the Sox2 locus in which interactions enriched in WT mES cells are indicated in red and interactions enriched in auxin-treated RAD21-AID mES cells are indicated in blue. d Zoomed view of the dashed region in c to highlight the interactions between the Sox2 promoter and its super-enhancer. ad Gene annotation (Sox2 in red, coding genes in black, non-coding genes in gray), DNase hypersensitive sites (DHS), and ChIP-seq data for CTCF, Cohesin (RAD21), H3K27ac, H3K4me3, and H3K4me1 are shown below the matrices. The axes of the DHS and ChIP-seq profiles below a and c are scaled to signal and have the following ranges: DHS = 0–4.46; CTCF = 0–1833; RAD21 = 0–3318; H3K27ac = 0–48; H3K4me3 = 0–82; H3K4me1 = 0–1826. The axes of the DHS and ChIP-seq profiles below b, d have the same ranges as in a and c, except for the CTCF ChIP-seq profile, which is scaled 0–300. Enhancers of interest are indicated in green below the DHS profiles. The orientations of CTCF motifs at prominent CTCF-binding sites are indicated by arrowheads (forward orientation in red; reverse orientation in blue). Interactions of interest are highlighted with dashed circles in d, with the left circle indicating the interactions between the Sox2 promoter and its super-enhancer, and the right circle indicating the interactions between CTCF-binding sites downstream of the promoter and the super-enhancer, which also contains a CTCF-binding site. These interactions are decreased upon cohesin depletion. e Expression of Sox2 in untreated (left) and auxin-treated (right) RAD21-AID mES cells, derived from RNA-seq data, normalized for reads per kilobase of the transcript, per million mapped reads (RPKM). The bars represent the average of n = 4 replicates and the error bars indicate the standard error of the mean. *P = 4.46E-07 (calculated using DESeq2 analysis and adjusted for multiple comparisons, as previously decribed). Source data are provided as a Source Data file.
Fig. 4
Fig. 4. CTCF depletion results in ectopic enhancer–promoter interactions in the Nanog locus.
a Tiled-MCC contact matrices of the Nanog locus in wild-type mES cells (top-right) and auxin-treated CTCF-AID mES cells (bottom-left) at 500 bp resolution. b Differential contact matrix of the Nanog locus in which interactions enriched in WT mES cells are indicated in red and interactions enriched in auxin-treated CTCF-AID mES cells are indicated in blue. ab Gene annotation (genes of interest in red, coding genes in black, non-coding genes in gray), DNase hypersensitive sites (DHS), and ChIP-seq data for CTCF, Cohesin (RAD21), H3K27ac, H3K4me3, and H3K4me1 are shown below the matrices. The axes of the DHS and ChIP-seq profiles are scaled to signal and have the following ranges: DHS = 0–10.25; CTCF = 0–3092; RAD21 = 0–3414; H3K27ac = 0–58; H3K4me3 = 0–90; H3K4me1 = 0–2064. Enhancers of interest are indicated in green below the DHS profiles. The orientations of CTCF motifs at prominent CTCF-binding sites are indicated by arrowheads (forward orientation in red; reverse orientation in blue). The dashed circles and oval in b highlight the following interactions of interest (from left to right): Nanog promoter and far upstream enhancer; Nanog promoter and downstream super-enhancer; Slc2a3 promoter and downstream super-enhancer; Foxj2 proximal cis-regulatory elements and upstream super-enhancer. The interactions between the Nanog and Slc2a3 promoters with the enhancers in the region appear unchanged upon CTCF depletion (despite the loss of CTCF-mediated interactions directly upstream of the Slc2a3 promoter), whereas the interactions between the proximal cis-regulatory elements of Foxj2 and the super-enhancer are increased. c Expression of Nanog, Slc2a3, and Foxj2 in untreated (left) and auxin-treated (right) CTCF-AID mES cells, derived from RNA-seq data, normalized for fragments per kilobase of the transcript, per million mapped reads (FPKM). The bars represent the average of n = 3 replicates and the error bars indicate the standard error of the mean. Significant (*) and non-significant (n.s.) changes in expression are indicated. Nanog: P = 0.7030; Slc2a3: P = 0.1774; Foxj2: P = 0.0001 (calculated using Cuffdiff analysis and adjusted for multiple comparisons, as previously decribed). Source data are provided as a Source Data file.
Fig. 5
Fig. 5. Micro-topologies of cis-regulatory elements in the Sox2 locus and their variable dependence on cohesin and CTCF.
The contact matrices show ligation junctions identified by Tiled-MCC in the Sox2 locus at 20 bp resolution in wild-type (WT), auxin-treated RAD21-AID, and auxin-treated CTCF-AID mES cells. Gene annotation (Sox2 in red, coding genes in black, non-coding genes in gray), DNase hypersensitive sites (DHS), and ChIP-seq data for CTCF and H3K27ac for the extended Sox2 locus are shown above the matrices. The 6 kb regions covered in the contact matrices are highlighted with magenta bars below the top DHS profile, and show a gene promoter, super-enhancer, non-active element, and CTCF-binding element. The axes of the top and bottom DHS and ChIP-seq profiles for CTCF and H3K27ac are fixed and have the following ranges: DHS = 0–5; CTCF = 0–1500; H3K27ac = 0–50. The orientations of CTCF motifs at prominent CTCF-binding sites are indicated in the top panel by arrowheads (forward orientation in red; reverse orientation in blue). The magenta highlights in the contact matrices covering the super-enhancer indicate enriched interactions between DHSs; the magenta highlights in the contact matrices covering the CTCF-binding element indicate phased nucleosomes.
Fig. 6
Fig. 6. Micro-topologies of the Nanog locus upon cohesin and CTCF depletion.
The contact matrices show ligation junctions identified by Tiled-MCC in a 22 kb region containing the Nanog locus at 50 bp resolution in wild-type (WT), auxin-treated RAD21-AID, and auxin-treated CTCF-AID mES cells. Gene annotation, DNase hypersensitive sites (DHS), and ChIP-seq data for CTCF and H3K27ac are shown below the matrices. The axes of the DHS and ChIP-seq profiles for CTCF and H3K27ac are fixed and have the following ranges: DHS = 0–5; CTCF = 0–1500; H3K27ac = 0–50. The orientations of CTCF motifs at prominent CTCF-binding sites are indicated by arrowheads (forward orientation in red; reverse orientation in blue). The magenta highlights in the contact matrices indicate enriched interactions between CTCF-binding elements in WT mES cells, which are decreased in auxin-treated RAD21-AID and auxin-treated CTCF-AID mES cells.
Fig. 7
Fig. 7. Graphical summary.
The top panel shows topologically associating domains (TADs; red triangles), interactions between their CTCF boundaries (red circles at the apexes of the TADs), and enhancer–promoter interactions (blue circle at the intersection between the active promoter and enhancer, as indicated with the light blue triangle) for a hypothetical region of the genome in wild-type cells. Upon cohesin depletion (middle panel), TADs are weakened, interactions between CTCF-binding elements are lost, and interactions between active enhancers and promoters are decreased, causing small changes in gene expression. Depletion of the CTCF protein (bottom panel) causes a loss of TADs and CTCF-mediated interactions but does not generally reduce enhancer–promoter interactions. Depending on the context, however, CTCF depletion can result in the formation of ectopic enhancer–promoter interactions and changes in gene expression.

References

    1. Long HK, Prescott SL, Wysocka J. Ever-changing landscapes: transcriptional enhancers in development and evolution. Cell. 2016;167:1170–1187. doi: 10.1016/j.cell.2016.09.018. - DOI - PMC - PubMed
    1. Oudelaar AM, Higgs DR. The relationship between genome structure and function. Nat. Rev. Genet. 2021;22:154–168. doi: 10.1038/s41576-020-00303-x. - DOI - PubMed
    1. Mirny, L. & Dekker, J. Mechanisms of chromosome folding and nuclear organization: their interplay and open questions. Cold Spring Harb. Perspect. Biol. a040147 (2021). - PMC - PubMed
    1. Lieberman-Aiden E, et al. Comprehensive mapping of long-range interactions reveals folding principles of the human genome. Science. 2009;326:289–293. doi: 10.1126/science.1181369. - DOI - PMC - PubMed
    1. Dixon JR, et al. Topological domains in mammalian genomes identified by analysis of chromatin interactions. Nature. 2012;485:376–380. doi: 10.1038/nature11082. - DOI - PMC - PubMed

Publication types

MeSH terms