Meta-Analysis
. 2022 Apr 19;13(1):2020.
doi: 10.1038/s41467-022-29588-8.

Generation of human islet cell type-specific identity genesets

Affiliations
Meta-Analysis

Generation of human islet cell type-specific identity genesets

Léon van Gurp et al. Nat Commun. .

Erratum in

Abstract

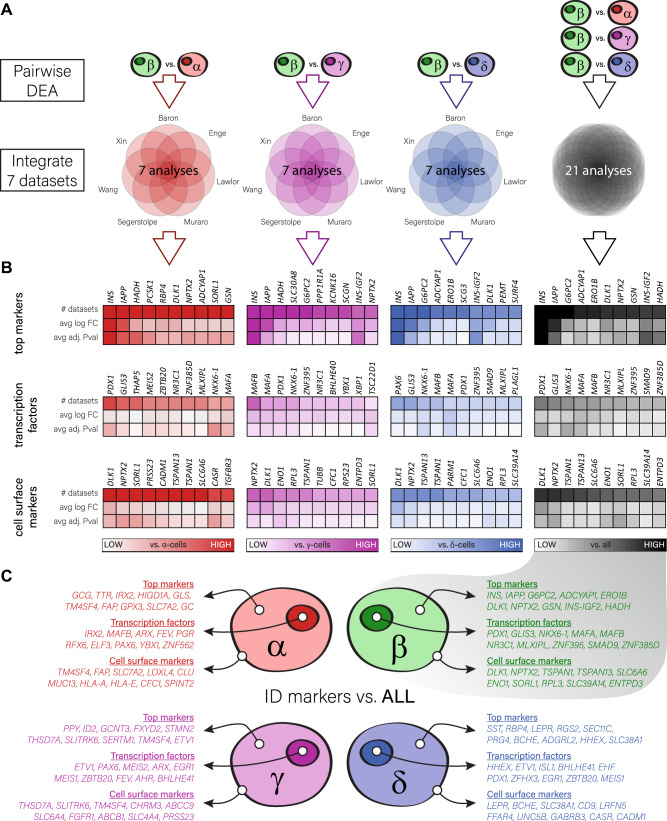
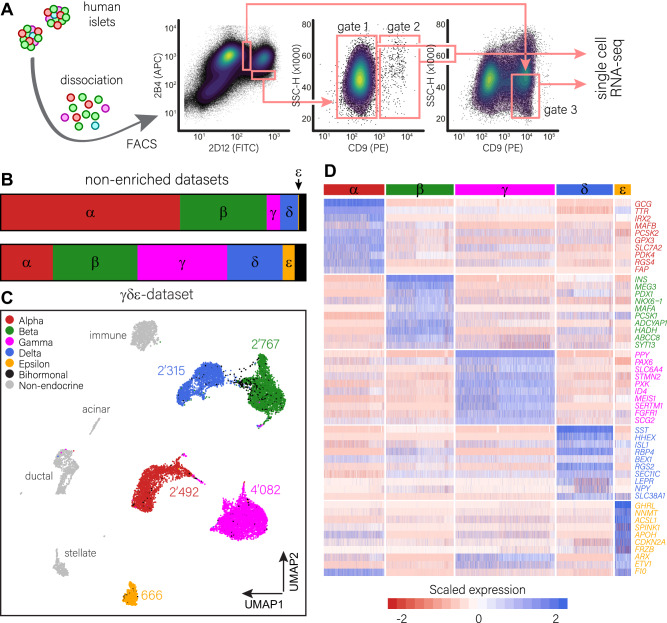
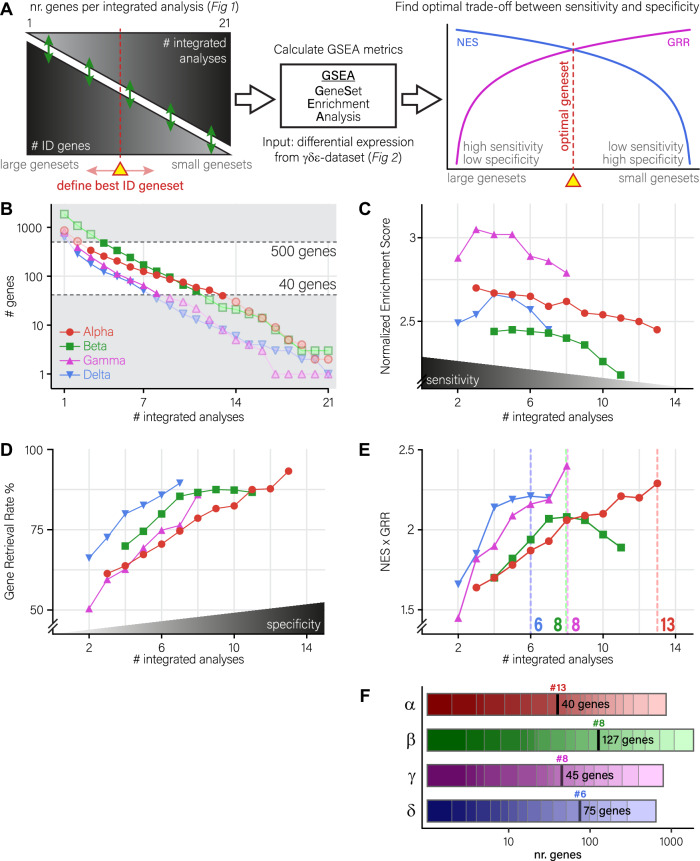
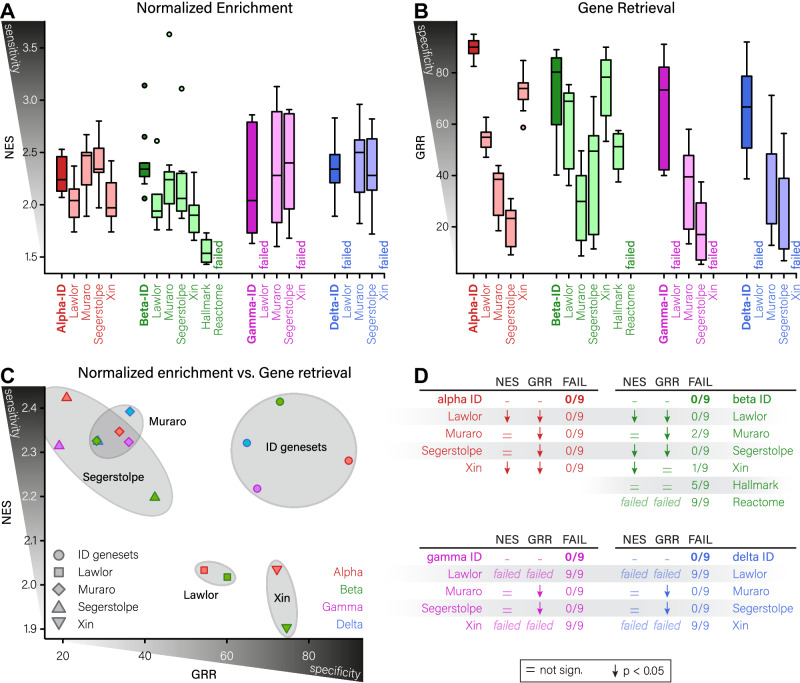
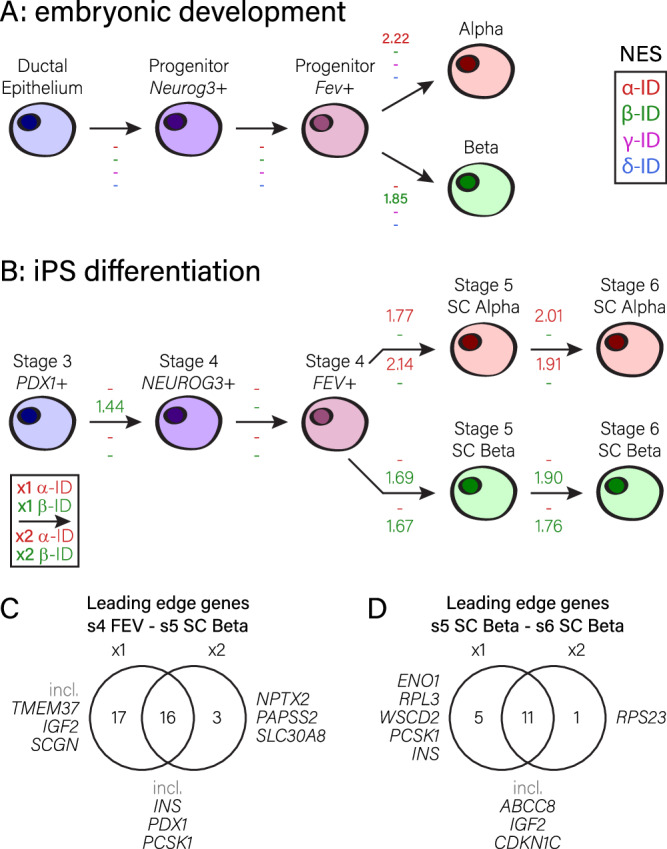
Generation of surrogate cells with stable functional identities is crucial for developing cell-based therapies. Efforts to produce insulin-secreting replacement cells to treat diabetes require reliable tools to assess islet cellular identity. Here, we conduct a thorough single-cell transcriptomics meta-analysis to identify robustly expressed markers used to build genesets describing the identity of human α-, β-, γ- and δ-cells. These genesets define islet cellular identities better than previously published genesets. We show their efficacy to outline cell identity changes and unravel some of their underlying genetic mechanisms, whether during embryonic pancreas development or in experimental setups aiming at developing glucose-responsive insulin-secreting cells, such as pluripotent stem-cell differentiation or in adult islet cell reprogramming protocols. These islet cell type-specific genesets represent valuable tools that accurately benchmark gain and loss in islet cell identity traits.


Conflict of interest statement

The authors declare no competing interests.

Figures

Fig. 1
Fig. 1. Generation of islet cell type-specific genesets by intersecting differentially expressed genes from independent single-cell transcriptomics datasets.
A Differential expression was calculated in seven independent datasets in a pair-wise manner between all cell types (α vs. β, α vs. γ, α vs. δ, β vs. γ, β vs. δ, γ vs. δ) using either the negbinom test on UMI based data (Baron, Muraro) or the MAST test. Then, data from all seven datasets were integrated for a direct comparison between cell types, and in a combined manner to elucidate general cell type-specific identity genes. B Top differentially expressed genes, top transcription factors and top genes that encode cell-surface proteins that characterize β-cells, in direct comparisons to α-, γ- and δ-cells (in red, magenta and blue, respectively), and in a combined manner to define general β-cell identity genes (in black). Genes were ordered first on the number of analyses in which they were found to be differentially expressed, then based on a rank score that comprised both the Bonferroni corrected p-value and the log fold-change. Darker colours indicate a higher number of analyses, a higher log fold-change or a more significant adjusted p-value. C An overview of the top 10 identity markers, top 10 transcription factors and top 10 cell surface encoding genes, per cell type. α-cell identity genes in red, β-cell identity genes in green, γ-cell identity genes in magenta and δ-cell identity genes in blue. Source data are provided in the supplemental tables and as a source data file.
Fig. 2
Fig. 2. Generation and validation of a single-cell transcriptomics dataset enriched for γ-, δ- and ε-cells.
A Strategy for the enrichment of human γ-, δ- and ε-cells. Dissociated human islets were labelled with cell-surface antibodies and the different fractions were processed and collected as described. Cells from gate 2 were complemented with cells from gate 1 to 15,000 cells (γ/ε fraction). The δ-fraction of 15,000 cells was collected in gate 3. B Compared to the unsupervised islet cell collection used to produce non-enriched datasets, our dataset contains smaller fractions of α- and β-cells but larger fractions of γ-, δ- and ε-cells. C UMAP dimensional reduction representation of the final dataset. Cells are colour-coded based on their identity. Populations of α-, β-, γ- and δ- cells each contain thousands of cells, while the ε-cell fraction contains hundreds of cells. D Heatmap showing a representative selection of manually selected identity markers for each of the cell types. Low expression levels are marked in red, high expression in blue. The colour bar above indicates the specific populations: α-cells (red), β-cells (green), γ-cells (magenta), δ-cells (blue) and ε-cells (orange). Source data are provided in the supplemental tables and as a source data file.
Fig. 3
Fig. 3. Generation of islet cell type-specific identity genesets.
A Methodology to determine the optimal genesets from our lists of identity genes. First, 21 incrementally smaller genesets were generated per cell type, including genes with an increasingly higher number of integrated analyses. To define the best identity geneset, we used GSEA to generate normalized enrichment scores (NES; proxy for geneset sensitivity) and gene retrieval rates (GRR; proxy for geneset specificity) based on differential expression in our γδε-dataset. The optimal geneset was defined as the geneset with the highest combined NES/GRR metrics. B Geneset sizes for each cell type, regarding every possible intersect level. Genesets were filtered to contain between 40 and 500 genes (darker colours). Genesets outside this range (lighter colours) were not considered for downstream evaluation. C Mean sensitivity score (normalized enrichment; n = 3 independent experiments) for each geneset for each cell type. D Mean specificity score (gene retrieval rate; n = 3 independent experiments) for each geneset for each cell type. E Multiplication of NES and GRR scores (n = 3 independent experiments) for each geneset for each cell type. Per cell type, the highest measured value is indicated by a dotted line, and the appropriate number of integrated analyses is indicated on the x-axis. Genesets were defined to include all genes with at least this amount of integrated analyses, resulting in genesets sizes as indicated in the top left corner. F Determination of final geneset sizes by applying the determined # integrated analyses on the lists of ID genes generated in Fig. 1. For each cell type, the determined cut-off is indicted as a thick black line, numbers indicated with a # indicate the cut-off value determined in panel (E). α-, β-, γ- and δ-cell genesets in red, green, magenta and blue, respectively. Source data are provided as a source data file.
Fig. 4
Fig. 4. Evaluation of identity genesets reveals superior on- and off-target scoring compared to previously published ID lists.
A, B Box plots of normalized enrichment (sensitivity; A) and Gene Retrieval Rate (specificity; B) for our islet cell type-specific ID genesets compared to previously published ID lists, using three independent datasets for evaluation (n = 9 per condition). Box plots are colour-coded per cell type (α-, β-, γ- and δ-cells in red, green, magenta and blue, respectively), and distribution follows standard boxplot formatting as min-Q1-median-Q3-max, with individual dots marking outliers. Darker colours indicate our ID genesets. C Scatterplot indicating the relation between NES/sensitivity and GRR/specificity for the different ID genesets. Larger genesets from the Muraro and Segerstolpe datasets score well on sensitivity at the expense of GRR/specificity. The smaller genesets from the Lawlor and Xin datasets are more specific, at the expense of sensitivity. In our ID genesets, we have managed to optimize the trade-off between sensitivity and specificity. Dots are colour coded per cell type (α-cells in red, β-cells in green, γ-cells in magenta, δ-cells in blue) and shaped per dataset. D statistics for on-target, off-target and evaluation metric scoring. Comparisons were made using Wilcoxon signed-rank test; = indicates no significant difference compared to our ID genesets, ↓ indicates a significantly lower score compared to our ID genesets, ‘failed’ indicates all analyses for this geneset failed. NES normalized enrichment score, GRR gene retrieval rate, FAIL number of geneset analyses that did not produce output. Source data are provided as a source data file.
Fig. 5
Fig. 5. Assessing plasticity in α- and β-cell identity during embryonic development, pluripotent cell differentiation, cell type interconversion and in diabetes.
Changes in α-, β-, γ- and δ-cell identity were measured between states during murine embryonic pancreas development (A) and in different human ES/iPS cell differentiation protocols (x1 and x2; B). Arrows indicate progression. Values in red, green, magenta and blue indicate normalized enrichment scores from GSEA for α-ID, β-ID, γ-ID and δ-ID genesets, where positive values indicate a gain in identity and negative values indicate a loss of identity; scores indicated by – are not significant (FDR higher than 0.05). C, D Venn diagrams indicating differences in leading-edge genes (genes responsible for the correlation between a geneset and the observed increase in β-cell identity) between the x1 and x2 protocols. Differences in leading-edge genes from stage 4 FEV expressing cells to stage 5 SC-β cells (C) and from stage 5 to stage 6 SC-β cells (D).

References

    1. Collombat P, et al. Opposing actions of Arx and Pax4 in endocrine pancreas development. Genes Dev. 2003;17:2591–2603. doi: 10.1101/gad.269003. - DOI - PMC - PubMed
    1. van der Meulen T, Huising MO. Role of transcription factors in the transdifferentiation of pancreatic islet cells. J. Mol. Endocrinol. 2015;54:R103–R117. doi: 10.1530/JME-14-0290. - DOI - PMC - PubMed
    1. Fu Z, Gilbert ER, Liu D. Regulation of insulin synthesis and secretion and pancreatic Beta-cell dysfunction in diabetes. Curr. Diabetes Rev. 2013;9:25–53. doi: 10.2174/157339913804143225. - DOI - PMC - PubMed
    1. Grun D, van Oudenaarden A. Design and analysis of single-cell sequencing experiments. Cell. 2015;163:799–810. doi: 10.1016/j.cell.2015.10.039. - DOI - PubMed
    1. Tang F, et al. mRNA-Seq whole-transcriptome analysis of a single cell. Nat. Methods. 2009;6:377–382. doi: 10.1038/nmeth.1315. - DOI - PubMed

Publication types