. 2022 Apr 19;13(1):2022.
doi: 10.1038/s41467-022-29701-x.

Loss of vascular endothelial notch signaling promotes spontaneous formation of tertiary lymphoid structures

Affiliations

Loss of vascular endothelial notch signaling promotes spontaneous formation of tertiary lymphoid structures

Susanne Fleig et al. Nat Commun. .

Abstract

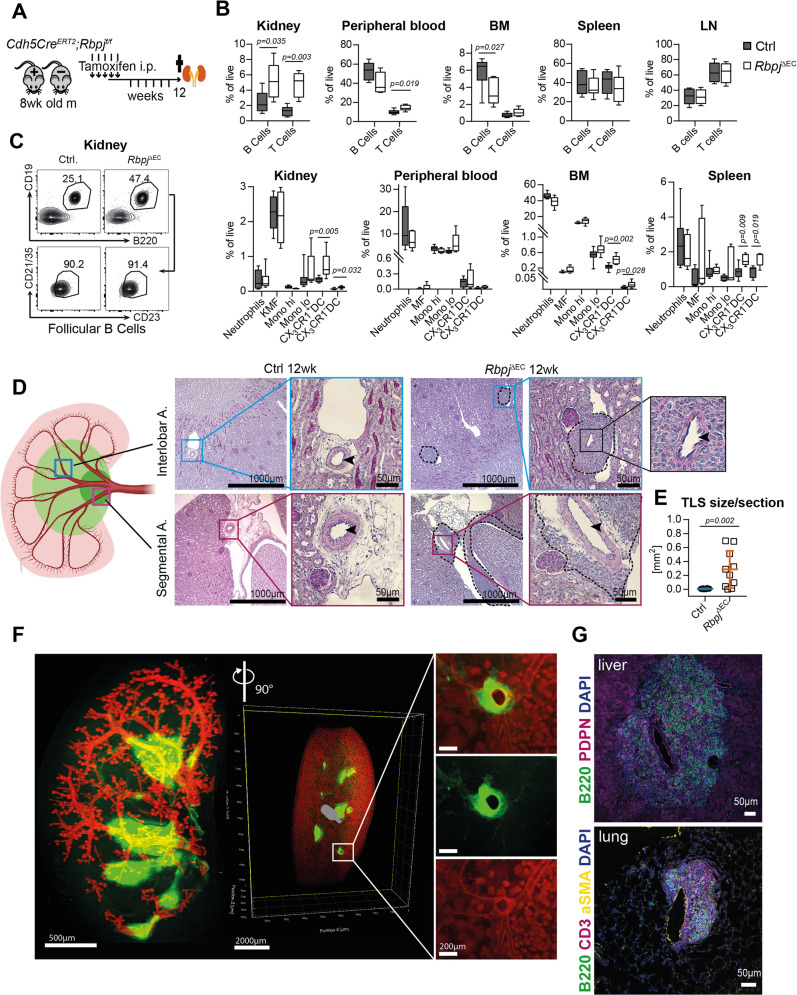
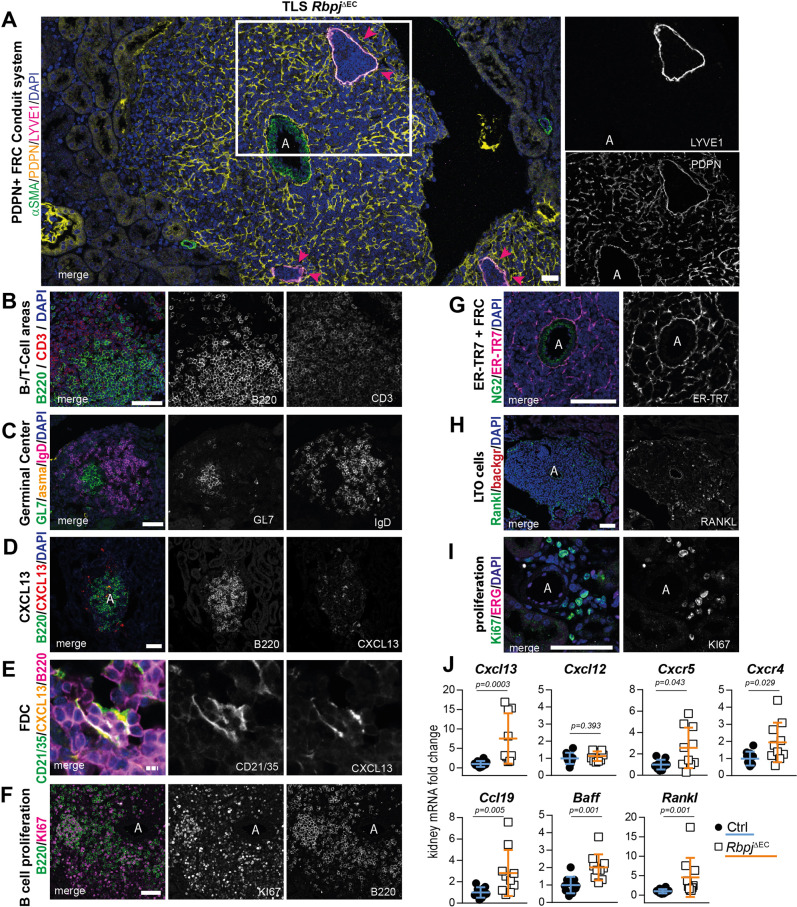
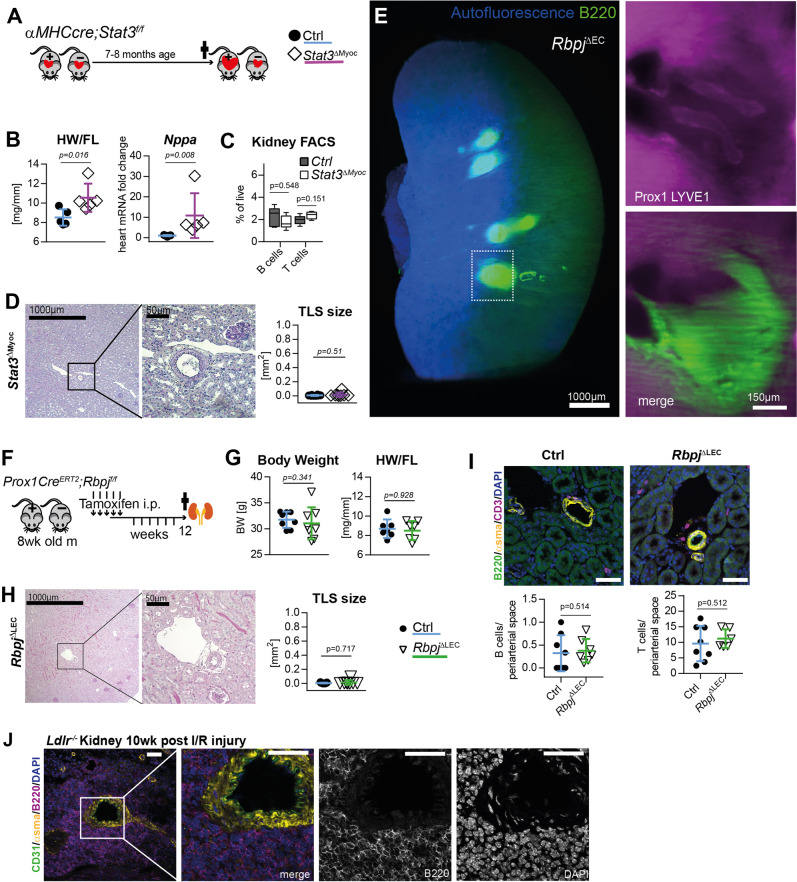
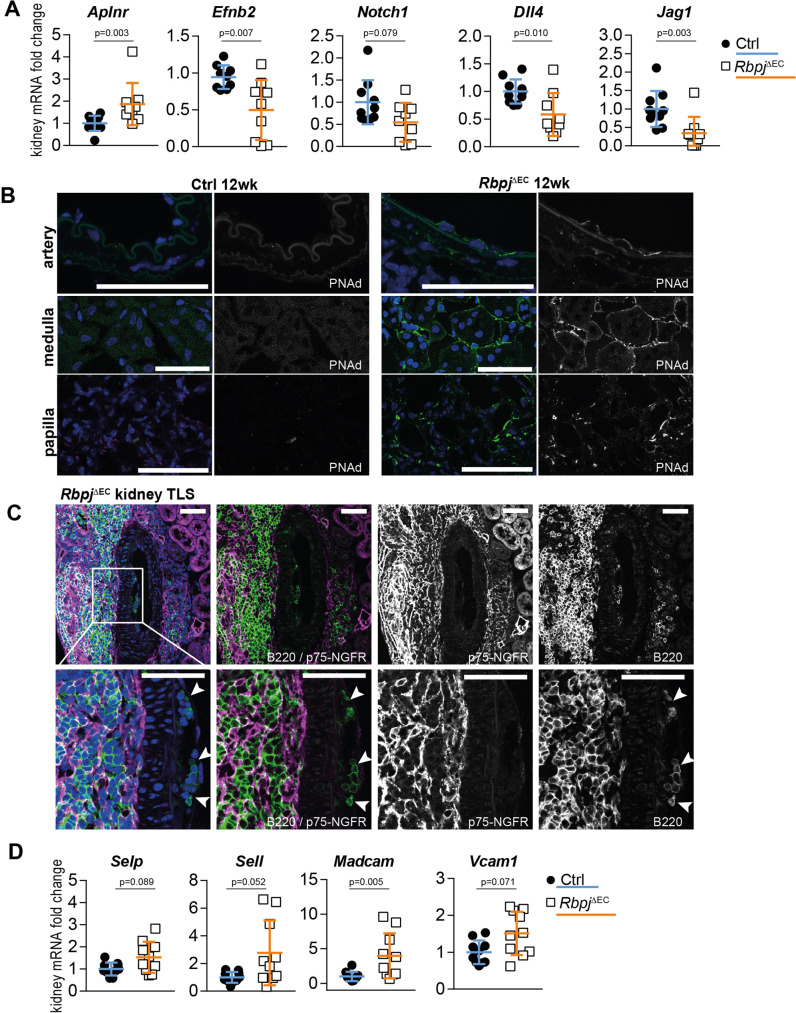
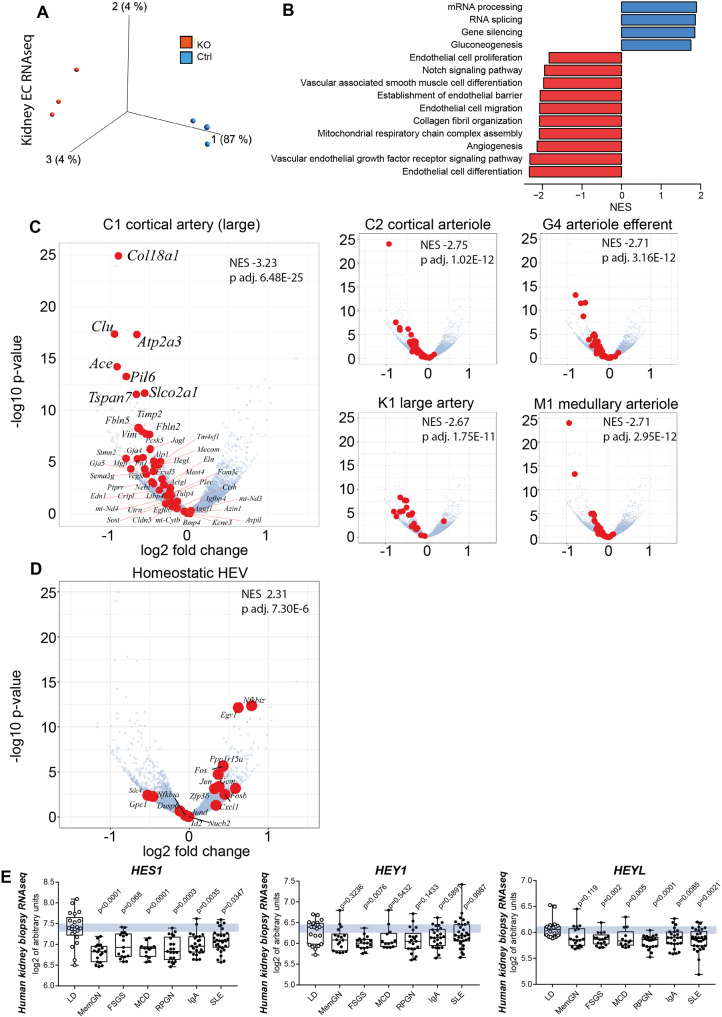
Tertiary lymphoid structures (TLS) are lymph node-like immune cell clusters that emerge during chronic inflammation in non-lymphoid organs like the kidney, but their origin remains not well understood. Here we show, using conditional deletion strategies of the canonical Notch signaling mediator Rbpj, that loss of endothelial Notch signaling in adult mice induces the spontaneous formation of bona fide TLS in the kidney, liver and lung, based on molecular, cellular and structural criteria. These TLS form in a stereotypical manner around parenchymal arteries, while secondary lymphoid structures remained largely unchanged. This effect is mediated by endothelium of blood vessels, but not lymphatics, since a lymphatic endothelial-specific targeting strategy did not result in TLS formation, and involves loss of arterial specification and concomitant acquisition of a high endothelial cell phenotype, as shown by transcriptional analysis of kidney endothelial cells. This indicates a so far unrecognized role for vascular endothelial cells and Notch signaling in TLS initiation.


Conflict of interest statement

The authors declare no competing interests.

Figures

Fig. 1
Fig. 1. Spontaneous periarterial formation of TLS in conditional endothelial Rbpj mutant mice.
A Induction protocol for Cdh5CreERT2; Rbpjfl/fl mice and Cre-negative littermates. B Flow cytometry, % of live cells, box plots with mean, 25–75th percentile (Inter-Quartile-Range, IQR, bounds of box) and total range (min-max, whiskers); Mann–Whitney test, two-tailed. CTRL n = 9, KO n = 6 mice; 3 independent experiments. C Flow cytometry representative plots for % follicular B lymphocytes in Ctrl and RbpjΔEC kidneys. Numbers indicate % of live CD45 + (upper panel)/% of CD45+/CD19+ cells (lower panel). D PAS staining of representative paraffin-embedded kidney sections in different arterial segments (sketch on left created with biorender.com). Upper row, interlobar arteries, lower row segmental arteries, magnification ×50 (overview, bar = 1000 µm) and boxed details magnification ×200 (bar = 50 µm). Inset: arterial lumen (arrowhead) within TLS structure. Experiment independently repeated with similar results >×3. E Quantification of infiltrated area [in mm2] per transversal kidney cross-section (sum of all infiltrated areas per section). N = 10 mice per group, Mann–Whitney test, two-tailed, exact p-value 0.0021; Graph: Scatter dot blot, mean, standard deviation (SD). **p < 0.01. F Whole-mount kidney staining and light sheet imaging of CD31 (red) and B220 (green) of RbpjΔEC kidney; 3D reconstruction with IMARIS software; ventral view left with a filter for larger vascular structures; sagittal view middle and right, with magnification of inset. Representative image, kidneys of n = 3 mice were stained. G Representative images of IF stained liver (upper) and lung (lower image) TLS in RbpjΔEC mice, B220 positive cells in green. Organs of n = 3 mice were stained with similar results. Scale bars as marked. Source data are provided as a Source Data file.
Fig. 2
Fig. 2. Molecular, cellular and structural composition of periarterial TLS.
AI Immunofluorescence staining and confocal laser scanning microscopy of representative RbpjΔEC kidney samples, merged and single channels as indicated. “A” indicates artery. Optical Magnification 200x; different scan areas (see scale bars). Scale: solid bar 50 µm, dotted bar 10 µm (2E). Each micrograph is representative of at least 4 biological replicates. J Whole kidney mRNA expression, relative fold change to control gene Rps9, n = 10/group. Graphs: Scatter dot blot, mean, SD (whiskers). Mann–Whitney test, two-tailed, Exact p-values: Cxcl13, p = 0.0003; Cxcl12, p = 0.393; Cxcr5, p = 0.0433; Cxcr4, p = 0.0288; Ccl19, p = 0.0052; Baff, p = 0.0007; Rankl, p = 0.0005. Source data are provided as a Source Data file.
Fig. 3
Fig. 3. TLS formation in models of heart failure, conditional lymphatic-EC deletion of Rbpj or kidney ischemia reperfusion.
A Experimental set up for analysis of cardiomyocyte restricted deletion of Stat3 (Stat3ΔMyoc). B Heart weight to femur length ratio (HW/FL, p = 0.0159) and cardiac ANP (Nppa) mRNA expression, p = 0.0079; CTRL n = 5, KO n = 5. Mann–Whitney test, 2-tailed, Graphs: Scatter dot blot, Mean, SD (whiskers). C Quantification by lymphocytes by flow cytometry of kidney homogenates; % of live cells, box plots with mean, IQR (25–75%, bounds of box) and total range (min-max: whiskers); CTRL n = 5, KO n = 5. D PAS staining of representative, paraffin-embedded kidney sections. Quantification of infiltrated area [in mm2] per transversal kidney cross-section (sum of all infiltrated areas per section), N = 8 biological replicates per group, Mann–Whitney test, two-tailed, p = 0.51. Graph: Scatter dot blot, Mean, SD (whiskers). E RbpjΔEC Whole kidney staining for B220 (TLS) and Prox1/Lyve1 for lymphatic collecting vessels, light sheet microscopy, ventral view, 3D reconstruction via IMARIS software; scale bar: left image 1000 µm; insets are magnifications of boxed detail, scale bar 150 µm. Exemplary image, kidneys from N = 3 mice stained. F Induction protocol for lymphatic endothelial-restricted deletion of Rbpj (RbpjΔLEC). G Body weight (n = 8/group, p = 0.3409) and heart weight to femur length ratio (n = 7/group, p = 0.9272) in 20–22-week-old mice (12 week after KO induction, from two independent experiments); Graphs: Scatter dot blot, mean (box), SD (whiskers). Mann–Whitney test, two-tailed. H Paraffin-embedded kidney sections, PAS staining, optical magnification: ×50 left, ×200 detail, scale bar: 1000 µm and 50 µm, as indicated. Quantification of infiltrated area [in mm2] per transversal kidney cross-section (sum of all infiltrated areas per section), N = 11 CTRL, N = 8 RbpjΔLEC mice per group, Mann–Whitney test, two-tailed, p = 0.7168. Graph: Scatter dot blot, mean (box), SD (whiskers). I Upper panels: immunofluorescence staining, optical magnification: 200x, scale bar: 50 µm. Lower panels: quantification of periarterial B and T cells per microscopic image (each value = mean #cells per periarterial area of all such areas per one cross-section). CTRL n = 8, KO n = 7 mice analyzed from 2 independent experiments, Mann–Whitney test, 2-tailed. Graphs: Scatter dot blot, mean (box), SD (whiskers). J Immunofluorescence staining as indicated and confocal laser scanning microscopy of kidney 11 weeks after ischemia reperfusion (I/R) injury, optical magnification ×200, scale bar: 50 µm; see also Supplementary Fig. 4; representative picture; n = 3 animals in I/R-injury group. Source data are provided as a Source Data file.
Fig. 4
Fig. 4. Endothelial signatures in TLS development.
A Whole kidney mRNA expression, n = 10 mice per group from 2 independent experiments, Mann–Whitney test, two-tailed. Exact p-values: Aplnr, p = 0.003; Efnb2, p = 0.0068; Notch1, p = 0.0789; Dll4, p = 0.0101; Jag1, p = 0.0033; Graphs: scatter dot blot, mean, SD (whiskers). B Immunofluorescence staining and confocal microscopy of RbpjΔEC kidney sections. Segmental artery (upper panel), peritubular capillaries (middle panel) and papillary region (lower panel), optical magnification: ×200, scale bar: 50 µm. Representative image, n = 3/group stained. C Immunofluorescence staining and confocal microscopy of central TLS artery (segmental), inset with higher magnification. B lymphocytes in subendothelial pockets (white arrowheads). Optical magnification: ×200, all scale bars 50 µm. Representative image, n = 5/group stained. D Whole kidney mRNA expression, relative fold change, n = 10/group. Mann–Whitney test, two-tailed. Exact p-values: Selp p = 0.089; Sell p = 0.052; Madcam p = 0.0052; Vcam p = 0.071; Graphs: scatter dot blot, mean, SD (whiskers). Source data are provided as a Source Data file.
Fig. 5
Fig. 5. Kidney endothelial cell RNAseq and gene set enrichment analysis (GSEA).
A Principal Component Analysis of RbpjΔEC vs. Control kidney EC transcription analysis, n = 3/group, (Variance filtering 0.05, Student’s T test followed by the B-H correction (p < 0.02, FDR < 0.0199731) showing biological replicates of each group clustering together (370 genes) (more information in “Methods”). B GO-term GSEA—selected significantly up- (red) and downregulated (blue) gene sets sorted by normalized enrichment score (NES). C Volcano plots of individual genes with expression changed in RbpjΔEC compared to control, with log2 (fold change) on x-axis and –log10 (adjusted p-value) on the y-axis; in red, genes belonging to selected marker gene sets for different kidney arterial segments (from refs. ,). NES and p value upper right corners; see “Methods” (GSEA) for statistics. D Homeostatic HEC marker gene set from in red in same volcano plot, NES and p value upper right corner. See Methods (GSEA) for statistics. E Human kidney biopsy RNAseq (GSE: EC Notch target genes in different glomerular diseases downregulated as compared to living kidney donor biopsies as control. Abbreviations and sample number: LD, living kidney donor (n = 21); MemGN, membranous glomerulonephritis (n = 18); FSGS, focal segmental glomerulosclerosis (n = 17); MCD, minimal change disease(n = 13); RPGN, rapid-progressive glomerulonephritis (n = 21); IgA, Iga-Nephritis (n = 25); SLE, systemic lupus erythematodes (n = 32). Single samples (dot) plus mean, IQR (box) and total range (min-max: whiskers). Statistic: Brown-Forsythe and Welch (1 way) ANOVA with Dunnet’s multiple comparisons; exact adjusted p-values: HES1, compared to LD: MemGN <0.0001; FSGS, 0.068; MCD, <0.0001; RPGN, 0.0003; IgA, 0.0035; SLE, 0.0347. HEY1, compared to LD: MemGN, 0.3236; FSGS, 0.0076; MCD; 0.5432; RPGN, 0.1433; IgA, 0.5891; SLE, 0.9987. HEYL, compared to LD: MemGN, 0.119; FSGS, 0.002; MCD, 0.0050; RPGN, < 0.0001; IgA, 0.0085; SLE, 0.0021. Source data are provided as supplementary files.

References

    1. Ruddle NH. Lymphatic vessels and tertiary lymphoid organs. J. Clin. Invest. 2014;124:953–959. doi: 10.1172/JCI71611. - DOI - PMC - PubMed
    1. Yin C, Mohanta S, Maffia P, Habenicht AJR. Editorial: tertiary lymphoid organs (TLOs): powerhouses of disease immunity. Front. Immunol. 2017;8:21–23. - PMC - PubMed
    1. Pitzalis C, Jones GW, Bombardieri M, Jones SA. Ectopic lymphoid-like structures in infection, cancer and autoimmunity. Nat. Rev. Immunol. 2014;14:447–462. doi: 10.1038/nri3700. - DOI - PubMed
    1. Dorraji SE, et al. Mesenchymal stem cells and T cells in the formation of tertiary lymphoid structures in lupus nephritis. Sci. Rep. 2018;8:7861. doi: 10.1038/s41598-018-26265-z. - DOI - PMC - PubMed
    1. Steinmetz OM, et al. Analysis and classification of B-cell infiltrates in lupus and ANCA-associated nephritis. Kidney Int. 2008;74:448–457. doi: 10.1038/ki.2008.191. - DOI - PubMed

Publication types

Substances