. 2022 Apr 19;5(1):371.
doi: 10.1038/s42003-022-03286-z.

Reformulation of Trivers-Willard hypothesis for parental investment

Affiliations

Reformulation of Trivers-Willard hypothesis for parental investment

Jibeom Choi et al. Commun Biol. .

Abstract

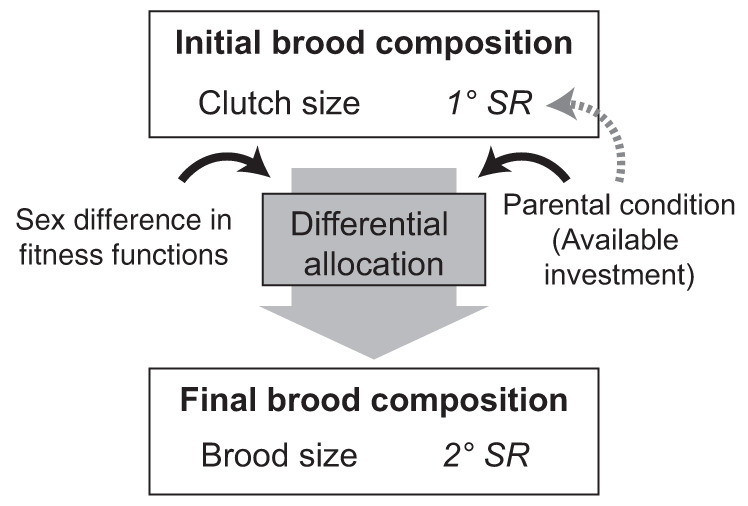
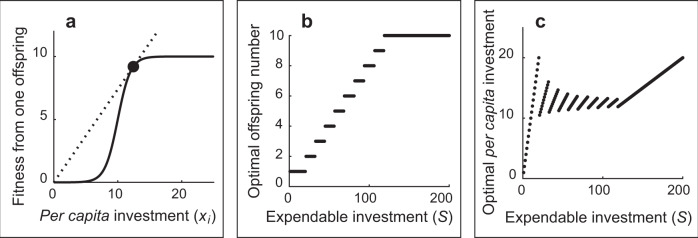
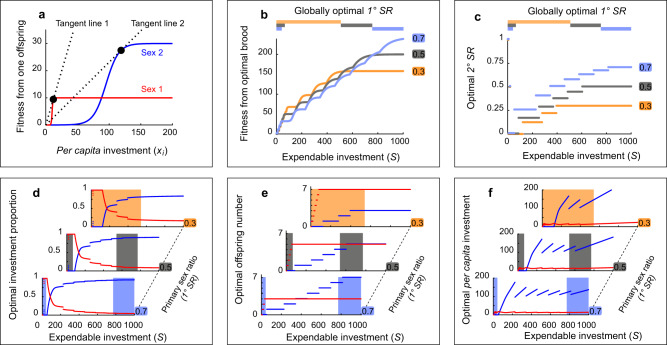
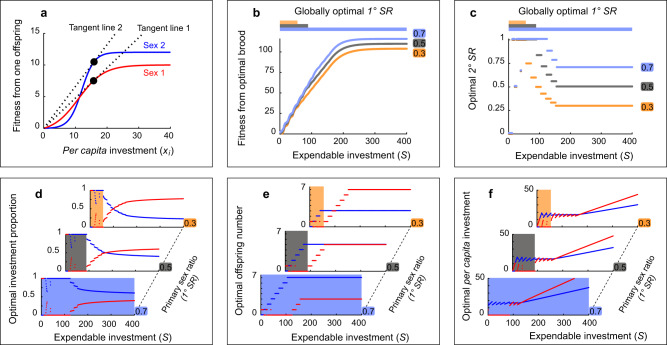
The Trivers-Willard hypothesis (TWH) plays a central role in understanding the optimal investment strategies to male and female offspring. Empirical studies of TWH, however, yielded conflicting results. Here, we present models to predict optimal comprehensive multi-element parental strategies composed of primary sex ratio, brood size, resource allocation among offspring, and the resultant secondary sex ratio. Our results reveal that the optimal strategy depends on sex differences in the shape of offspring fitness function rather than in fitness variance. Also, the slope of the tangent line (through the origin) to the offspring fitness function can be used to predict the preferred offspring sex. We also briefly discuss links between the model and the empirical research. This comprehensive reformulation of TWH will offer a thorough understanding of multi-element parental investment strategies beyond the classical TWH.


Conflict of interest statement

The authors declare no competing interests.

Figures

Fig. 1
Fig. 1. Schematics illustrating links between the components of the multi-element parental strategy.
Primary sex ratio (1° SR), clutch size, brood size, parental investment rules of differential allocation between sexes, and the resulting secondary sex ratio (2° SR), including two factors (parental condition/available investment and sex difference in fitness functions) that affect the optimal parental strategy are shown. The globally optimal strategy assumes the ability of parents to modify the primary sex ratio according to the parental investment, while the locally optimal strategy does not.
Fig. 2
Fig. 2. Results of the model M1 (fully presented in Fig. S1a–d) where all offspring fitness functions are identical.
a The fitness function in model M1: the relationship between per capita investment in one offspring (xi) and the fitness of this offspring. The most efficient point, where f(x)/x is the greatest, is marked with a black circle. b The relationship between the amount of expendable investment (S) and the optimal number of offspring (optimal brood size) receiving care from parents that maximize the total brood fitness. c The relationship between the amount of expendable investment (S) and per capita investment (xi) for optimal brood size (shown in b). The results of b, c are confirmed by mathematical analysis.
Fig. 3
Fig. 3. The results from model M3 (fully presented in Fig. S3), in which predictions from the classical TWH hold with respect to the total number of offspring receiving care and total investment toward the specific sex: Sex 2 is preferred over Sex 1 when S is high.
a The fitness functions of Sex 1 (red line) and Sex 2 offspring (blue line) in model M3. In this model, the tangent line of Sex 1 is steeper than that of Sex 2. b The relationship between total investment (S) and fitness accrued from the whole brood for three different primary sex ratios (0.3, 0.5, 0.7; yellow, gray, and light blue, respectively) by parents that optimize their parental strategy. The horizontal color bars on top of the panel represent the ranges of S in which the specific primary sex ratio(s) yield the highest value of fitness accrued from the optimal brood. The same bars are presented in c and these regions of S are indicated as shaded regions of the same color in df. c The relationship between total investment (S) and the brood’s secondary sex ratio for the three different primary sex ratios (same color schematics as in b) for parents that optimize their investment. df The relationship between total investment (S) and the three aspects of the optimal parental strategy: proportion of investment (d), optimal numbers of offspring chosen for investment (e), and per capita investment (xi) into Sex 1 (red) and Sex 2 (blue) offspring (f) for three different primary sex ratios. Color-shaded (same color schematics as in b) regions indicate the globally optimal strategy: in each primary sex ratio, shadings indicate the range of S in which fitness from the brood is globally maximized (as seen in b).
Fig. 4
Fig. 4. The results from model M5 (fully presented in Fig. S5), in which the tangent line of Sex 2 is steeper than that of Sex 1. The predictions are inconsistent with the classical TWH.
Panels represent the same information as in panels from Fig. 3. In this model, the reversed TWH predictions are observed: Sex 1 offspring (red lines) receive most investment at high parental expendable investment (S) for equal or Sex-1-biased primary sex ratios, despite having a lower variance in fitness.

References

    1. Trivers RL, Willard DE. Natural selection of parental ability to vary the sex ratio of offspring. Science. 1973;179:90–92. doi: 10.1126/science.179.4068.90. - DOI - PubMed
    1. Leimar O. Life-history analysis of the Trivers and Willard sex-ratio problem. Behav. Ecol. 1996;7:316–325. doi: 10.1093/beheco/7.3.316. - DOI
    1. Wild G, West SA. A sex allocation theory for vertebrates: combining local resource competition and condition-dependent allocation. Am. Nat. 2007;170:E112–E128. doi: 10.1086/522057. - DOI - PubMed
    1. Cockburn, A., Legge, S. & Double, M. C. Sex ratios in birds and mammals: can the hypotheses be disentangled? in Sex Ratios: Concepts and Research Methods 266–286 10.1017/cbo9780511542053.014 (2002).
    1. West SA, Sheldon BC. Constraints in the evolution of sex ratio adjustment. Science. 2002;295:1685–1688. doi: 10.1126/science.1069043. - DOI - PubMed

Publication types