. 2022 May 24;145(4):1391-1409.
doi: 10.1093/brain/awab475.

Silencing of amygdala circuits during sepsis prevents the development of anxiety-related behaviours

Affiliations

Silencing of amygdala circuits during sepsis prevents the development of anxiety-related behaviours

Lena Bourhy et al. Brain. .

Abstract

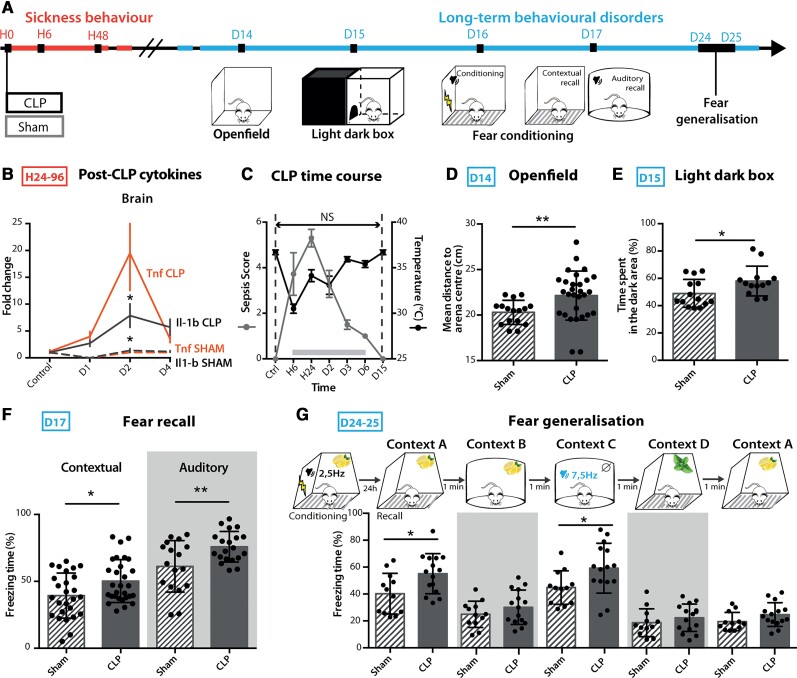
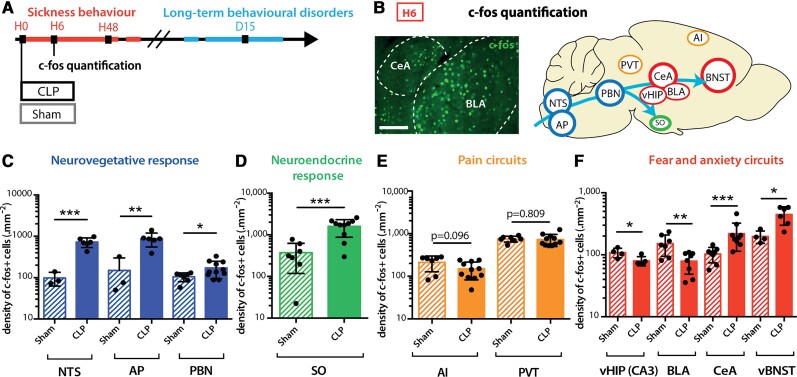
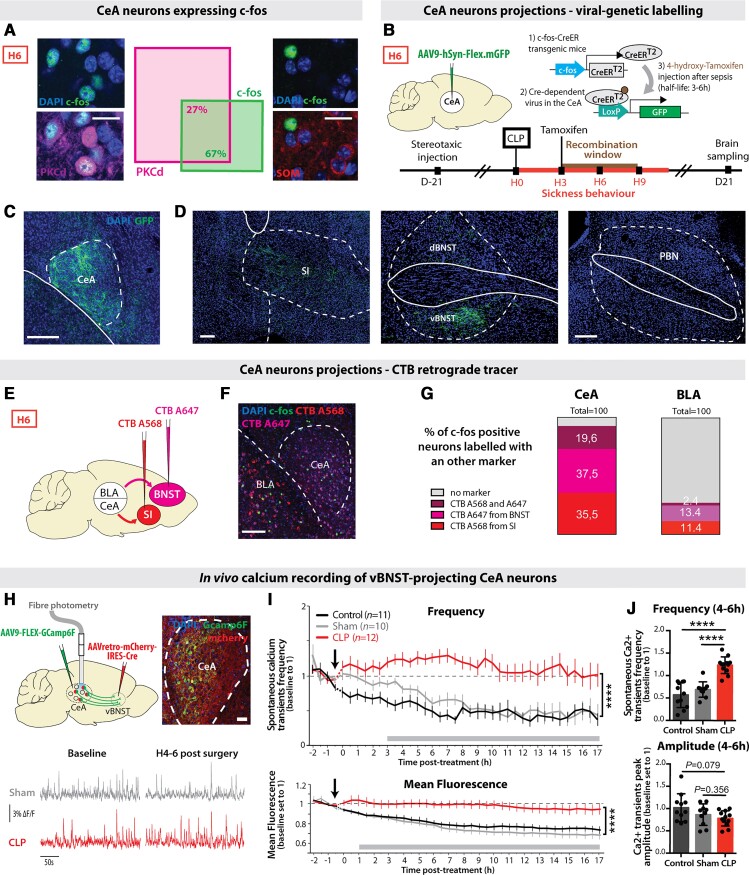
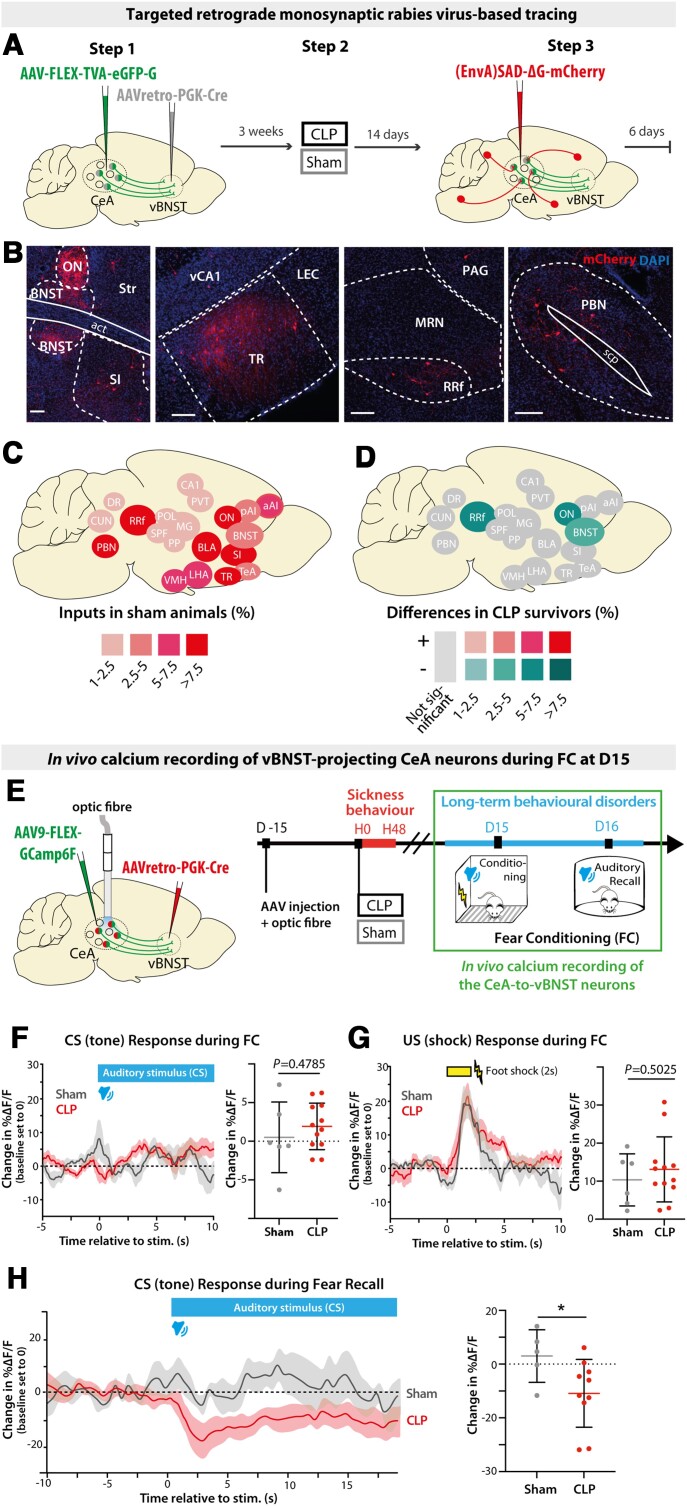
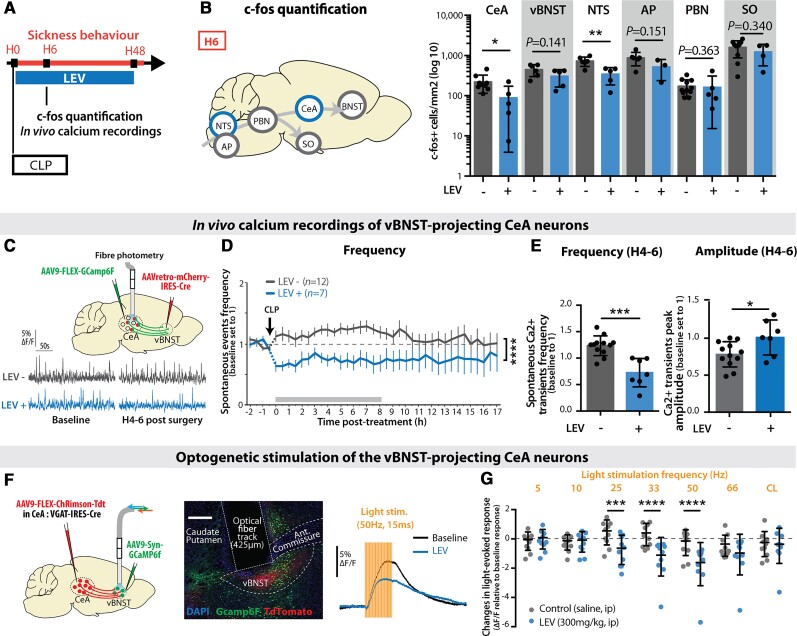
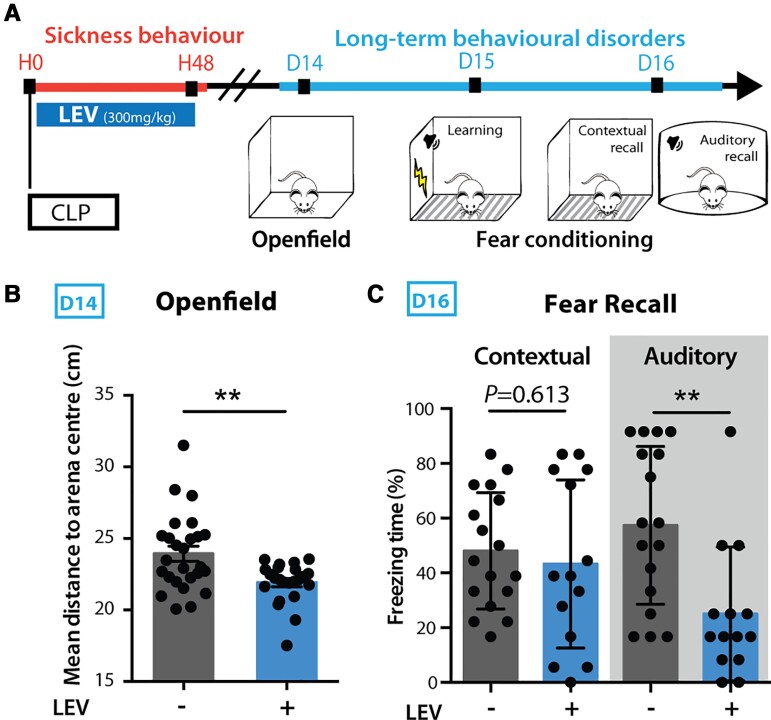
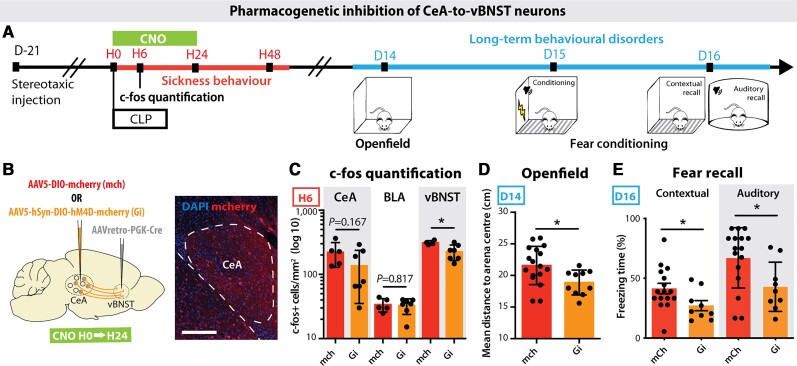
Sepsis is a life-threatening condition induced by a deregulated host response to severe infection. Post-sepsis syndrome includes long-term psychiatric disorders, such as persistent anxiety and post-traumatic stress disorder, whose neurobiological mechanisms remain unknown. Using a reference mouse model of sepsis, we showed that mice that recovered from sepsis further developed anxiety-related behaviours associated with an exaggerated fear memory. In the brain, sepsis induced an acute pathological activation of a specific neuronal population of the central nucleus of the amygdala, which projects to the ventral bed nucleus of the stria terminalis. Using viral-genetic circuit tracing and in vivo calcium imaging, we observed that sepsis induced persistent changes in the connectivity matrix and in the responsiveness of these central amygdala neurons projecting to the ventral bed nucleus of the stria terminalis. The transient and targeted silencing of this subpopulation only during the acute phase of sepsis with a viral pharmacogenetic approach, or with the anti-epileptic and neuroprotective drug levetiracetam, prevented the subsequent development of anxiety-related behaviours. Specific inhibition of brain anxiety and fear circuits during the sepsis acute phase constitutes a preventive approach to preclude the post-infection psychiatric outcomes.

Keywords: cecal ligation and puncture; fear conditioning; neuro-immune interactions; neuroinflammation; optogenetic.


Figures

Figure 1
Figure 1
CLP mice developed long-term anxiety and PTSD-like conditioned fear expression. (A) Timeline of the experiment: long-term anxiety and fear-related behaviours were tested from 2 weeks post-surgery. (B) Brain cytokine levels were significantly increased post-CLP [ncontrol = 5, nD1-sham = 1, nD1-CLP = 5, nD2-sham = 4, nD2-CLP = 8, nD3-sham = 5, nD3-CLP = 5. IL1-b: group F(1,30) = 2.931, P = 0.0972, D2: *P = 0.0119; TNF: group F(1,30) = 7.354, *P = 0.0110, D2: *P = 0.0141]. (C) CLP-induced sickness behaviour (nControl = 9, nCLP = 90) was transient and totally disappeared at D15. (D and E) CLP caused long-term anxiety behaviour illustrated by an increased mean distance to arena centre in the open field (D; nSham = 16, nCLP = 23, **P = 0.0037) and an increased time spent in the dark area during the light/dark box test (E; nSham = 14, nCLP = 13, *P = 0.0348). (F) Twenty-four hours after aversive conditioning, CLP mice displayed an enhanced freezing behaviour during both contextual and auditory fear conditioning recall (Contextual: nSham = 27, nCLP = 29, *P = 0.0176; Auditory: nSham = 18, nCLP = 20, *P = 0.0108). (G) CLP mice showed an increased freezing behaviour when confronted to stimuli partially related to the conditional stimulus in the generalization test [nSham = 12, nCLP = 15, group, F(1,25) = 9.243, **P = 0.0055; Context A, *P = 0.0136; Context C, *P = 0.0183]. Statistics: (DF) Mann–Whitney test or unpaired t-test; (B, C and G) two-way ANOVA and Sidak’s multiple comparison tests (grey bar when significant). Data shown as mean ± SD. D = days post-surgery; H = hours post-surgery.
Figure 2
Figure 2
CLP induced transient brain activation. (A and B) Neuronal activation marker c-fos was quantified at H6 post-surgery. Scale bar = 200 μm. (C and D) H6 c-fos quantification showed transient neuronal activation in CLP compared to sham mice in areas involved in the neurovegetative response [C; NTS: nsham = 3, nCLP = 6, ***P = 0.0009; area postrema (AP): nsham = 3, nCLP = 6, **P = 0.0089; PBN: nsham = 7, nCLP = 12, *P = 0.0255] and the neuroendocrine system [D; supra-optic nucleus (SO): nsham = 7, nCLP = 10, ***P = 0.0003]. (E) At H6, CLP showed no effect on the activation of pain related areas compared to the sham group ([agranular insular area (AI), paraventricular nucleus of the thalamus (PVT) nsham = 7, nCLP = 11]. (F) CLP-induced c-fos expression variations at H6 in areas involved in fear and anxiety circuits [ventral hippocampus (vHIP) cornu ammonis 3 (CA3): nsham = 4, nCLP = 5, *P = 0.0328; BLA: nsham = 7, nCLP = 8, **P = 0.0079; CeA: nsham = 8, nCLP = 9, ***P = 0.0006; vBNST: nsham = 4, nCLP = 6, *P = 0.0121)]. Statistics: (CF) Mann–Whitney test or unpaired t-test. Data shown as mean ± SD.
Figure 3
Figure 3
CLP triggered the activation of PKCδ+ CeA neurons projecting to the vBNST and the substantia innominata. (A) CeA c-fos+ neurons at H6 post-CLP were 67% co-localizing with PKCδ+ neurons, but 0% with SOM+ neurons (n = 6, total cell counted, nc-fos+/PKC = 301/453, ncfos+/SOM = 0/144; scale bar = 20 μm). (BD) Viral trapping of CeA c-fos+ neurons at H6. (B) A Cre-dependent GPF+ AAV virus was injected in the CeA of transgenic mice expressing the tamoxifen-inducible Cre-recombinase enzyme under the control of the c-fos gene promoter. 4-Hydroxy-tamoxifen was injected into these mice 3 h after CLP for restricting the recombination window between H3 and H9 post-CLP. (C) Recombination site in the CeA. Scale bar = 200 μm. (D) GFP+ fibres only projected to the vBNST and the substantia innominata (SI) but not to other reported projection regions of CeA PKCδ+ neurons such as the PBN (n = 3, scale bar = 200 μm). (EG) CTB retrograde tracing. (E) CTB A568 was injected in the substantia innominata and CTB A647 in the BNST. Mice underwent a CLP surgery 5 days after stereotaxic injection and were sacrificed at H6. (F) Representative picture of c-fos+ staining and CTB labelling. (G) C-fos+ neurons colocalized at 92.6% with retrograde CTB A568 and/or CTB A647 tracers in the CeA. In a control region such as the BLA, only 27.2% of the H6 c-fos+ neurons were co-localizing with both CTB tracers (n = 3, total cell counted, nc-fos = 173, scale bar = 200 μm). (HJ) In vivo calcium imaging of vBNST-projecting CeA neurons. (H) Gcamp6f-specific expression and recordings in the vBNST-projecting CeA neurons (scale bar = 50 μm) before and after surgery (CLP, red; sham, grey). (I) Spontaneous calcium events frequency (top) and mean fluorescence (bottom) in the vBNST-projecting CeA neurons were higher in CLP compared to control or sham mice [frequency: interaction: F(76,1075) = 2.268; group: F(2,1075) = 381.6, ****P < 0.0001; mean fluorescence: interaction: F(76,1107) = 1.602, P = 0.0011; group: F(2,1107) = 336.1, ****P < 0.0001]. (J) Between H4 and H6 (nControl = 11 nSham = 10, nCLP = 12), CLP mice (compared to control or sham animals) displayed a higher frequency of calcium events with a non-significant decrease in amplitude of those events. Statistics: (I) Two-way ANOVA and Sidak’s multiple comparison tests (grey bar when significant). (J) Mann–Whitney test or unpaired t-test, ****P < 0.0001. Data shown as mean ± SEM (I) and mean ± SD (J).
Figure 4
Figure 4
CLP induces long-term alterations of synaptic connectivity and functional activity of vBNST-projecting CeA neurons. (A) Experimental design for targeting mCherry-expressing pseudotyped rabies virus to CeA neurons projecting to the vBNST in sham versus CLP survivors, 2 weeks after surgery. (B) Trans-synaptically labelled neurons in different brain regions. Scale bar = 100 μm. (C) Map of the brain regions providing the largest fraction of presynaptic neurons to the vBNST-projecting CeA neurons in sham animals (relative to the total). Regions providing <1% of total inputs are not displayed (n = 4). BNST included all BNST subdivisions except oval nucleus (ON). (D) Map of the differences in presynaptic neurons to vBNST-projecting CeA neurons in CLP survivors compared to sham survivors. Only regions showing significant difference are colour-coded (nCLP = 4, Mann–Whitney tests; BNST: *P = 0.028, ON: *P = 0.017, *RRf: P = 0.049). (E) vBNST-projecting CeA neurons were chronically recorded during fear conditioning at D15 using fibre photometry. (F and G) Averaged ΔF/F traces (baseline set to 0) showing the responses to conditioned stimulus [tone; conditioned stimulus (CS); F] and unconditional stimulus [foot shock; unconditional stimulus (US); G] during fear conditioning in CLP and sham mice (nSham = 6, nCLP = 12). Mean ΔF/F changes relative to baseline during the conditioned stimulus response (0–5 s window) and during the unconditional stimulus response (0–4 s window) showed no difference between CLP and sham mice. (H) Averaged ΔF/F traces (baseline set to 0) during fear conditioning (FC) recall exhibited a stronger inhibitory response to conditioned stimulus in CLP mice compared to sham animals (nSham = 5, nCLP = 10, *P = 0.0426). Statistics: (D and FH) Mann–Whitney tests. Data shown as mean ± SD (except traces in FH ± SEM). aAI = anterior agranular insular cortex; CUN = cuneiform nucleus; DR = dorsal raphe nucleus; LEC = lateral entorhinal cortex; LHA = lateral hypothalamic area; MG = medial geniculate nucleus; MRN = midbrain reticular nucleus; OV = oval nucleus; PAG = periaqueductal grey; pAI = posterior agranular insular cortex; POL = posterior limiting nucleus of the thalamus; PP = peripeduncular nucleus; RRf = retrorubral field; SPF = subparafascicular nucleus; TeA = temporal association area; TR = post-piriform transition area; vCA1 = ventral CA1; VMH = ventro-medial hypothalamic nucleus..
Figure 5
Figure 5
LEV administration during sepsis suppressed the transient neuronal activation in vBNST-projecting CeA neurons. (A) LEV was administrated every 12 h for 48 h post-CLP. (B) LEV treatment reduced the transient c-fos expression increase at H6 post-CLP only in the NTS and the CeA (CeA: nCLP = 9, nCLP+LEV = 5, *P = 0.0347, vBNST: nCLP = 6, nCLP+LEV = 5; NTS: nCLP = 6, nCLP+LEV = 5, **P = 0.0057; AP: nCLP = 6, nCLP+LEV = 3; PBN: nCLP = 11, nCLP+LEV = 5; supra-optic nucleus (SO): nCLP = 10, nCLP+LEV = 4). (CE) In vivo calcium imaging of the vBNST-projecting CeA neurons. (C) Gcamp6f specific expression and in vivo recording in the vBNST-projecting CeA neurons before and hours after CLP, in absence or presence of LEV treatment. (D) LEV administration showed a direct inhibiting effect over the increased neuronal spontaneous activity observed in vivo post-CLP [group: F(1,616) = 141.7, ****P < 0.0001]. (E) Between H4 and H6 post-CLP (nCLP = 12, nCLP+LEV = 7), LEV treatment induced a decreased frequency and an increased amplitude of the calcium events compared to non-treated animals (frequency: ***P = 0.0001, amplitude: *P = 0.0265). (F and G) Optogenetic stimulation of axon terminals from ChRimsonR-expressing vBNST-projecting CeA neurons and recording of the light-evoked response in vBNST neurons. Scale bar = 200 μm. Thirty minutes following LEV intraperitoneal injection (blue), the light-evoked response (normalized to the baseline light-evoked response before injection) was decreased compared to saline injection (grey) [n per group = 10, interaction: F(6,54) = 5.472; frequency: F(6,54) = 5.472, ***P = 0.0002; group: F(1,9) = 3.412, P = 0.0978; Control-LEV: 25 Hz, ***P = 0.0009]. CL = continuous light. LEV data in B are pooled with CLP data from Fig. 2 and LEV data in D and E are pooled with CLP data from Fig. 3. Statistics: (B and E) Mann–Whitney test or unpaired t-test. (D and G) two-way ANOVA (repeated measure for G) and Sidak’s multiple comparison tests (grey bar when significant). ****P < 0.0001. Data shown as mean ± SD (except D ± SEM).
Figure 6
Figure 6
Transient LEV treatment during sepsis acute phase dampened the post-CLP long-term behavioural impairments. (A) LEV was administrated every 12 h during the first 48 h following CLP. Long-term behaviour was then tested 15 days post-CLP. (B and C) Early LEV administration decreased the mean distance to the open field arena centre (B; nLEV- = 26, nLEV+ = 22, **P = 0.0055) and the freezing behaviour during fear conditioning recall in CLP surviving mice (C; nLEV = 17, nLEV+ = 14, Auditory: **P = 0.0024). LEV data in B and C are pooled with CLP data from Fig. 1. Statistics: (B and C) Mann–Whitney test or unpaired t-test. Data shown as mean ± SD.
Figure 7
Figure 7
Transient pharmacogenetic silencing of vBNST-projecting CeA neurons prevents the development of anxiety and PTSD-like conditioned fear expression. (A) Timeline of the experiment. Three weeks after stereotaxic injection of viral vectors, mice underwent a CLP and were injected with clozapine N-oxide (CNO) during the 24 h following surgery. Long-term behaviour was then tested 15 days post-surgery. (B) A retrograde Cre-expressing virus was injected in the vBNST and a Cre-dependent inhibitory DREADD (Gi) or mCherry control (mch) virus was injected in the CeA to allow the recombination and the expression of the Gi/mch viruses exclusively in the vBNST-projecting CeA neurons. (C) H6 c-fos quantification showed an inhibiting effect of Gi over the post-CLP neuronal activation in the vBNST compared to mCherry controls, with no impact on other neighbouring regions such as the BLA (nmch = 5, nGi = 7, vBNST: *P = 0.0257). (D and E) CNO-induced Gi inhibition for 24 h post-CLP is sufficient to abolish the long-term behavioural changes observed in the open field test (D; nmch = 17, nGi = 10, *P = 0.0190) and the fear conditioning (FC) recall (E; nmch = 16, nGi = 9, Contextual: *P = 0.0415; Auditory: *P = 0.0228). Scale bar = 200 μm. Statistics: Mann–Whitney test or unpaired t-test. Data shown as mean ± SD.

Comment in

References

    1. Singer M, Deutschman CS, Seymour CW, et al. . The third international consensus definitions for sepsis and septic shock (Sepsis-3). JAMA. 2016;315:801–810. - PMC - PubMed
    1. Rudd KE, Johnson SC, Agesa KM, et al. . Global, regional, and national sepsis incidence and mortality, 1990–2017: Analysis for the global burden of disease study. Lancet. 2020;395:200–211. - PMC - PubMed
    1. Reinhart K, Daniels R, Kissoon N, Machado FR, Schachter RD, Finfer S. Recognizing sepsis as a global health priority—A WHO resolution. N Engl J Med. 2017;377:414–417. - PubMed
    1. Dantzer R, O’Connor JC, Freund GG, Johnson RW, Kelley KW. From inflammation to sickness and depression: When the immune system subjugates the brain. Nat Rev Neurosci. 2008;9:46–56. - PMC - PubMed
    1. Azabou E, Magalhaes E, Braconnier A, et al. . Early standard electroencephalogram abnormalities predict mortality in septic intensive care unit patients. PLoS One. 2015;10:e0139969. - PMC - PubMed

Publication types