Neuropathological fingerprints of survival, atrophy and language in primary progressive aphasia
- PMID: 35441216
- PMCID: PMC9246707
- DOI: 10.1093/brain/awab410
Neuropathological fingerprints of survival, atrophy and language in primary progressive aphasia
Abstract
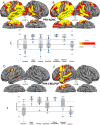
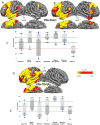
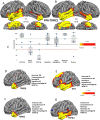
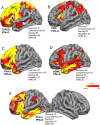
Primary progressive aphasia is a neurodegenerative disease that selectively impairs language without equivalent impairment of speech, memory or comportment. In 118 consecutive autopsies on patients with primary progressive aphasia, primary diagnosis was Alzheimer's disease neuropathological changes (ADNC) in 42%, corticobasal degeneration or progressive supranuclear palsy neuropathology in 24%, Pick's disease neuropathology in 10%, transactive response DNA binding proteinopathy type A [TDP(A)] in 10%, TDP(C) in 11% and infrequent entities in 3%. Survival was longest in TDP(C) (13.2 ± 2.6 years) and shortest in TDP(A) (7.1 ± 2.4 years). A subset of 68 right-handed participants entered longitudinal investigations. They were classified as logopenic, agrammatic/non-fluent or semantic by quantitative algorithms. Each variant had a preferred but not invariant neuropathological correlate. Seventy-seven per cent of logopenics had ADNC, 56% of agrammatics had corticobasal degeneration/progressive supranuclear palsy or Pick's disease and 89% of semantics had TDP(C). Word comprehension impairments had strong predictive power for determining underlying neuropathology positively for TDP(C) and negatively for ADNC. Cortical atrophy was smallest in corticobasal degeneration/progressive supranuclear palsy and largest in TDP(A). Atrophy encompassed posterior frontal but not temporoparietal cortex in corticobasal degeneration/progressive supranuclear palsy, anterior temporal but not frontoparietal cortex in TDP(C), temporofrontal but not parietal cortex in Pick's disease and all three lobes with ADNC or TDP(A). There were individual deviations from these group patterns, accounting for less frequent clinicopathologic associations. The one common denominator was progressive asymmetric atrophy overwhelmingly favouring the left hemisphere language network. Comparisons of ADNC in typical amnestic versus atypical aphasic dementia and of TDP in type A versus type C revealed fundamental biological and clinical differences, suggesting that members of each pair may constitute distinct clinicopathologic entities despite identical downstream proteinopathies. Individual TDP(C) participants with unilateral left temporal atrophy displayed word comprehension impairments without additional object recognition deficits, helping to dissociate semantic primary progressive aphasia from semantic dementia. When common and uncommon associations were considered in the set of 68 participants, one neuropathology was found to cause multiple clinical subtypes, and one subtype of primary progressive aphasia to be caused by multiple neuropathologies, but with different probabilities. Occasionally, expected clinical manifestations of atrophy sites were absent, probably reflecting individual peculiarities of language organization. The hemispheric asymmetry of neurodegeneration and resultant language impairment in primary progressive aphasia reflect complex interactions among the cellular affinities of the degenerative disease, the constitutive biology of language cortex, familial or developmental vulnerabilities of this network and potential idiosyncrasies of functional anatomy in the affected individual.
Keywords: Alzheimer’s disease; asymmetry; dementia; frontotemporal lobar degeneration; tauopathy.
© The Author(s) (2022). Published by Oxford University Press on behalf of the Guarantors of Brain. All rights reserved. For permissions, please email: journals.permissions@oup.com.
Figures


References
-
- Rosenfeld M. Die partielle Grosshirnatrophie. J Psychol Neurol. 1909;14:115–130.
-
- Pick A. Ueber die Beziehungen der senilen Hirnatrophie zur Aphasie. Prager Medizinische Wochenschrift. 1892;17:165–167.
-
- Pick A. Zur Symptomatologie der linksseitigen Schlaffenlappenatrophie. Monatsschr Psychiatr Neurol. 1904;16(4):378–388.
-
- Franceschi F. Gliosi perivasculare in un caso de demenza afasica. Ann Neurol. 1908;26:281–290.
-
- Sérieux P. Sur un cas de surdité verbale pure. Rev Med. 1893;13:733–750.
Publication types
MeSH terms
Substances
Grants and funding
LinkOut - more resources
Full Text Sources
Medical

