. 2022 Nov;71(11):2801-2814.
doi: 10.1007/s00262-022-03195-4. Epub 2022 Apr 19.

Chimeric antigen receptor clustering via cysteines enhances T-cell efficacy against tumor

Affiliations

Chimeric antigen receptor clustering via cysteines enhances T-cell efficacy against tumor

Yuedi Wang et al. Cancer Immunol Immunother. 2022 Nov.

Abstract

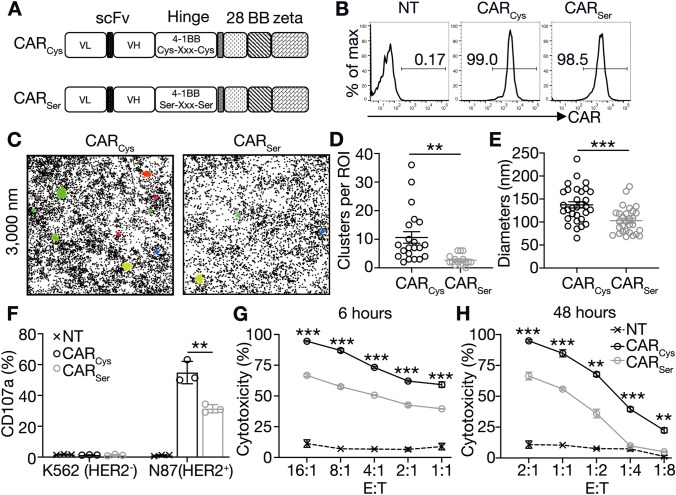
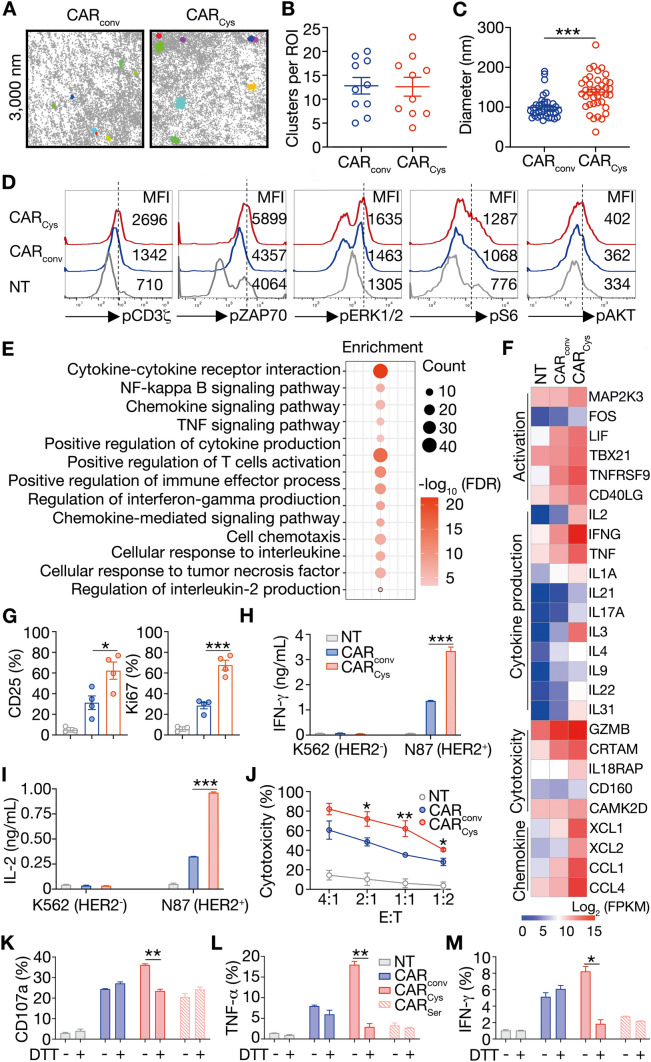
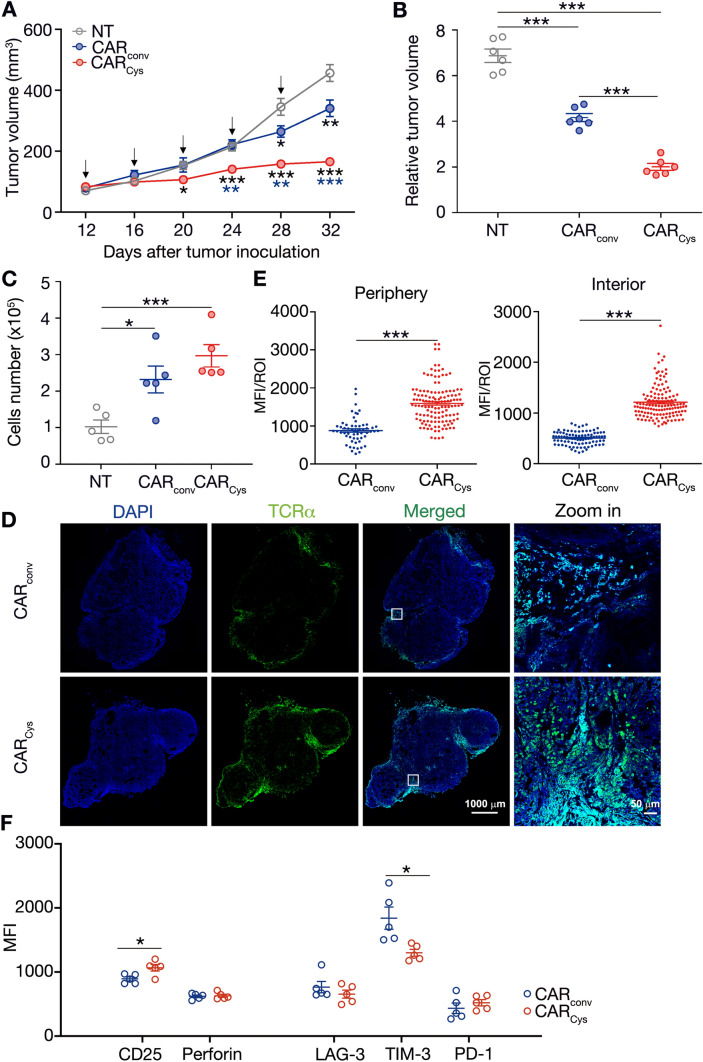
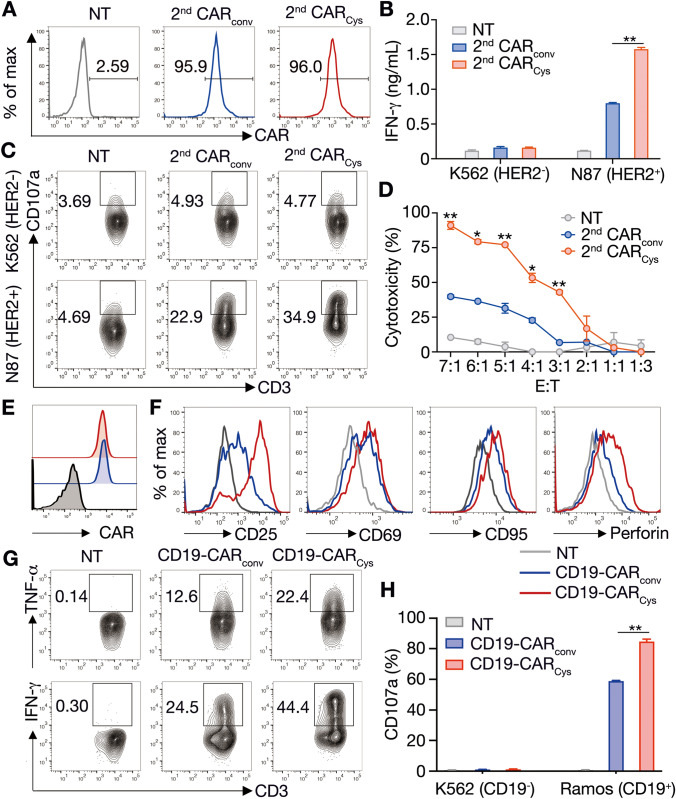
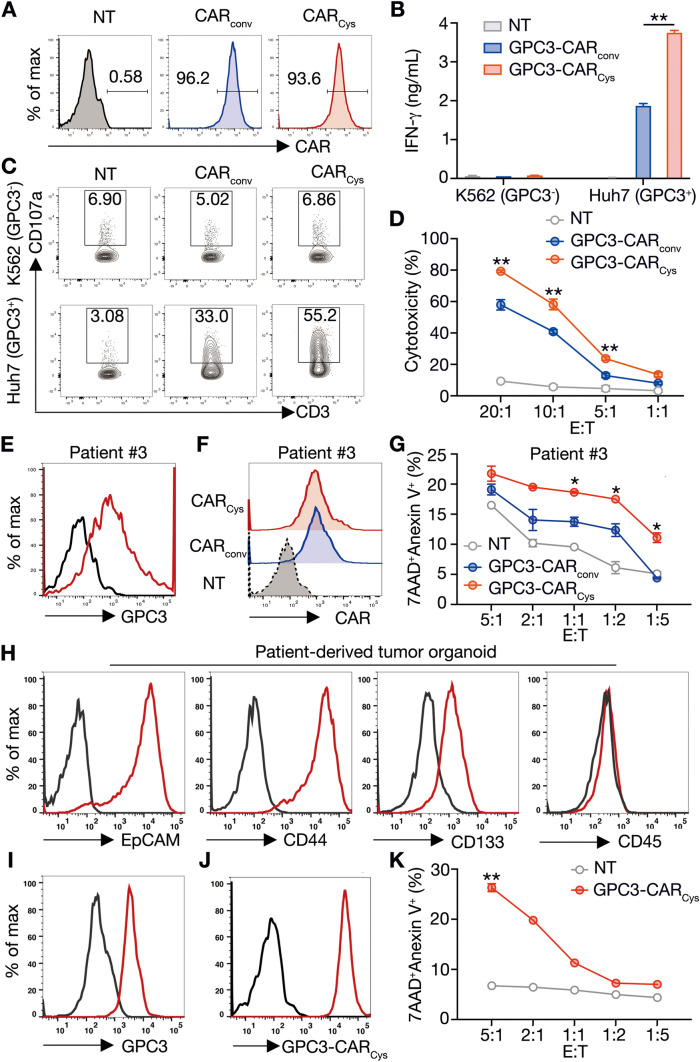
Chimeric antigen receptor (CAR) T-cell therapy achieves great success for hematological malignancies. However, clinical trials have revealed some limitations in both improving the efficacy and reducing the relapse, which calls for innovative strategies to engineer more powerful CAR-T cells. Promoting the formation of CAR clusters provides an alternative approach and potentially improves current CAR T-cell therapy against cancers. Here, we generated CARCys-T cells using a 4-1BB-derived hinge region including 11 cysteines residues. The cysteines in the hinge were found to facilitate CARCys clustering upon antigen stimulation and promote the antitumor activity of CAR-T cells. Compared with most conventionally used CAR-T cells with CD8α-derived hinge (CARconv-T cells), CARCys-T cells exhibited larger diameter of CAR clusters and enhanced antigen-specific tumor lysis both in vitro and in vivo. In addition, the CARCys-mediated enhancement could be applied to HER2, CD19 as well as GPC3-targeted CAR-T cells. More importantly, CARCys-T cells showed potent antitumor efficacy in clinically relevant patient-derived primary tumor cells and organoids. Thus, the novel hinge containing 11 cysteines provides a promising strategy to facilitate CAR clustering and maximize anti-tumor activity of CAR-T cells, which emphasizes the importance of CAR clustering to improve CAR T-cell therapy in the clinic.

Keywords: CAR clustering; CAR-T cell; Cancer immunotherapy; Cysteines; Hinge domain.


Conflict of interest statement

The authors have no relevant financial or non-financial interests to disclose.

Figures

Fig. 1
Fig. 1
Cysteines in the hinge facilitate antigen-triggered CAR cluster formation and promote CAR T-cell activity A Gene schematics of CARCys and CARSer targeting HER2. B Human T cells derived from healthy donors were transduced with or without HER2-CARCys or HER2-CARSer mRNA to generate NT or HER2-CAR-T cells. Twelve hours post-transduction, the CAR expression on these T cells was detected by flow cytometry. Data were representative of at least three independent experiments. CE CARCys and CARSer distribution on these T cells was observed using STORM system after stimulation with HER2 antigen for 30 min. The tables containing x × y co-ordinates of each CAR molecule were obtained from STORM, and DBSCAN implemented in MATLAB was used for CAR clusters identification. For each T cell, a 5 × 5 μm2 ROI in cell center was selected for further analysis of cluster number and diameter by DBSCAN. C The representative cluster maps of CARCys and CARser on primary human T cells. D The number of CAR clusters per ROI. E The diameters of CAR clusters. Data shown as mean ± SEM were from 13 to 16 cells of healthy donors. F CARCys and CARSer-T cells were co-cultured with HER2+N87 or HER2K562 tumor cells. Four hours later, CD107a translocation of CAR-T cells was detected by flow cytometry. Data shown as mean ± SEM were pooled from three healthy donors. G, H CARCys and CARSer-T cells were co-cultured with HER2+N87 at indicated E: T ratios for 6 or 48 h. The cytotoxicity of CAR-T cells was calculated by the target cells’ viability using CCK8. Data shown as mean ± SEM were from one of two independent experiments using two healthy donors. P values were determined by unpaired Student’s t test in (D, E), and two-way ANOVA in F, G, and H. **P < 0.01, ***P < 0.001
Fig. 2
Fig. 2
CARCys-T cells exhibit increased antigen-specific activity compared to CARconv-T cells in vitro Human T cells derived from healthy donors were transduced with or without HER2-CARconv or HER2-CARCys mRNA to generate NT or HER2-CAR-T cells. A These CAR-T cells were stimulated with HER2 antigen for 30 min, and identified the antigen-triggered CAR clusters by STROM and DBSCAN analysis. B, C The number of CAR clusters per ROI (5 × 5 mm2) and the diameter of CAR clusters were calculated by DBSCAN analysis. Data shown as mean ± SEM were from 10 CAR-T cells of healthy donors. D Twelve hours post-transduction, NT- or CAR-T cells were cultured in Opti-MEM for 6 h to reduce background. These T cells were incubated with biotinylated HER2 protein (2.5 μg/mL) for 30 min at 4 °C and washed twice with cold PBS. Then, these T cells were cross-linked with streptavidin (5 μg/mL) at 37 °C for 30 s to measure the phosphorylation of CD3ζ and ZAP70, and cross-linked for 2 min to detect the phosphorylation of ERK1/2, S6 and AKT. E The enriched gene sets of CARconv-T cell comparing with CARCys-T cells after 10-h antigen stimulation. F The heat map of selected differentially expressed genes related to T cell activation, cytokine production, cytotoxicity, and chemokine signaling. Differentially expressed genes were selected with an adjusted P value (false discovery rate, FDR) < 0.05 and absolute fold change ≥ 2. GJ NT, CARconv, or CARCys-T cells were co-cultured with HER2K562 or HER2+N87. (G) CD25 and Ki67 expressions of T cells were detected by flow cytometry 24 and 48 h post-co-culture, respectively. Data shown as mean ± SEM were pooled from four healthy donors. H, I IFN-γ and IL-2 production of T cells were measured by ELISA 24 h post-co-culture. Data shown as mean ± SEM were from one of three independent experiments using three healthy donors. J Cytotoxic activity of T cells was measured by performing CCK8 assay 12 h post-co-culture at indicated E: T ratios; data shown as mean ± SEM were from one of two independent experiments using two healthy donors. KM Human T cells were transduced with HER2-CARconv, HER2-CARCys or HER2-CARSer mRNA to generate CAR-T cells. Twelve hours post-transduction, these CAR-T cells were treated with 10 mM/mL DTT and co-cultured with HER2+N87 tumor cells at the ratio of 1: 2. Six hours later, the CD107a translocation (K), the TNF-α (L) and IFN-γ (M) production were detected by flow cytometry. Data shown as mean ± SEM were from two independent experiments. P values were determined by unpaired Student’s t-test in (C), one-way ANOVA in (G), and two-way ANOVA in (HM). *P < 0.05, **P < 0.01, and ***P < 0.001
Fig. 3
Fig. 3
CARCys-T cells display enhanced anti-tumor efficacy relative to CARconv-T cells in tumor-bearing mice. Mice engrafted with 2 × 106 N87 tumor cells and treated with 5 doses of NT, CARconv, or CARCys-T cells (5 × 106) every four days from day 12. A Tumor growth of N87-bearing mice was measured every 4 days, and the arrow represented a single injection of CAR-T cells. The blue asterisk represented analysis between CARCys and CARconv, and the black one indicated the comparison of CARCys or CARconv with NT. B RTV was calculated by the ratio of the final tumor volume (day 32) to the baseline (day 12). C The number of adoptive tumor-infiltrating T cells was measured using counting beads (APC-labeled) by flow cytometry. D Tumor slices were observed under FV3000 at an original magnification of × 20 (scale bar = 1000 μm). E The images were analyzed using Fiji software. F The expression of functional (CD25, Perforin) and exhaustion markers (LAG3, TIM-3, and PD-1) on adoptive tumor-infiltrating T cells were detected by flow cytometry. Data shown as mean ± SEM were pooled from five or six mice per group. P values were determined by unpaired Student’s t test in (E, F), one-way ANOVA in (B, C) and two-way ANOVA in (A). *P < 0.05, **P < 0.01, and ***P < 0.001
Fig. 4
Fig. 4
CARCys-T cells with different CAR framework exhibit stronger antigen-specific activity than CARconv-T cells. Human T cells derived from healthy donors were transduced with or without second-generation HER2-CARconv or HER2-CARCys with a 4-1BB costimulatory domain, or third-generation CD19-CARconv or CD19-CARCys mRNA to generate NT- or CAR-T cells. A Twelve hours post-transduction, HER2-CAR expression levels of NT-, HER2-CARconv-, or HER2-CARCys-T cells were detected by flow cytometry. B NT-, HER2-CARconv- or HER2-CARCys-T cells were co-cultured with HER2K562 or HER2+N87. Twenty-four hours post-co-culture, IFN-γ production of these T cells were measured by ELISA. Data shown as mean ± SEM were from one of two independent experiments using two healthy donors. C CD107a translocation of NT-, HER2-CARconv-, or HER2-CARCys-T cells was detected by flow cytometry four hours post-co-culture. D Twelve hours post-co-culture, the cytotoxicity of NT-, HER2-CARconv-, or HER2-CARCys-T cells was analyzed by performing CCK8 assay after at indicated E: T ratios. Data shown as mean ± SEM were from one of two independent experiments using two healthy donors. E Twelve hours post-transduction, CD19-CAR expression levels of NT-, CD19-CARconv-, or CD19-CARCys-T cells were detected by flow cytometry. F, G NT-, CD19-CARconv-, or CD19-CARCys-T cells were co-cultured with CD19+Ramos for 12 h. CD25, CD69, CD95, and Perforin expression levels and cytokine production (TNF-α, IFN-γ) of these T cells were detected by flow cytometry. H NT-, CD19-CARconv-, or CD19-CARCys-T cells were co-cultured with CD19 K562 or CD19+ Ramos. CD107a translocation of NT, CD19-CARconv, or CD19-CARCys-T cells was detected by flow cytometry four hours post-co-culture. Data shown as mean ± SEM were pooled from two healthy donors. P values were determined by two-way ANOVA in (B, D, H). *P < 0.05, and **P < 0.01
Fig. 5
Fig. 5
CARCys-T cells have potent antitumor activity in HCC patient-derived primary tumor cells and organoids. A Human T cells derived from healthy donors were transduced with or without GPC3-CARconv or GPC3-CARCys mRNA to generate NT or GPC3-CAR-T cells. Twelve hours post-transduction, GPC3-CAR expression levels of these T cells were detected by flow cytometry. B NT-, GPC3-CARconv-, or GPC3-CARCys-T cells were co-cultured with GPC3 K562 or GPC3+ Huh7. Twenty-four hours post-co-culture, IFN-γ production of these T cells were measured by ELISA. Data shown as mean ± SEM were from one of two independent experiments using two healthy donors. C CD107a translocation of NT-, GPC3-CARconv-, or GPC3-CARCys-T cells was detected by flow cytometry four hours post-co-culture. D Six hours post-co-culture, the cytotoxicity of NT-, GPC3-CARconv-, or GPC3-CARCys-T cells was analyzed by performing CCK8 assay at indicated E: T ratios. Data shown as mean ± SEM were from one of two independent experiments using two healthy donors. E GPC3 expression level of primary tumor cells from HCC patient #3 was detected by flow cytometry. F Human T cells derived from HCC patient #3 were transduced with or without GPC3-CARconv or GPC3-CARCys mRNA to generate NT- or GPC3-CAR-T cells. Twelve hours post-transduction, GPC3-CAR expression levels of these T cells were detected by flow cytometry. G HCC patient #3-derived NT-, GPC3-CARconv-, or GPC3-CARCys-T cells were co-cultured with autologous primary tumor cells. Six hours post-co-culture, the apoptosis (Annexin V+ 7-AAD+) of primary tumor cells was analyzed by flow cytometry. H, I Primary tumor cells from HCC patient #5 were collected from pleural effusion and cultured in vitro to establish PDO. Thirty-three days later, EpCAM, CD44, CD133 and GPC3 expressions on PDO were detected by flow cytometry. J Human T cells derived from HCC patient #5 were transduced with or without GPC3-CARCys mRNA to generate NT- or GPC3-CARCys-T cells. Twelve hours post-transduction, GPC3-CAR expression levels of these T cells were detected by flow cytometry. K HCC patient #5-derived NT-, or GPC3-CARCys-T cells were co-cultured with autologous PDO. Six hours post-co-culture, the apoptosis (Annexin V+ 7-AAD+) of PDO was analyzed by flow cytometry. Data are shown as mean ± SEM; P values were determined by two-way ANOVA in (B, D, G, K). *P < 0.05, and **P < 0.01

Similar articles

Cited by

References

    1. June CH, Sadelain M. Chimeric antigen receptor therapy. N Engl J Med. 2018;379:64–73. doi: 10.1056/NEJMra1706169. - DOI - PMC - PubMed
    1. Jackson HJ, Rafiq S, Brentjens RJ. Driving CAR T-cells forward. Nat Rev Clin Oncol. 2016;13:370–383. doi: 10.1038/nrclinonc.2016.36. - DOI - PMC - PubMed
    1. Majzner RG, Mackall CL. Clinical lessons learned from the first leg of the CAR T cell journey. Nat Med. 2019;25:1341–1355. doi: 10.1038/s41591-019-0564-6. - DOI - PubMed
    1. Hong M, Clubb JD, Chen YY. Engineering CAR-T Cells for Next-Generation Cancer Therapy. Cancer Cell. 2020;38:473–488. doi: 10.1016/j.ccell.2020.07.005. - DOI - PubMed
    1. Sadelain M, Brentjens R, Riviere I. The basic principles of chimeric antigen receptor design. Cancer Discov. 2013;3:388–398. doi: 10.1158/2159-8290.CD-12-0548. - DOI - PMC - PubMed