

Measuring event segmentation: An investigation into the stability of event boundary agreement across groups
- PMID: 35441362
- PMCID: PMC9017965
- DOI: 10.3758/s13428-022-01832-5
Measuring event segmentation: An investigation into the stability of event boundary agreement across groups
Abstract
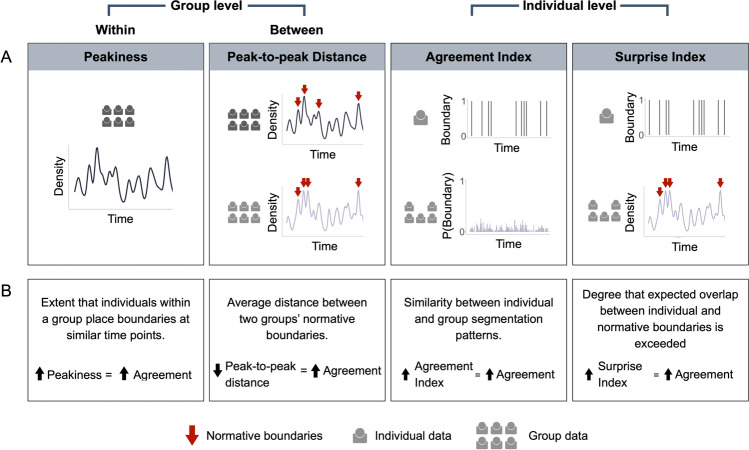
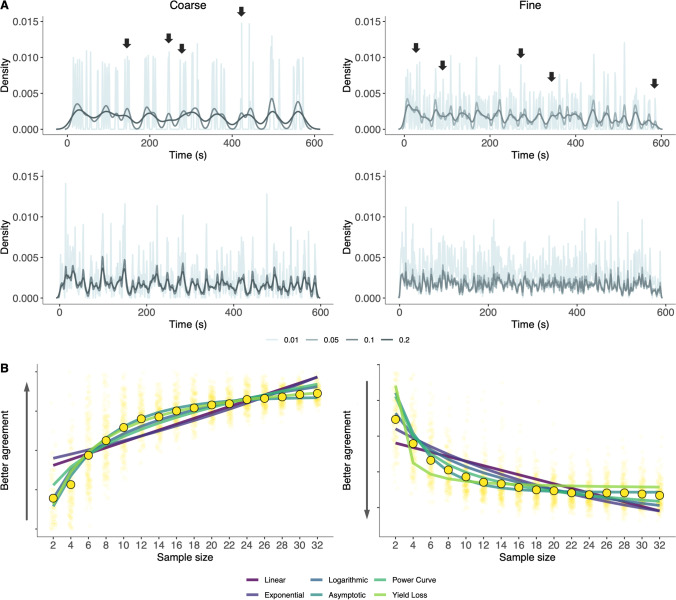
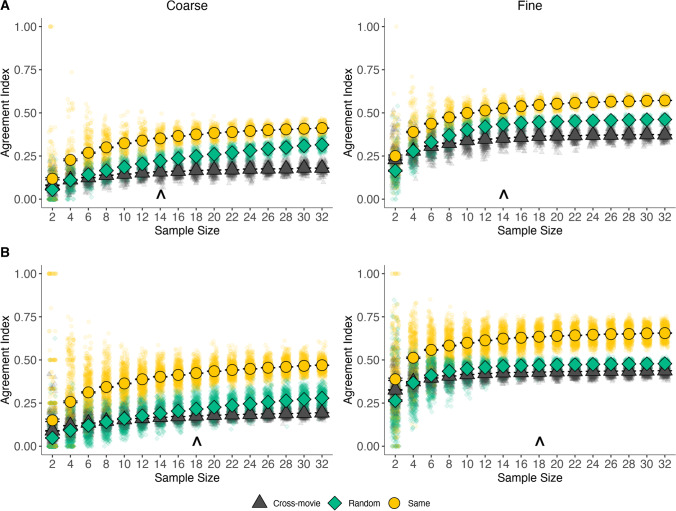
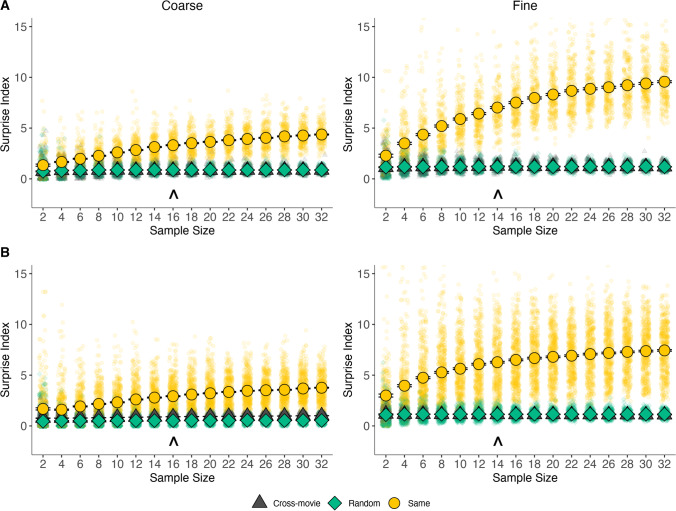
People spontaneously divide everyday experience into smaller units (event segmentation). To measure event segmentation, studies typically ask participants to explicitly mark the boundaries between events as they watch a movie (segmentation task). Their data may then be used to infer how others are likely to segment the same movie. However, significant variability in performance across individuals could undermine the ability to generalize across groups, especially as more research moves online. To address this concern, we used several widely employed and novel measures to quantify segmentation agreement across different sized groups (n = 2-32) using data collected on different platforms and movie types (in-lab & commercial film vs. online & everyday activities). All measures captured nonrandom and video-specific boundaries, but with notable between-sample variability. Samples of 6-18 participants were required to reliably detect video-driven segmentation behavior within a single sample. As sample size increased, agreement values improved and eventually stabilized at comparable sample sizes for in-lab & commercial film data and online & everyday activities data. Stabilization occurred at smaller sample sizes when measures reflected (1) agreement between two groups versus agreement between an individual and group, and (2) boundary identification between small (fine-grained) rather than large (coarse-grained) events. These analyses inform the tailoring of sample sizes based on the comparison of interest, materials, and data collection platform. In addition to demonstrating the reliability of online and in-lab segmentation performance at moderate sample sizes, this study supports the use of segmentation data to infer when events are likely to be segmented.
Keywords: Event cognition; Event segmentation; Naturalistic perception; Online data collection; Segmentation agreement.
© 2022. The Psychonomic Society, Inc.
Conflict of interest statement
The authors have no conflicts of interest to declare.
Figures


Similar articles
-
Individual differences in neural event segmentation of continuous experiences.Cereb Cortex. 2023 Jun 20;33(13):8164-8178. doi: 10.1093/cercor/bhad106. Cereb Cortex. 2023. PMID: 36994470 Free PMC article.
-
The Relationship between Event Boundary Strength and Pattern Shifts across the Cortical Hierarchy during Naturalistic Movie-viewing.J Cogn Neurosci. 2024 Nov 1;36(11):2317-2342. doi: 10.1162/jocn_a_02213. J Cogn Neurosci. 2024. PMID: 38991127 Free PMC article.
-
Rapid Memory Reactivation at Movie Event Boundaries Promotes Episodic Encoding.J Neurosci. 2019 Oct 23;39(43):8538-8548. doi: 10.1523/JNEUROSCI.0360-19.2019. Epub 2019 Sep 13. J Neurosci. 2019. PMID: 31519818 Free PMC article.
-
Subgroup analyses in randomised controlled trials: quantifying the risks of false-positives and false-negatives.Health Technol Assess. 2001;5(33):1-56. doi: 10.3310/hta5330. Health Technol Assess. 2001. PMID: 11701102 Review.
-
Event- and interval-based measurement of stuttering: a review.Int J Lang Commun Disord. 2015 Jan-Feb;50(1):14-30. doi: 10.1111/1460-6984.12113. Epub 2014 Jun 11. Int J Lang Commun Disord. 2015. PMID: 24919948 Review.
Cited by
-
Large language models can segment narrative events similarly to humans.Behav Res Methods. 2025 Jan 3;57(1):39. doi: 10.3758/s13428-024-02569-z. Behav Res Methods. 2025. PMID: 39751673
-
Neural state changes during movie watching relate to episodic memory in younger and older adults.Cereb Cortex. 2025 May 1;35(5):bhaf114. doi: 10.1093/cercor/bhaf114. Cereb Cortex. 2025. PMID: 40386868 Free PMC article.
-
Eye movements as predictors of student experiences during nursing simulation learning events.Cogn Res Princ Implic. 2025 Jul 1;10(1):37. doi: 10.1186/s41235-025-00640-7. Cogn Res Princ Implic. 2025. PMID: 40591191 Free PMC article.
-
People can reliably detect action changes and goal changes during naturalistic perception.Mem Cognit. 2024 Jul;52(5):1093-1111. doi: 10.3758/s13421-024-01525-8. Epub 2024 Feb 5. Mem Cognit. 2024. PMID: 38315292
-
Language-agnostic, Automated Assessment of Listeners' Speech Recall Using Large Language Models.Trends Hear. 2025 Jan-Dec;29:23312165251347131. doi: 10.1177/23312165251347131. Epub 2025 May 30. Trends Hear. 2025. PMID: 40448324 Free PMC article.
References
-
- Bates, D., Mächler, M., Bolker, B., & Walker, S. (2015). Fitting Linear Mixed-Effects Models Using lme4. Journal of Statistical Software, 67(1). 10.18637/jss.v067.i01
Publication types
MeSH terms
LinkOut - more resources
Full Text Sources
Research Materials
Miscellaneous
