. 2022 May;26(10):3046-3059.
doi: 10.1111/jcmm.17324. Epub 2022 Apr 20.

Therapeutic stem cell-derived alveolar-like macrophages display bactericidal effects and resolve Pseudomonas aeruginosa-induced lung injury

Affiliations

Therapeutic stem cell-derived alveolar-like macrophages display bactericidal effects and resolve Pseudomonas aeruginosa-induced lung injury

Sheena Bouch et al. J Cell Mol Med. 2022 May.

Abstract

Bacterial lung infections lead to greater than 4 million deaths per year with antibiotic treatments driving an increase in antibiotic resistance and a need to establish new therapeutic approaches. Recently, we have generated mouse and rat stem cell-derived alveolar-like macrophages (ALMs), which like primary alveolar macrophages (1'AMs), phagocytose bacteria and promote airway repair. Our aim was to further characterize ALMs and determine their bactericidal capabilities. The characterization of ALMs showed that they share known 1'AM cell surface markers, but unlike 1'AMs are highly proliferative in vitro. ALMs effectively phagocytose and kill laboratory strains of P. aeruginosa (P.A.), E. coli (E.C.) and S. aureus, and clinical strains of P.A. In vivo, ALMs remain viable, adapt additional features of native 1'AMs, but proliferation is reduced. Mouse ALMs phagocytose P.A. and E.C. and rat ALMs phagocytose and kill P.A. within the lung 24 h post-instillation. In a pre-clinical model of P.A.-induced lung injury, rat ALM administration mitigated weight loss and resolved lung injury observed seven days post-instillation. Collectively, ALMs attenuate pulmonary bacterial infections and promote airway repair. ALMs could be utilized as an alternative or adjuvant therapy where current treatments are ineffective against antibiotic-resistant bacteria or to enhance routine antibiotic delivery.

Keywords: alveolar macrophage; antibiotic resistance; bacterial lung injury; bactericidal effects; pluripotent stem cell.


Conflict of interest statement

The authors confirm that there are no conflicts of interest.

Figures
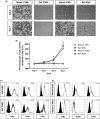
FIGURE 1
FIGURE 1
Characterization of rodent alveolar‐like macrophages. (A) Light micrographs representing the proliferation of mouse and rat primary isolated alveolar macrophages (1'AMs) and stem cell‐derived ALMs at Day 0 and Day 7 of culture. Images were taken at ×50 magnification. Scale bar is 150 μm. (B) Relative in vitro proliferation growth curves of mouse and rat ALMs compared with mouse and rat 1'AMs, respectively. Data are mean ± SEM, n = 3 separate experiments each with 3 technical triplicates. Statistically significant difference; * denotes p < 0.0001 between ALMs and 1'AMs. Data were expressed as a percentage gain in cell number to normalize for the variable attachment of cells observed in individual fields of view. (C) In vitro rat ALMs and 1'AMs express TLR2 and co‐express TLR4 and TLR5; (D) mouse in vitro ALMs express TLR2 and co‐express TLR4 and TLR5 whereas 1'AMs express TLR2 and TLR5 only. Black histograms; unstained control cells, white histograms; stained cells. All histograms are representative of n = 3–5 in vitro and in vivo experiments
FIGURE 2
FIGURE 2
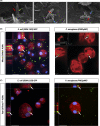
Alveolar‐like macrophages internalize live bacteria in vitro. (A) Scanning electron micrographs of mouse ALMs internalizing P.A. (PA01). ALM pseudopodia (green arrow) associate with a PA01 bacterium (red arrows) and PA01 bacterium is internalized by the phagocytic cup (blue arrows). Scale bars are 1 μm. (B) Confocal micrographs of DsRed‐expressing mouse ALMs (red) internalizing live GFP‐expressing E.C. (DSM 1103) and P.A. (PA01pMF) (green). E.C. image counterstained with DAPI (blue staining). A multi‐layered Z stack was performed to confirm internalization. White arrows indicate examples of internalized bacteria. Images were taken at ×200 magnification. Scale bars are 25 μm. Images are representative of two independent experiments. (C) Confocal micrographs of rat ALMs (stained with a CellTrace™ dye) internalizing live GFP‐expressing E.C. (DSM 1103) and P.A. (PA01pMF) (green). Images were counterstained with DAPI (blue staining). A multi‐layered Z stack was performed to confirm internalization. White arrows indicate internalized bacteria. Images were taken at ×200 magnification. Scale bars are 25 μm. Images are representative of two (or more) independent experiments
FIGURE 3
FIGURE 3
Bactericidal capacity of alveolar‐like macrophages to kill P. aeruginosa, E. coli, S. aureus and clinical respiratory strains of P. aeruginosa in vitro. Bacterial percentage killing for mouse (A) and rat (B) ALMs targeting live laboratory strains of E.C., P.A. and S.A. were determined using a GPA. Bacterial per cent killing for mouse (C) and rat (D) ALMs targeting various clinical P.A. strains that are either tobramycin sensitive and are eradicated by antibiotics (ER) or are resistant to tobramycin and persist with antibiotic treatment (PR) were determined using a GPA. Data in all panels are presented as mean ± SEM, n = 3–5 separate experiments each with technical triplicates. Statistical comparisons were made against the T0 time point (data not shown)
FIGURE 4
FIGURE 4
Alveolar‐like macrophages are viable but have reduced proliferative capacity in vivo. Mouse DsRed+ ALMs (A) and rat CellTrace™+ ALMs (B) are viable and proliferative, when cultured to 50% confluency in vitro prior to instillation. 24 h post in vivo instillation ALMs were collected via bronchoalveolar lavage fluid (BALF). The mouse DsRed+ ALM or rat CellTrace™+ ALM population in the BALF was separated from endogenous populations by flow cytometry. Mouse and rat ALMs retain their viability, but their proliferative capacity is diminished. Data in both panels are presented as mean ± SEM. Black histograms; unstained control cells, white histograms; stained cells. (A) and (B) histograms represent one of n = 3 for in vitro cultures and n = 4 separate in vivo ALM instillations. (C) Flow cytometry of mouse in vitro ALMs, and ALMs and primary BALF cells three days post‐instillation in mice for known M1/M2 polarization markers and siglec‐F. (D) Flow cytometry of rat in vitro ALMs, and ALMs and primary BALF cells three days post‐instillation in rats for known M1/M2 polarization markers. (C) and (D) Data are presented as mean ± SEM, n = 3–6 per experimental group
FIGURE 5
FIGURE 5
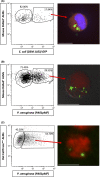
Alveolar‐like macrophages display bactericidal effects in vivo by internalizing P. aeruginosa and E. coli. Adult mice and rats were infected intratracheally with either live GFP‐expressing E.C. and/or P.A. Thirty minutes post‐infection, mice and rats were instilled intratracheally with mouse DsRed+ ALMs or rat CellTrace™+ ALMs, respectively. Three hours following the initial infection mice and rats were sacrificed and BALF cells were collected. (A) Flow cytometry on DsRed+/GFP+ of BALF cells from mice instilled with GFP‐expressing E.C. (B) Flow cytometry on DsRed+/GFP+ of BALF cells from mice infected with GFP‐expressing P.A. (C) Flow cytometry on CellTrace™+/GFP+ of BALF cells from rats infected with GFP‐expressing P.A. All flow cytometry gating strategies were performed on ALM only controls (data not shown). Respective corresponding confocal micrographs show composite confocal images with GFP bacteria within the red ALMs. Mouse DsRed+ ALMs + GFP‐expressing E.C. was counterstained with DAPI. All images were taken at ×200 magnification. Scale bars are 10 μm (A, B and C). Black histograms; unstained control cells, white histograms; stained cells (A), (B) and (C) histograms represent one of n = 3–4 separate in vivo ALM instillations
FIGURE 6
FIGURE 6
Alveolar‐like macrophages display bactericidal effects in vivo towards P. aeruginosa. Adult rats were infected intratracheally with GFP‐expressing P.A. Thirty minutes post‐instillation, rats were instilled intratracheally with CellTrace™ labelled ALMs or DPBS. Either 3 h (T0) or 27 h (T24) following instillation BALF was collected and cells were treated with gentamycin. (A) BALF cells collected at T0 and T24 were separated by FACS into CellTrace™+ ALMs or CellTrace™ primary BALF cells (CellTrace™+ ALMs highlighted as red on scatter plot). (B) A GPA was performed on CellTrace™+ ALMs (red bar) and CellTrace™ primary BALF cells (grey bar) demonstrating that CellTrace™+ ALMs were effectively killing P.A. in vivo over 24 h. Data are presented as mean ± SEM, n = 3 separate in vivo ALM instillations. (C) Light micrographs of ALMs associating with neutrophils post‐P.A. infection. Phagocytosis is indicated by the red arrows. All images were taken at ×670 magnification. Scale bars are 10 μm
FIGURE 7
FIGURE 7
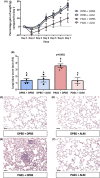
Alveolar‐like macrophages resolve P. aeruginosa‐induced lung injury in vivo. Adult rats were infected intratracheally with P.A. or DPBS. Six hours post‐instillation, rats were instilled intratracheally with either ALMs or DPBS. Rats were weighed daily, and histological analysis was performed at Day 7 post‐instillation. (A) Rats in the PA01 + DPBS group was lighter than the DPBS + DPBS and DPBS + ALM groups by Day 4 and all three experimental groups by Day 5 onwards. Data are mean ± SEM, n = 3–4 rats per experimental group. Statistically significant difference; * denotes p < 0.05 between experimental groups in a Tukey's post hoc test. Data were expressed as a percentage gain in body weight to normalize for the variable starting weights (pre‐instillation). (B) Lung histological analysis demonstrated that the injury score was significantly greater in the PA01 + DPBS group compared to the other three experimental groups, with no differences observed between the other groups. Data are mean ± SEM, n = 3–4 rats per experimental group. Experimental groups with different letters (above the bar) are significantly different from each other. (C–F) Representative histological images of DPBS + DPBS, DPBS + ALM, PA01 + DPBS and PA01 + ALM groups, respectively. Images were taken at ×200 magnification. Scale bars are 50 μm. Images are representative of 3–4 rats per experimental group

Similar articles

Cited by

References

    1. Ferkol T, Schraufnagel D. The global burden of respiratory disease. Ann Am Thorac Soc. 2014;11:404‐406. - PubMed
    1. Ciofu O, Hansen CR, Høiby N. Respiratory bacterial infections in cystic fibrosis. Curr Opin Pulm Med. 2013;19:251‐258. - PubMed
    1. Sims KD, Blumberg EA. Common infections in the lung transplant recipient. Clin Chest Med. 2011;32:327‐341. - PMC - PubMed
    1. Raju R, Peters BS, Breen RAM. Lung infections in the HIV‐infected adult. Curr Opin Pulm Med. 2012;18:253‐258. - PubMed
    1. Pragman AA, Berger JP, Williams BJ. Understanding persistent bacterial lung infections: clinical implications informed by the biology of the microbiota and biofilms. Clin Pulm Med. 2016;23:57‐66. - PMC - PubMed

Publication types

Substances

LinkOut - more resources