. 2022 Jun 21;28(35):e202200734.
doi: 10.1002/chem.202200734. Epub 2022 May 12.

Photoactivatable V-Shaped Bifunctional Quinone Methide Precursors as a New Class of Selective G-quadruplex Alkylating Agents

Affiliations

Photoactivatable V-Shaped Bifunctional Quinone Methide Precursors as a New Class of Selective G-quadruplex Alkylating Agents

Alberto Lena et al. Chemistry. .

Abstract

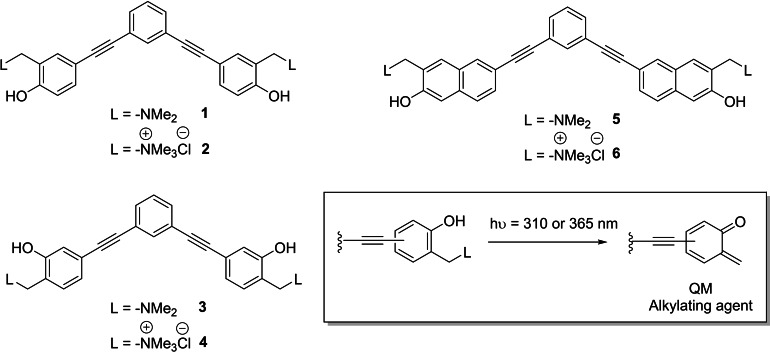
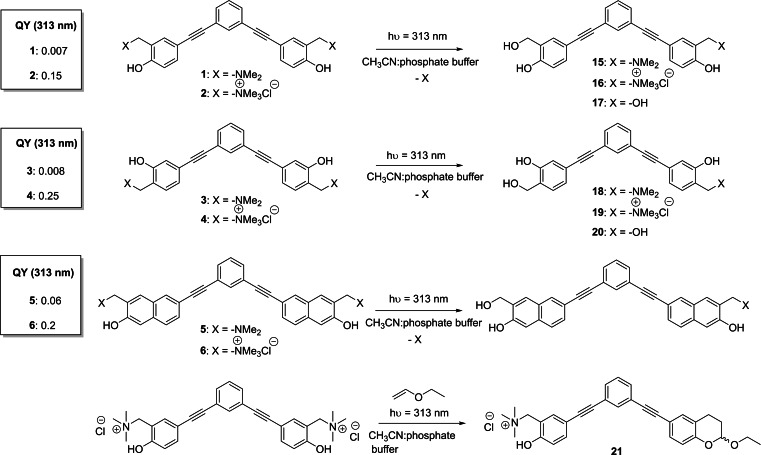
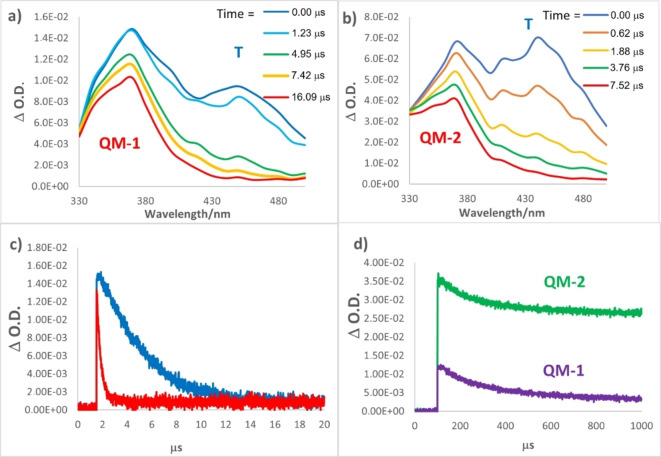
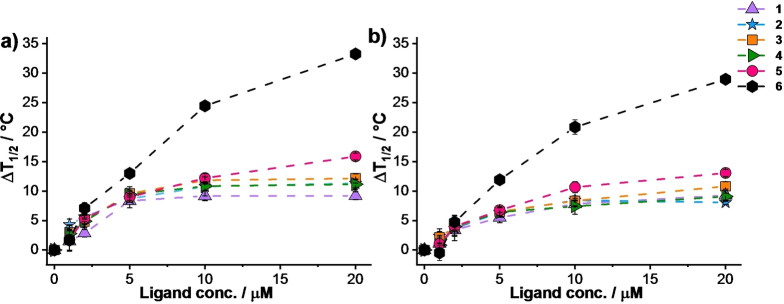
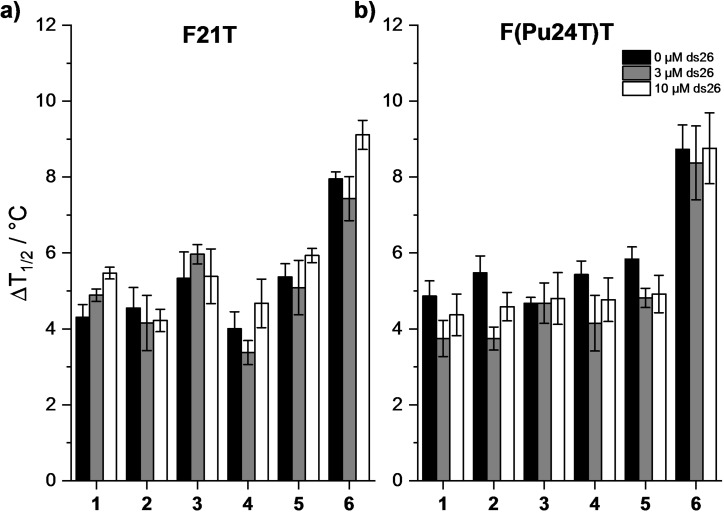
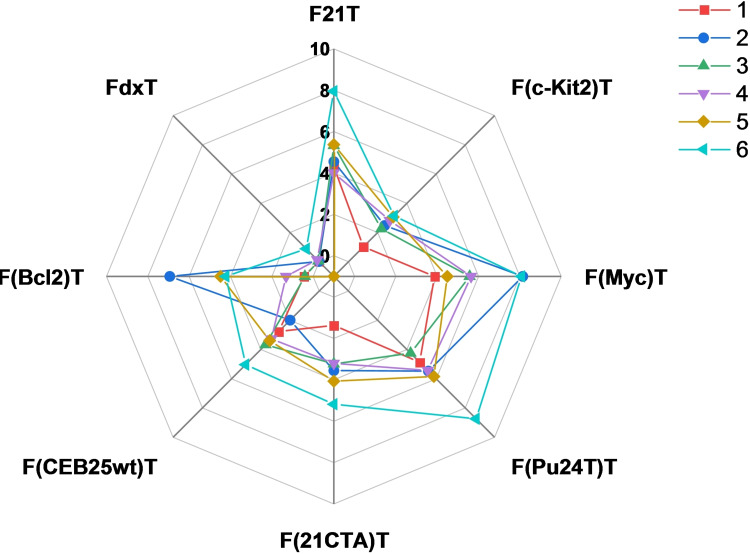
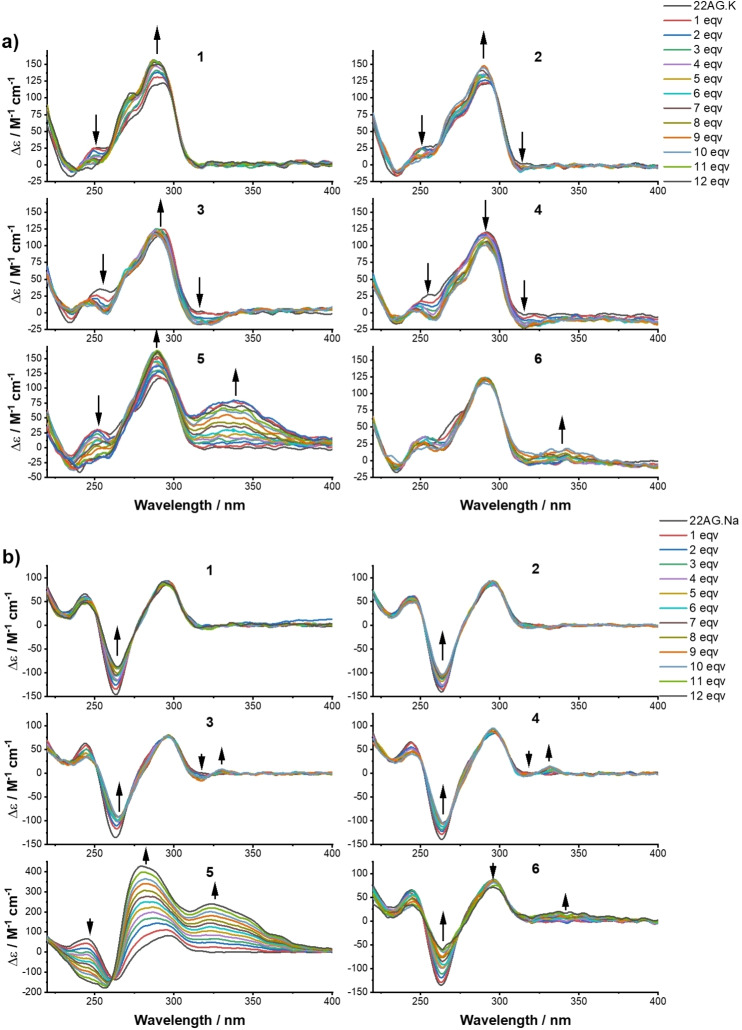
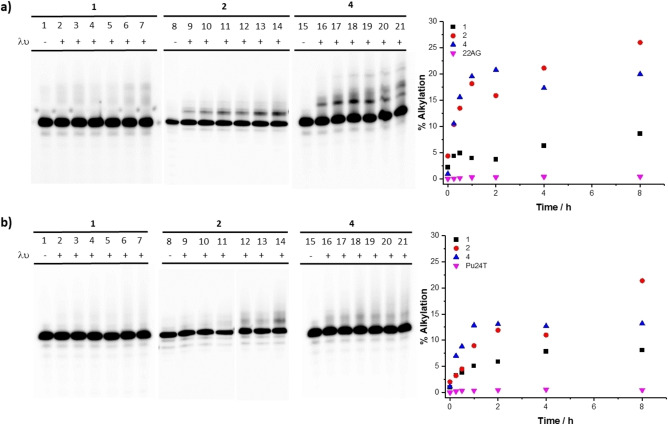
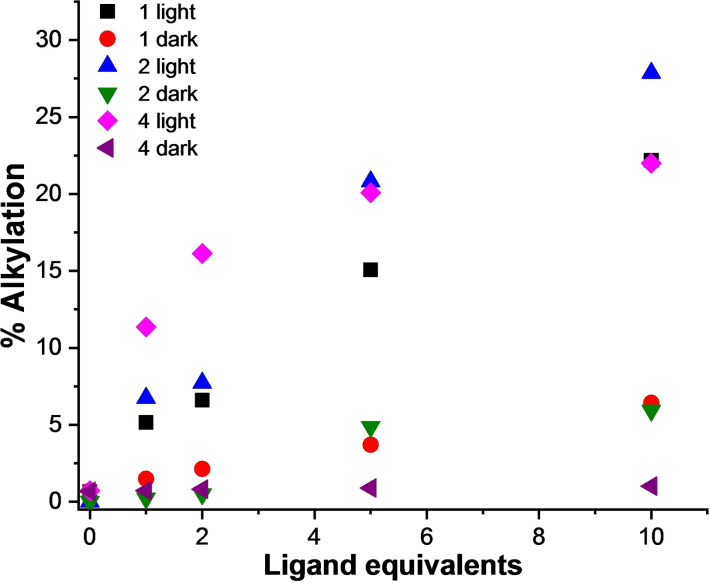
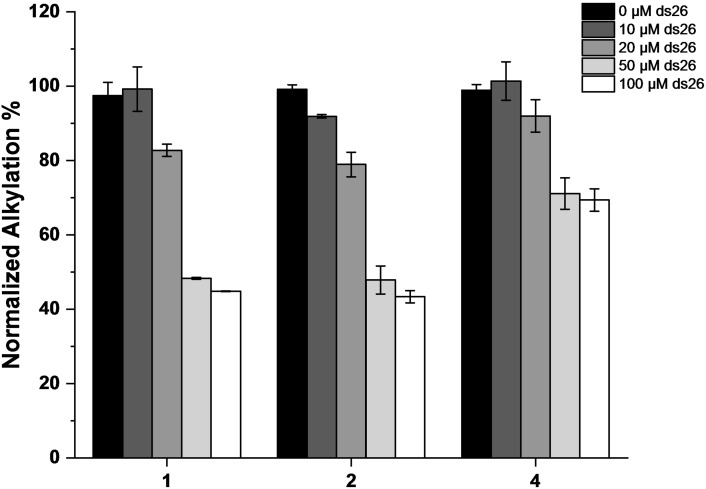
Combining the selectivity of G-quadruplex (G4) ligands with the spatial and temporal control of photochemistry is an emerging strategy to elucidate the biological relevance of these structures. In this work, we developed six novel V-shaped G4 ligands that can, upon irradiation, form stable covalent adducts with G4 structures via the reactive intermediate, quinone methide (QM). We thoroughly investigated the photochemical properties of the ligands and their ability to generate QMs. Subsequently, we analyzed their specificity for various topologies of G4 and discovered a preferential binding towards the human telomeric sequence. Finally, we tested the ligand ability to act as photochemical alkylating agents, identifying the covalent adducts with G4 structures. This work introduces a novel molecular tool in the chemical biology toolkit for G4s.

Keywords: cross-linking agents, G-quadruplexes, G4 ligands, photochemistry, quinone methides.


Conflict of interest statement

The authors declare no conflict of interest.

Figures

Scheme 1
Scheme 1
Structures of the novel water‐soluble extended aromatic G4 ligands characterized by a planar V‐shaped rigid scaffold functionalized with photoactivatable QM precursors. Inset: general photogeneration of o‐QM intermediate.
Scheme 2
Scheme 2
Synthesis of V‐shaped bifunctional o‐QMPs 14.
Scheme 3
Scheme 3
Synthesis of V‐shaped bifunctional QMPs 5 and 6 with a 1,3‐bis(naphthalen‐2‐ylethynyl)benzene structure.
Scheme 4
Scheme 4
QMP photoreactivity and related quantum yields (QYs).
Figure 1
Figure 1
Transient absorption spectra of a) 1 and b) 2 10−4 M CH3CN solutions, purged with Ar, irradiated at 266 nm by LFP. c) Decay traces monitored at 470 nm of CH3CN solutions of 1 in presence of Ar (blue line) or O2 (red line); d) decay traces of solutions of 1 (violet line) and 2 (green line) monitored at 370 nm, in the presence of O2.
Figure 2
Figure 2
Quantitative ΔT 1/2 dependence of a) F21T and b) F(Pu24T)T as a function of putative ligand concentrations. Conditions: a) DNA 0.2 μM, Li Caco 10 mM (pH 7.2), LiCl 90 mM and KCl 10 mM; b) DNA 0.2 μM, Li Caco 10 mM (pH 7.2), LiCl 99 mM and KCl 1 mM. Compounds 16 were employed at concentration ranging between 0 μM and 20 μM.
Figure 3
Figure 3
FRET‐melting competition assay with a) F21T and b) F(Pu24T)T in the absence and in the presence of double‐stranded DNA competitor (ds26). Conditions: F21T or F(Pu24T)T 0.2 μM, compounds 2 μM, ds26 0, 3, or 10 μM (black, dark gray and white bars, respectively) (a) Li Caco 10 mM (pH 7.2), LiCl 90 mM and KCl 10 mM and (b) Li Caco 10 mM (pH 7.2), LiCl 99 mM and KCl 1 mM. Analyzed compounds 1–6.
Figure 4
Figure 4
Quantitative analysis of FRET‐melting experiments in the presence of F21T, F(c‐kit2)T, F(Myc)T, F(Pu24T)T, F(21CTA)T, F(CEB25wt)T, F(Bcl2)T and FdxT (0.2 μM) represented with a radar graph. Stabilization in Li Caco 10 mM (pH 7.2), LiCl 99 mM and KCl 1 mM for F(c‐kit2)T, F(Myc)T, F(Pu24T)T, F(CEB25wt)T and F(Bcl2)T and in Li Caco 10 mM (pH 7.2), LiCl 90 mM and KCl 10 mM for F21T, F(21CTA)T and FdxT is indicated for analysed compounds 16 (2 μM).
Figure 5
Figure 5
Change in the CD spectra of 22AG (3 μM) upon addition of increasing concentration of ligands 16: a) in 10 mM Li Caco (pH 7.2), 100 mM KCl, and b) in 10 mM Li Caco (pH 7.2), 100 mM NaCl. Titration experiments for compounds 24 and 6 (only in K+‐rich buffer for the latter) were stopped after the addition of 10 eqv. of ligand.
Figure 6
Figure 6
Denaturing gel electrophoresis (15 % acrylamide) of the alkylation products of a) 22AG and b) Pu24T (10 μM) in the presence of K+ buffer (10 mM Li Caco (pH 7.2), 100 mM KCl) with 1, 2, and 4 (20 μM) at increasing irradiation time (0, 0.25, 0.5, 1, 2, 4, and 8 h). Lanes 1, 8, and 15 are control experiments showing the effect in the absence of irradiation with a) 22AG and b) Pu24T. Lanes 2–7 show the results of irradiation of 22AG and Pu24T at 365 nm in the presence of 2 equiv. of 1, lanes 9–14 show the results of irradiation of 22AG and Pu24T at 365 nm in the presence of 2 equiv. of 2, and lanes 16–21 show the results of irradiation of 22AG and Pu24T at 365 nm in the presence of 2 equiv. of 4 during 0.25, 0.5, 1, 2, 4, and 8 h. On the right, quantitative analysis of the alkylation of a) the telomeric sequence 22AG and b) Pu24T oncogene (10 μM) at increasing irradiation time (0, 0.25, 0.5, 1, 2, 4, and 8 h) in the presence of 1, 2, and 4 (20 μM) or in the absence of ligand (22AG and Pu24T).
Figure 7
Figure 7
Quantitative analysis of the alkylation of the telomeric sequence 22AG (10 μM, 10 mM Li Caco (pH 7.2), 100 mM KCl) by 1, 2, and 4 (10, 20, 50, and 100 μM) in the presence and in the absence of irradiation.
Figure 8
Figure 8
Quantitative analysis of the alkylation of the human telomeric sequence 22AG (10 μM, 10 mM Li Caco (pH 7.2), 100 mM KCl) by 1, 2, and 4 (20 μM) in the absence (black bars) or in the presence of ds26 competitor (10, 20, 50, and 100 μM) (from dark gray to white bars).
Figure 9
Figure 9
a) Chromatographic profile (recorded at 260 nm) of the crude reaction mixture obtained for compound 2 using a gradient from 0 % to 50 % CH3CN in 10 mM TEAA buffer at 50 °C. Insets: UV spectra extracted for each chromatographic peak; the adduct‐containing DNA shows a specific absorbance at 320 nm. b) MALDI‐ToF mass spectrum of the collected product eluted at 15.6 min and schematic representation of the covalent products produced by photoactivation of compound 2 in the presence of 22AG. (Figure 9 has been slightly modified and has been re‐submitted as a separated .png file. We simply removed the square around Figure 9a and improve the Y axes to make it more readeble)

Similar articles

Cited by

References

    1. Bochman M. L., Paeschke K., Zakian V. A., Nat. Rev. Genet. 2012, 13, 770. - PMC - PubMed
    1. Collie G. W., Parkinson G. N., Chem. Soc. Rev. 2011, 40, 5867–5892. - PubMed
    1. Lipps H. J., Rhodes D., Trends Cell Biol. 2009, 19, 414–422. - PubMed
    1. Rhodes D., Lipps H. J., Nucleic Acids Res. 2015, 43, 8627–8637. - PMC - PubMed
    1. Spiegel J., Adhikari S., Balasubramanian S., Trends Chem. 2020, 2, 123–136. - PMC - PubMed

LinkOut - more resources