. 2022 May 16;14(18):6866-6875.
doi: 10.1039/d1nr08002d.

Discrimination of RNA fiber structures using solid-state nanopores

Affiliations

Discrimination of RNA fiber structures using solid-state nanopores

Prabhat Tripathi et al. Nanoscale. .

Abstract

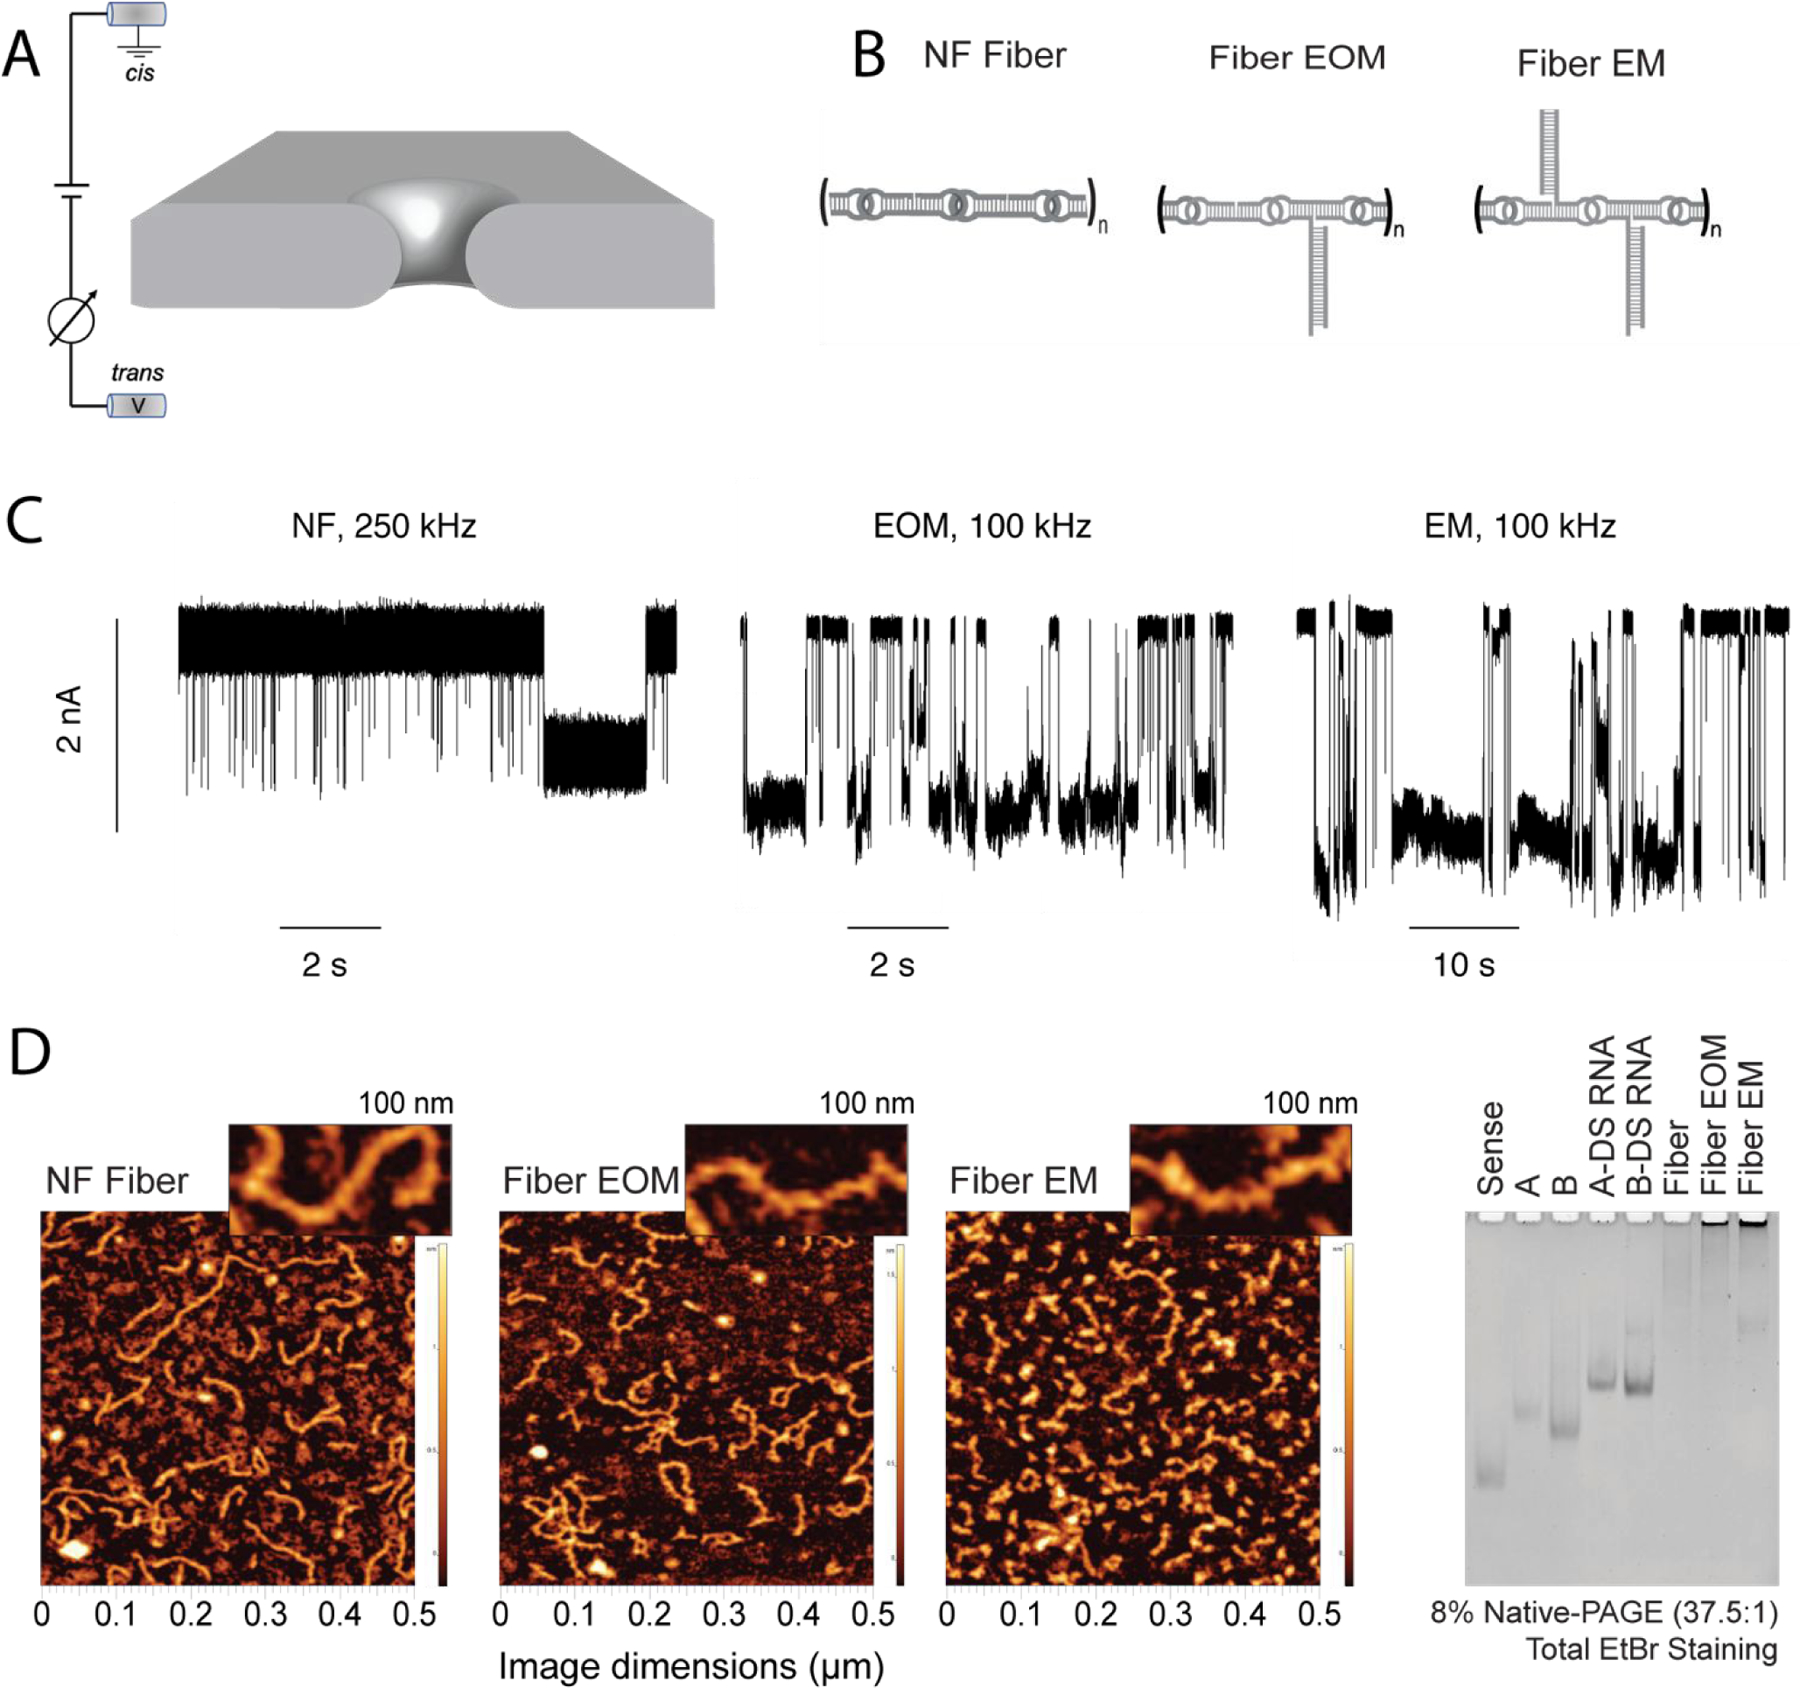
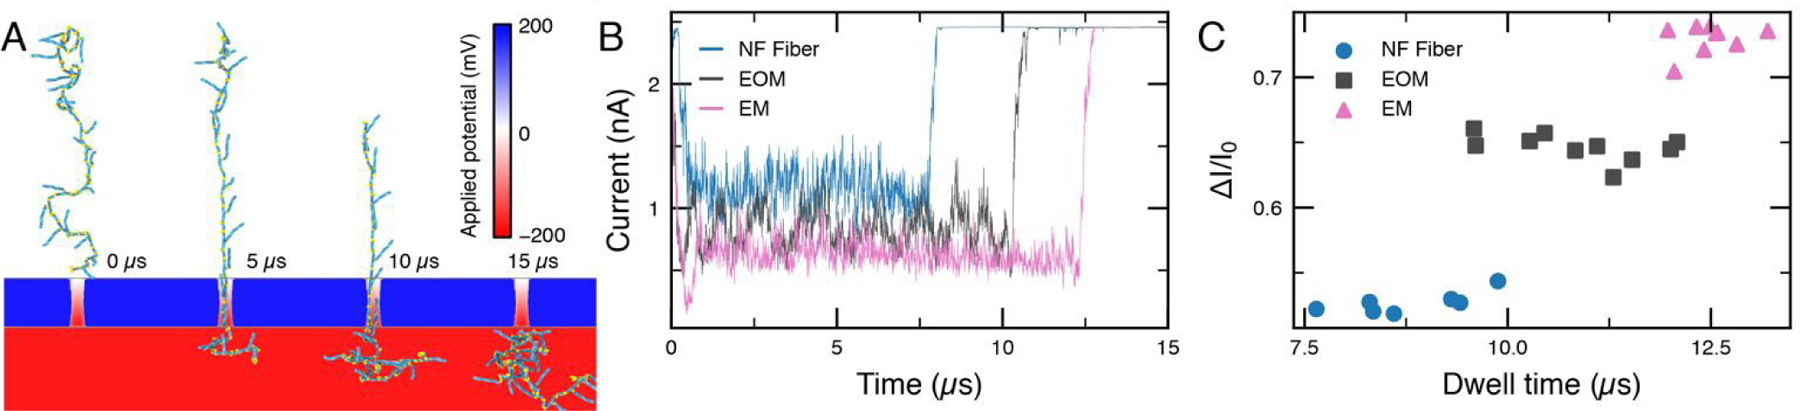
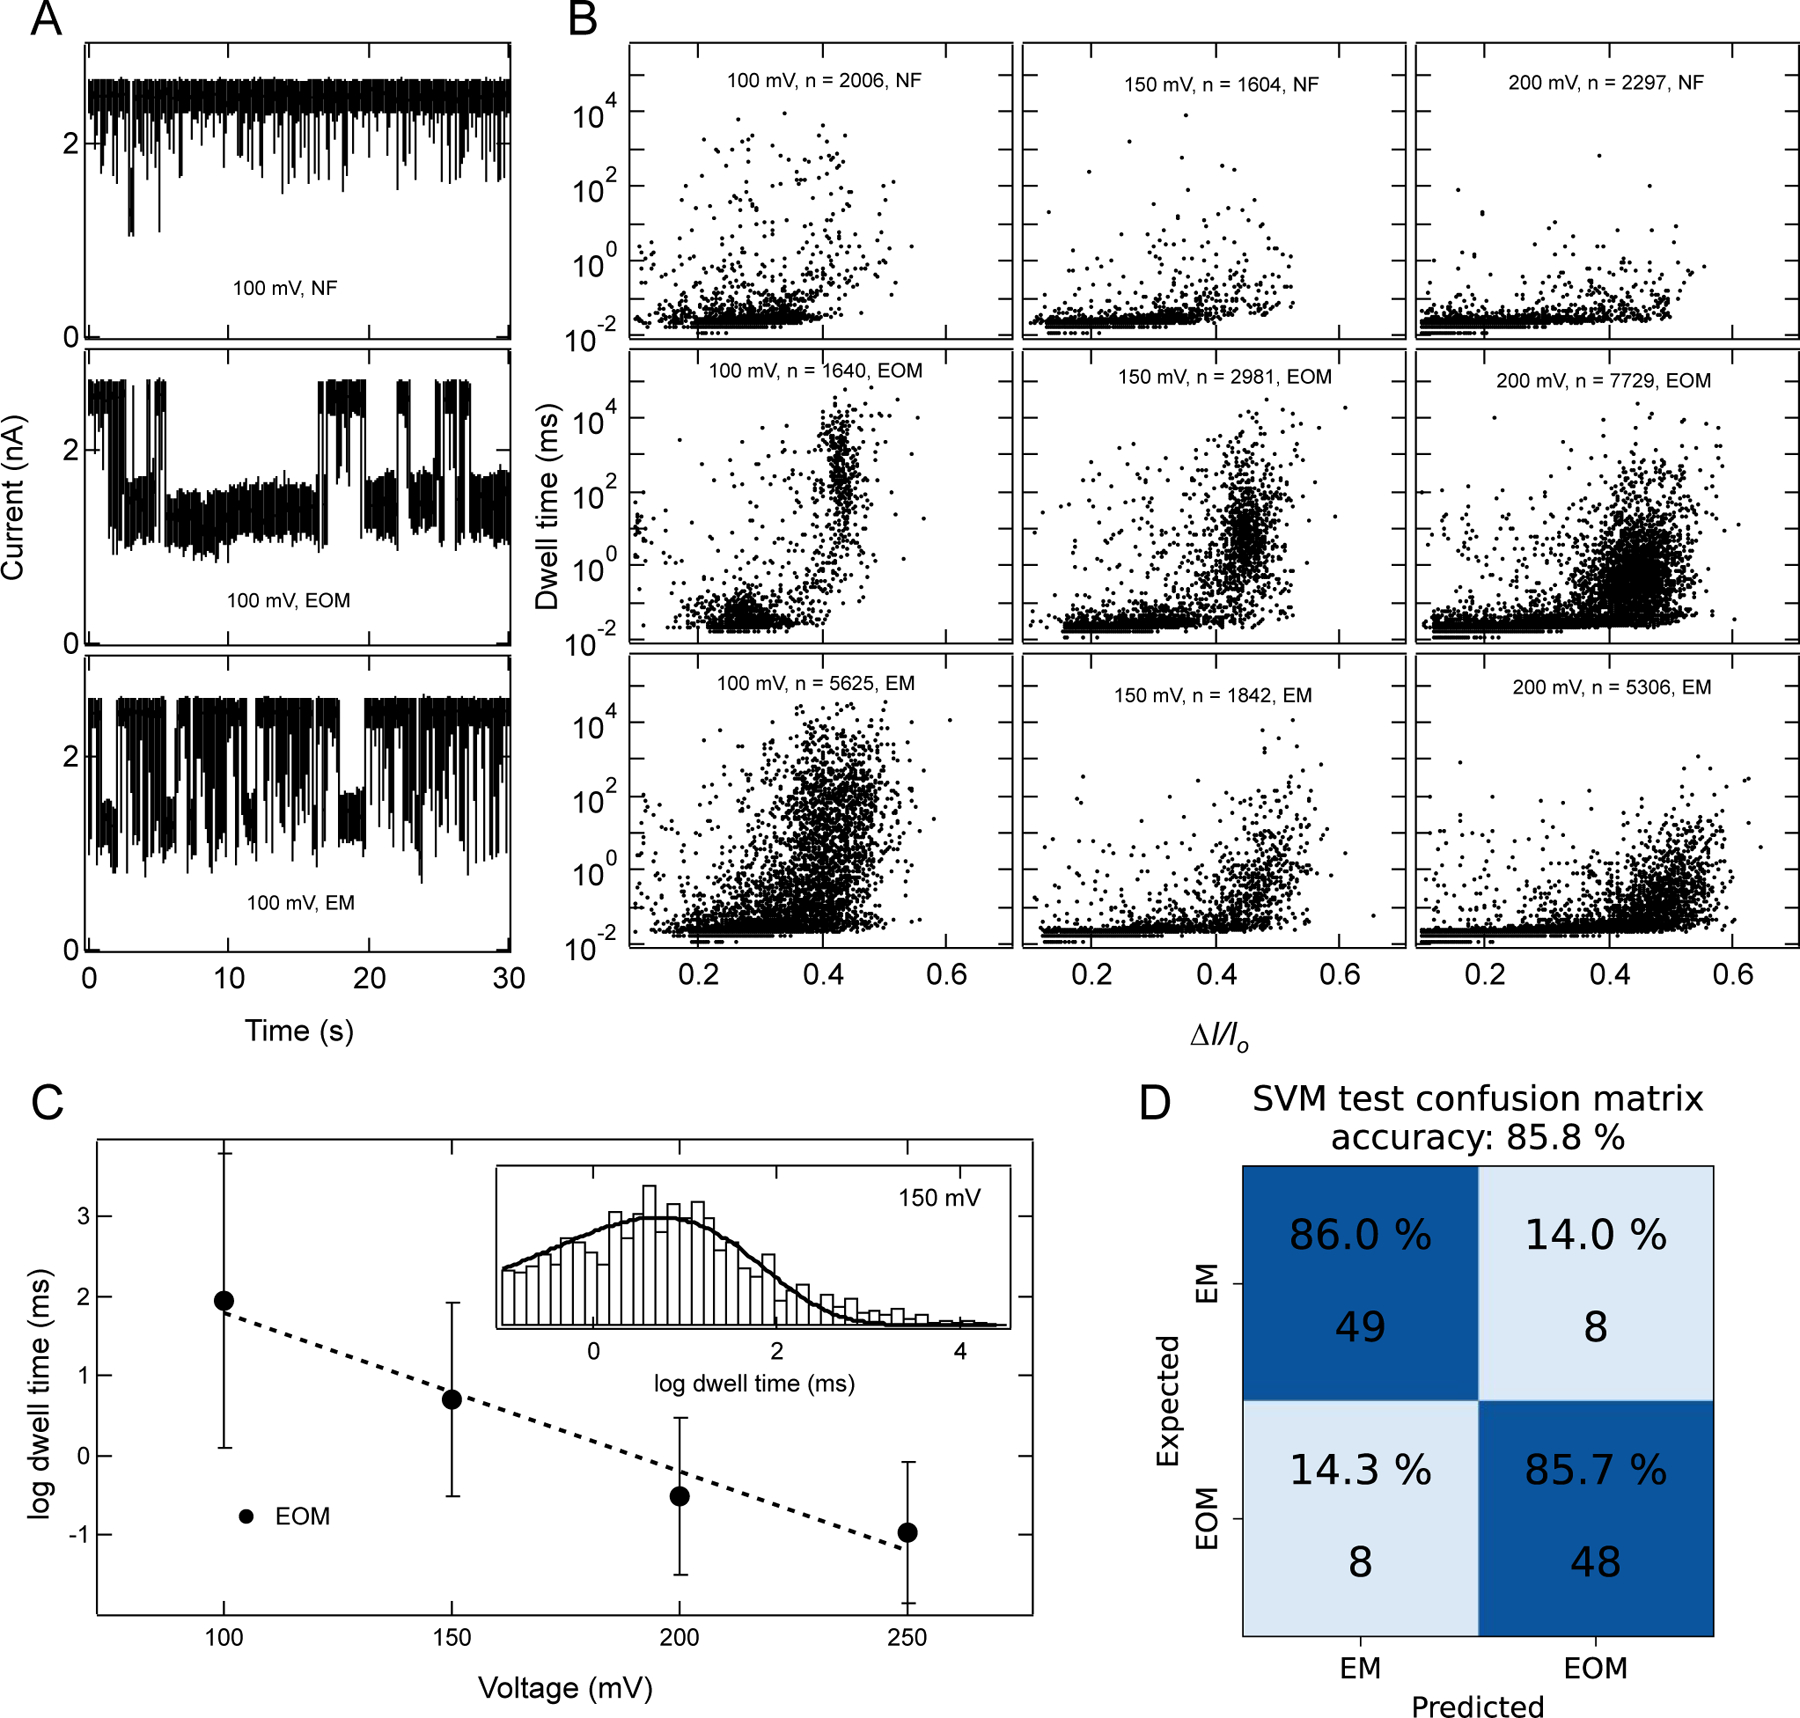
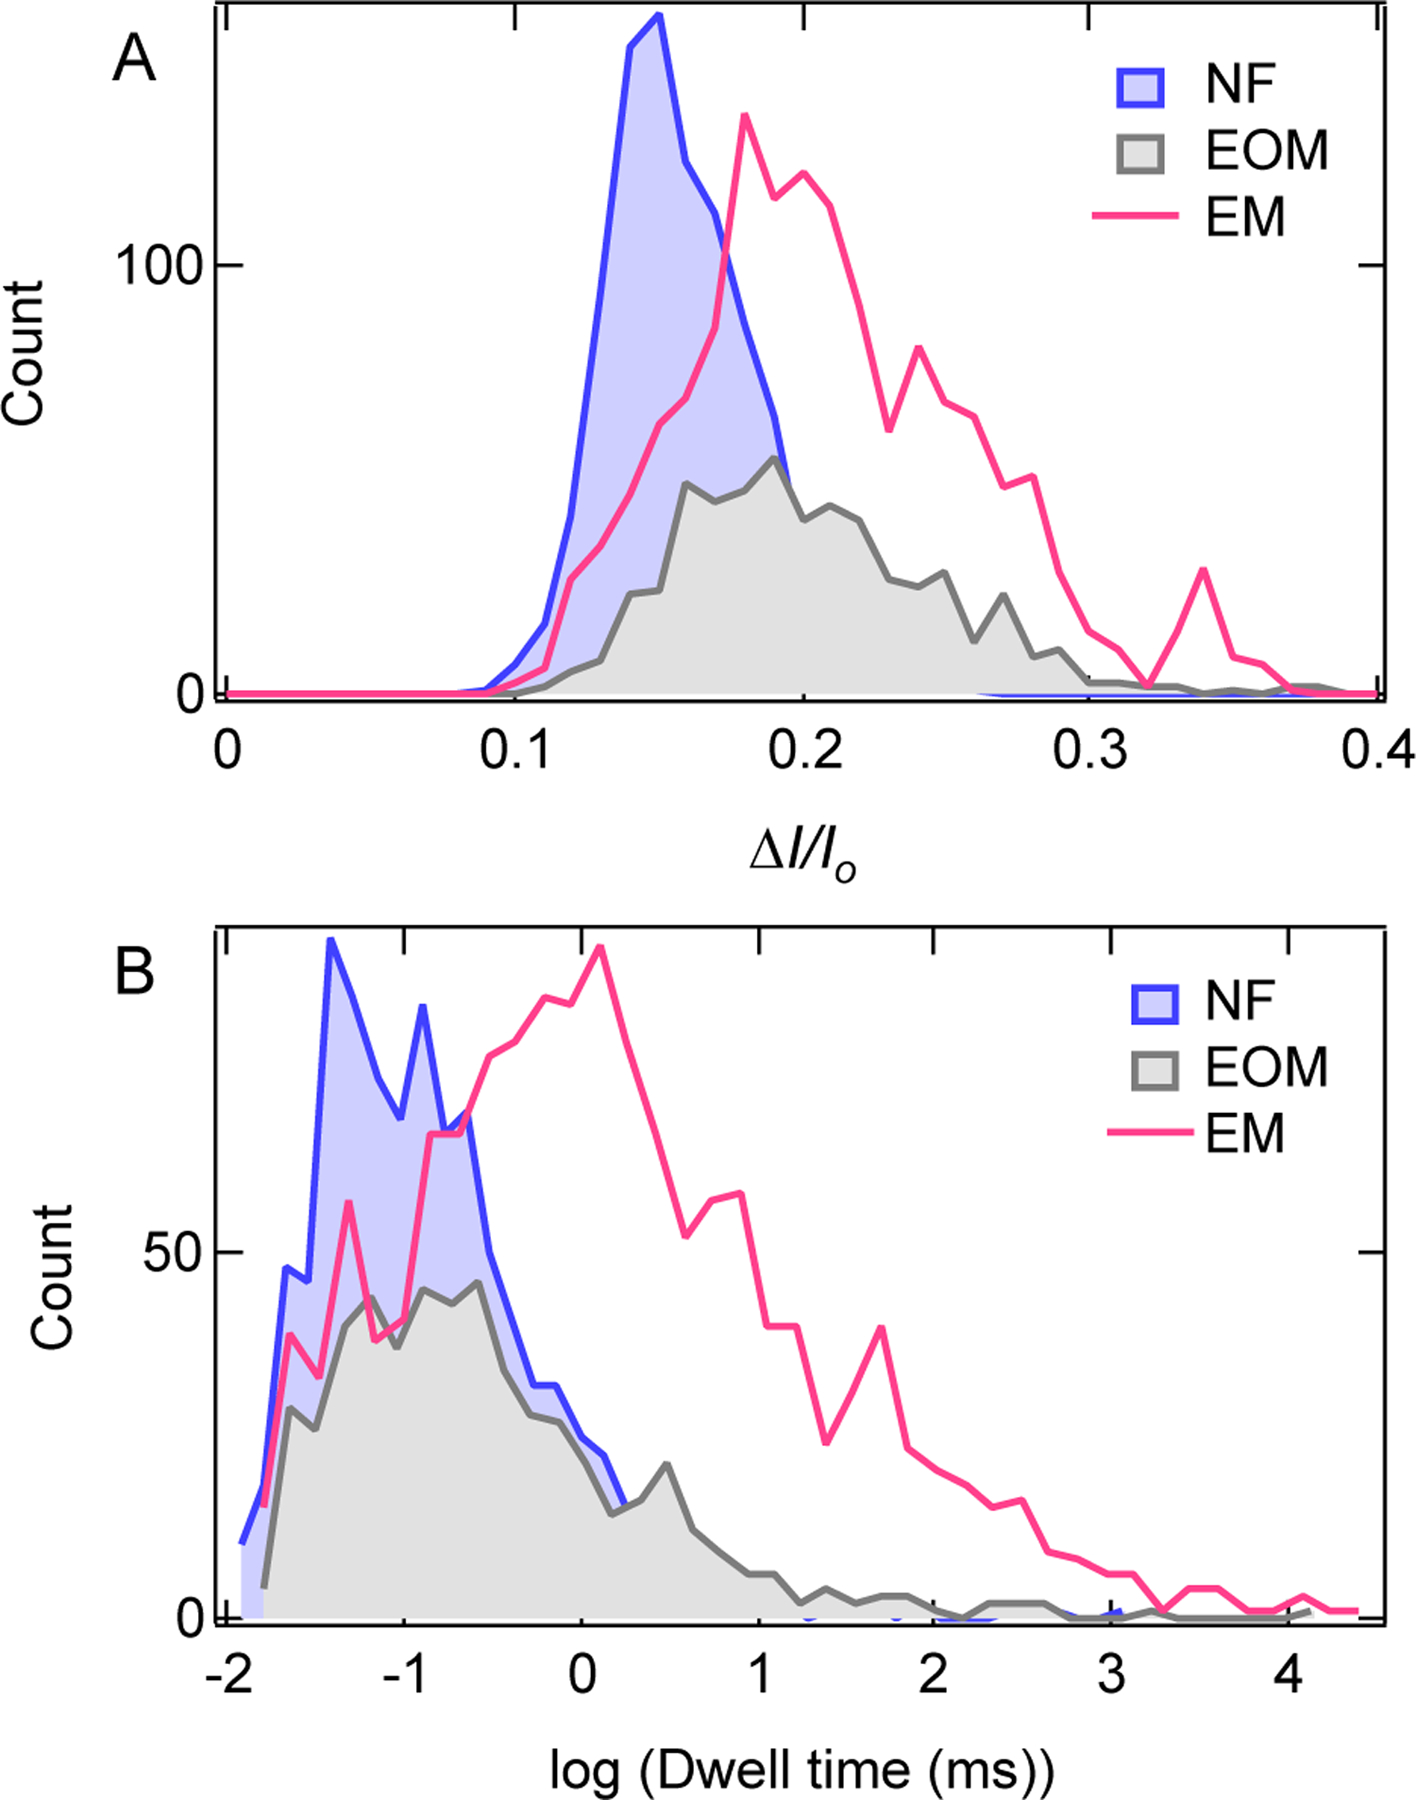
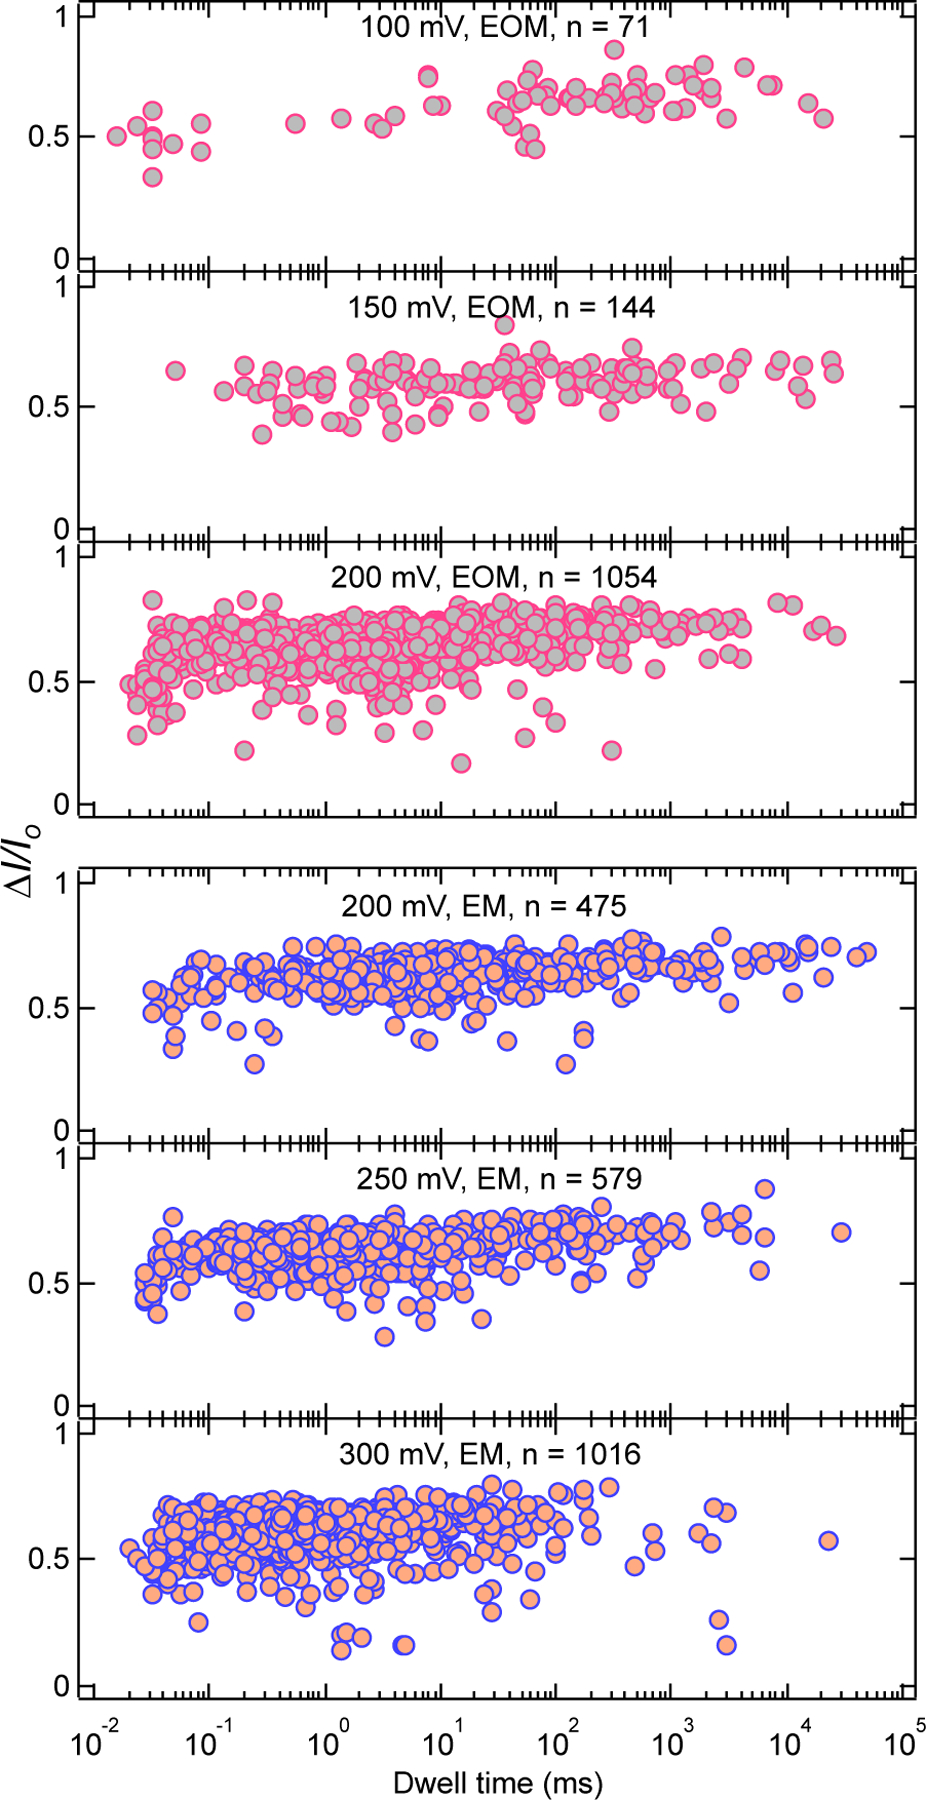
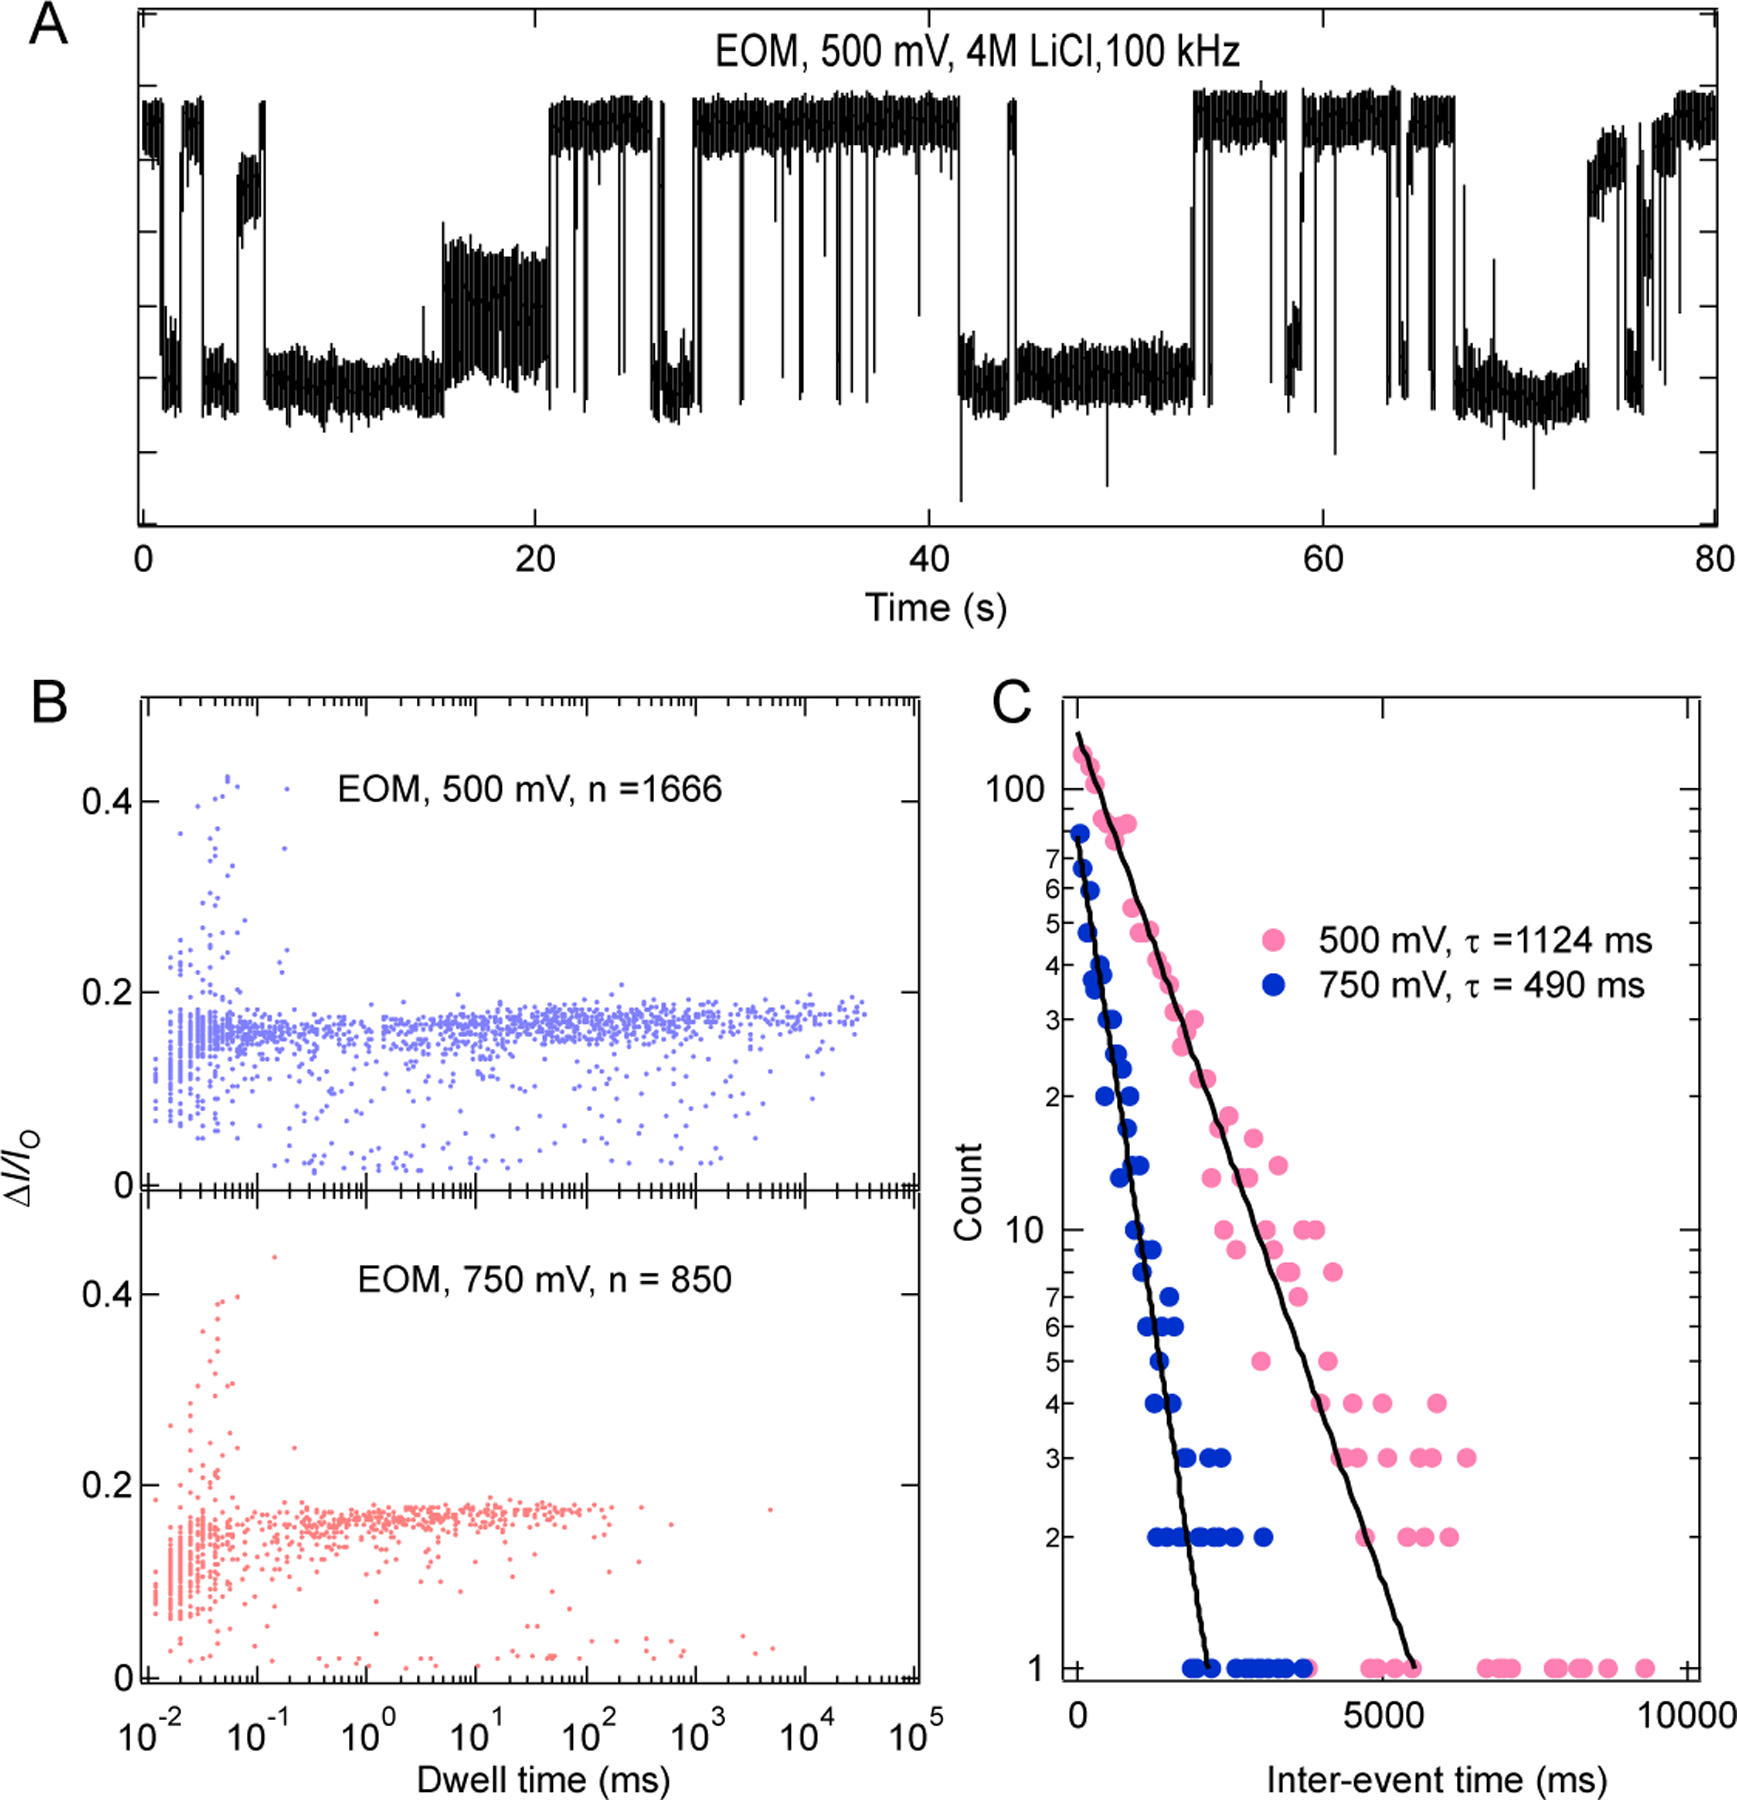
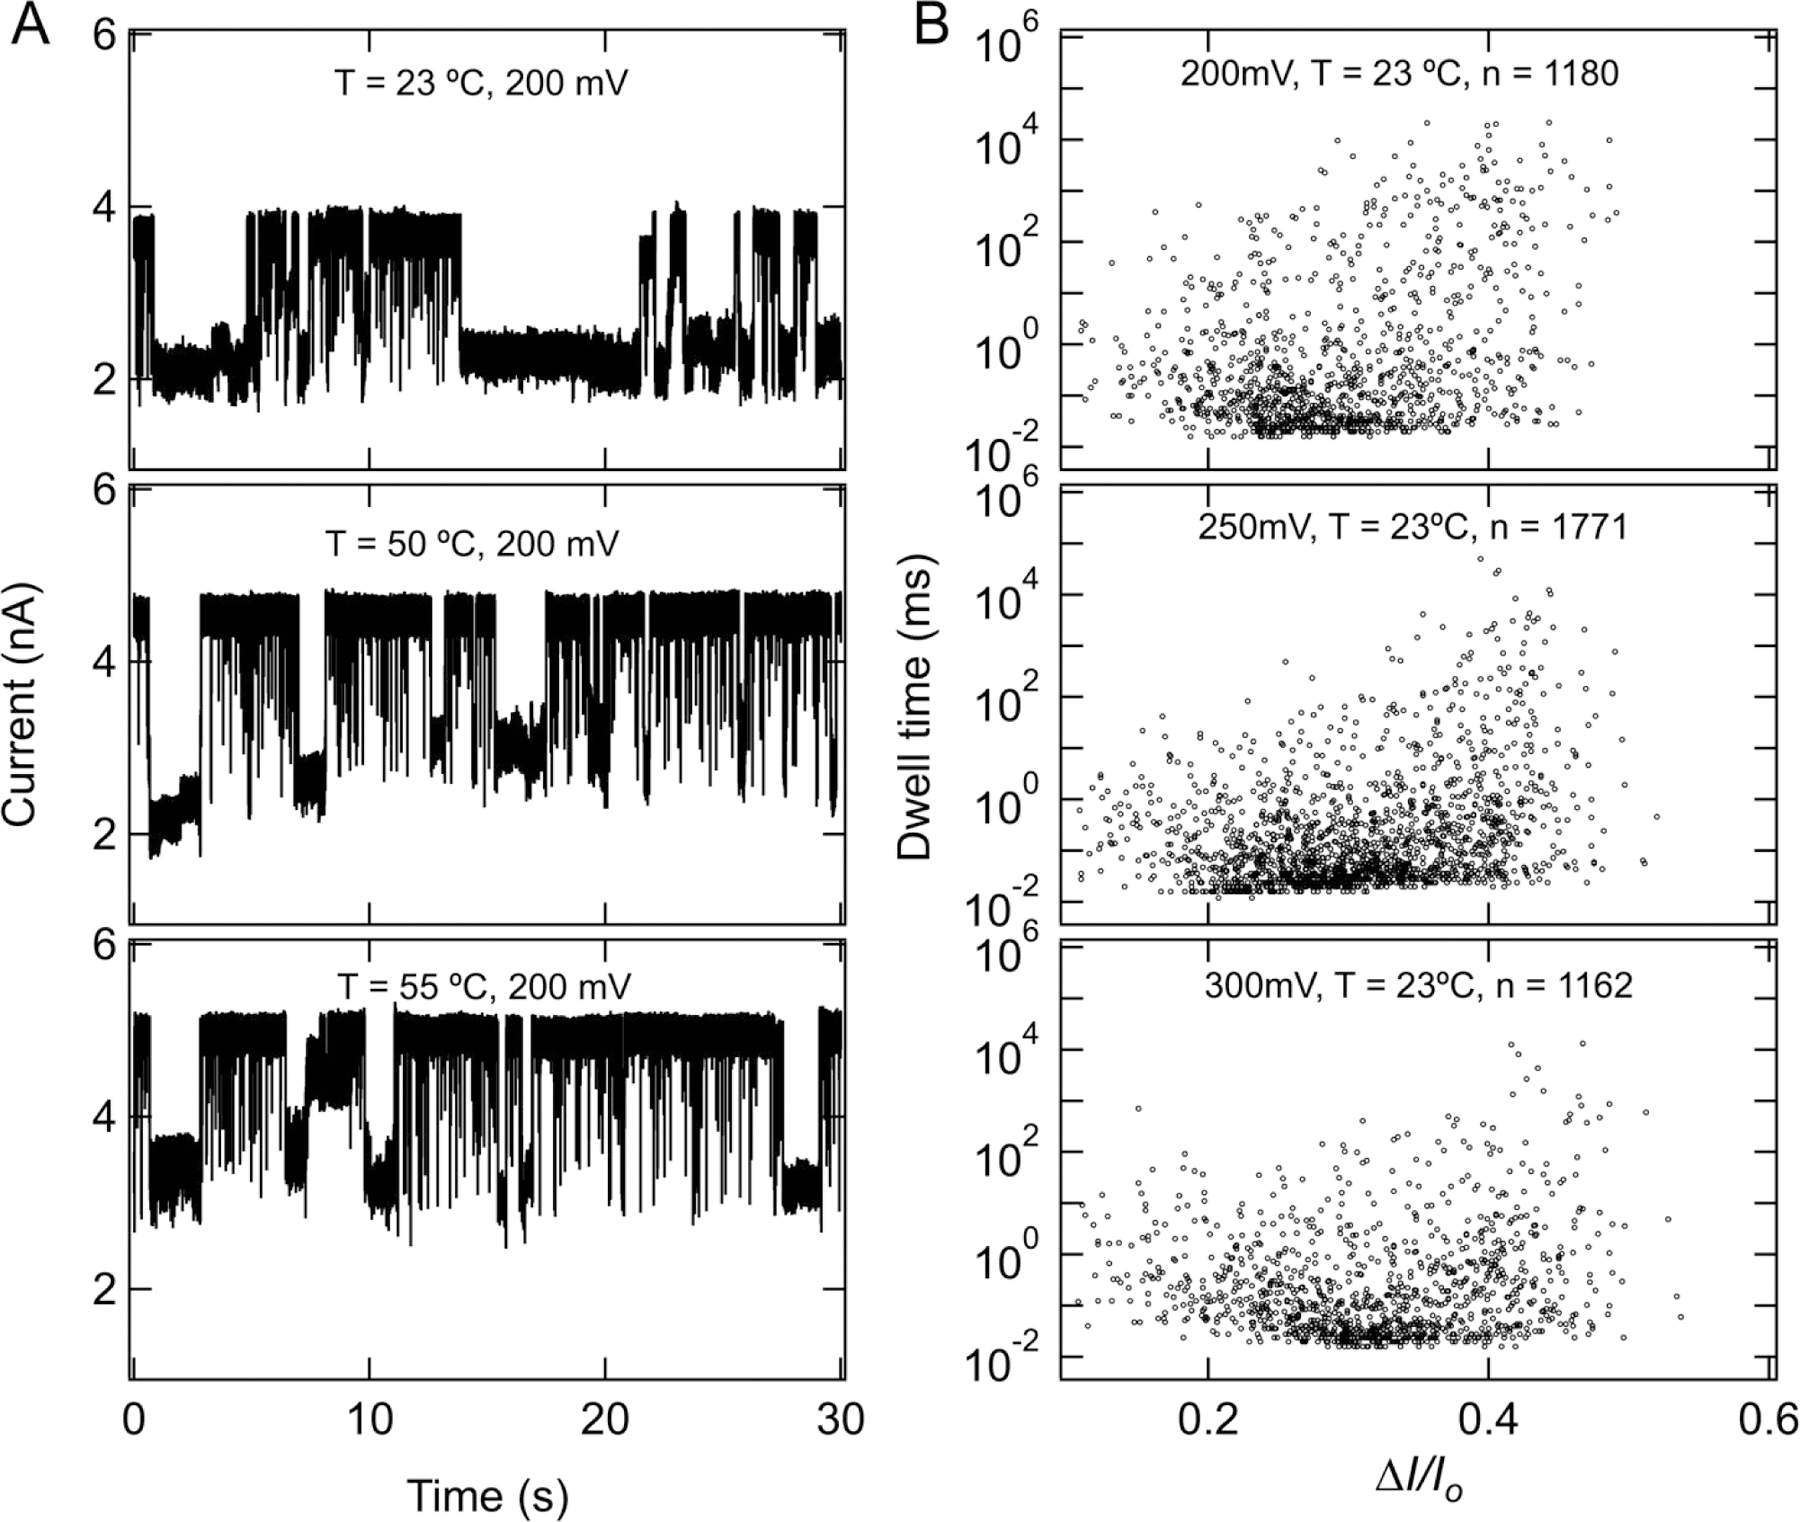
RNA fibers are a class of biomaterials that can be assembled using HIV-like kissing loop interactions. Because of the programmability of molecular design and low immunorecognition, these structures present an interesting opportunity to solve problems in nanobiotechnology and synthetic biology. However, the experimental tools to fully characterize and discriminate among different fiber structures in solution are limited. Herein, we utilize solid-state nanopore experiments and Brownian dynamics simulations to characterize and distinguish several RNA fiber structures that differ in their degrees of branching. We found that, regardless of the electrolyte type and concentration, fiber structures that have more branches produce longer and deeper ionic current blockades in comparison to the unbranched fibers. Experiments carried out at temperatures ranging from 20-60 °C revealed almost identical distributions of current blockade amplitudes, suggesting that the kissing loop interactions in fibers are resistant to heating within this range.


Figures

Figure 1.
Figure 1.
Differentiation of RNA fibers using a solid-state nanopore. (A) Schematic representation of experimental set-up, wherein the application of positive transmembrane voltages electrophoretically captures NANPs at the pore vicinity. (B) Sketches of the different RNA fibers studied in this work: non-functionalized (NF) fibers; fibers with a branch at every other monomer (EOM); fibers with a branch at every monomer (EM). (C) Representative fragments of ionic current traces obtained using a 4.5 nm diameter nanopore at 300 mV (in 1 M KCl, 10 mM HEPES, 2 mM MgCl2, pH 7.5) for NF, EOM, and EM fibers. The traces from the NF fiber sample were recorded at a sampling rate of 4,167 kHz and low-pass filtered at 250 kHz, whereas traces from the EOR and EM fiber samples (concentration of 25–100 nM) were recorded at a sampling rate of 250 kHz and low-pass filtered at 100 kHz. These traces clearly demonstrate that the fibers can be identified by solid-state nanopore according to their branching, which is difficult to achieve using other methods such as AFM and gel electrophoresis as shown in (D). (D) AFM images and gel electrophoresis of each fiber, suggesting large heterogeneity in the fibers lengths.
Figure 2.
Figure 2.
Coarse-grained Brownian dynamics simulation of RNA fibers passing through a 4.5 nm diameter nanopore. (A) Snapshots depicting a typical translocation trajectory of an EM fiber. COMSOL Multiphysics was used to determine the distribution of the electrostatic potential in and around the nanopore. The membrane containing a nanopore was represented as a steric (repulsive) potential. (B) Typical ionic current traces calculated from the translocation trajectories using SEM, . (C) Average relative blockade current amplitude versus dwell time for each translocation trajectory. The different fiber types are readily distinguished.
Figure 3
Figure 3
Characterization of RNA fibers using a 6 nm diameter pore. (A) Example ionic current traces for 100nM of NF, EOM, and EM fibers. Traces shown here were recorded in 1 M KCl, 10 mM HEPES, 2 mM MgCl2, pH 7.5, with a sampling rate of 250 kHz, and 100 kHz filter. (B) Scatter plots of each fiber at different voltages and number of events (n) collected for each scatter plot are indicated in each panel. These plots clearly distinguish between three fiber structures and indicate the rapid passage of fibers as voltage is increased. At 100 mV, a wider distribution of blockade events for EM fibers indicates the mixture of populations of events which corresponds to partial translocations and full translocation. Upon increasing the voltage bias, the distribution shifts towards a higher value of ∆I/Io and faster dwell time, suggesting more fractions of event with full translocation, as full translocation causes more current blockades. (C) log dwell time of EOM as a function of voltage. Dotted line is linear fit of the data suggesting exponential dependence of translocation time with voltage. Inset is representative histogram (excluding events faster than 100 μs) at 150 mV and a fit to a Gumbel-like distribution function having form fx=a×exp(xx0wexpxx0w). Error bars in C represents width of the distribution. (D) SVM analysis of current blockade signals identify EOM and EM with 85.8 % accuracy using features described in methods (also see SI: Fig. S12–S14).
Figure 4.
Figure 4.
Distribution of (A) current blockade ratio and (B) dwell time for NF, EOM and EM fibers, measured at 200 mV, in 0.4 M KCl, 10 mM HEPES, pH 7.5. Number of events collected for each fiber in the distributions are following for NF, n = 936; for EOM, n = 536; and for EM, n = 1395.
Figure 5.
Figure 5.
Scatter plots of EOM and EM fibers for experiments with a 5 nm pore in 2 M KCl, 10 mM HEPES, 2 mM MgCl2, pH 7.5. Number of events (n) collected in each plot are indicated.
Figure 6.
Figure 6.
High voltage translocation of EOM in 4 M LiCl. (A) Example ionic current trace recorded at 500 mV, 4 M LiCl, 2 mM MgCl2, 10 mM HEPES, pH 7.5. (B) Scatter plots for the translocation events at 500 mV and 750 mV. Number of events collected are shown in each plot. (C) Interevent-time distribution at 500 mV and 750 mV respectively. Solid lines are the exponential fit to the distribution.
Figure 7.
Figure 7.
No significant effect of temperature on kissing loop interactions. (A) Example ionic current traces for 100 nM EM measured at 200 mV and at different temperatures. (B) Scatterplots as a function of voltage measured at 23 °C. There is no appreciable change in blockade ratio upon increasing the temperature up to 60 °C (see SI: Fig. S8); only dwell time becomes faster, suggesting that the kissing loop interactions in these fiber structures are resistant to heating at this temperature.

References

    1. Johnson MB; Chandler M; Afonin KA, Nucleic acid nanoparticles (NANPs) as molecular tools to direct desirable and avoid undesirable immunological effects. Advanced drug delivery reviews 2021, 173, 427–438. - PMC - PubMed
    1. Afonin KA; Dobrovolskaia MA; Church G; Bathe M, Opportunities, Barriers, and a Strategy for Overcoming Translational Challenges to Therapeutic Nucleic Acid Nanotechnology. ACS nano 2020, 14 (8), 9221–9227. - PMC - PubMed
    1. Saito RF; Rangel MC; Halman JR; Chandler M; de Sousa Andrade LN; Odete-Bustos S; Furuya TK; Carrasco AGM; Chaves-Filho AB; Yoshinaga MY; Miyamoto S; Afonin KA; Chammas R, Simultaneous silencing of Lysophosphatidylcholine Acyltransferases 1–4 by nucleic acid nanoparticles (NANPs) improves radiation response of melanoma cells. Nanomedicine: Nanotechnology, Biology and Medicine 2021, 102418. - PMC - PubMed
    1. Johnson MB; Chandler M; Afonin KA, Nucleic acid nanoparticles (NANPs) as molecular tools to direct desirable and avoid undesirable immunological effects. Adv Drug Delivery Reviews 2021, 173, 427–438. - PMC - PubMed
    1. Ke W; Afonin KA, Exosomes as natural delivery carriers for programmable therapeutic nucleic acid nanoparticles (NANPs). Adv Drug Delivery Reviews 2021, 113835. - PMC - PubMed