Review
. 2022 Jul 20;39(7):1465-1482.
doi: 10.1039/d2np00005a.

Plant biosynthetic gene clusters in the context of metabolic evolution

Affiliations
Review

Plant biosynthetic gene clusters in the context of metabolic evolution

Samuel J Smit et al. Nat Prod Rep. .

Abstract

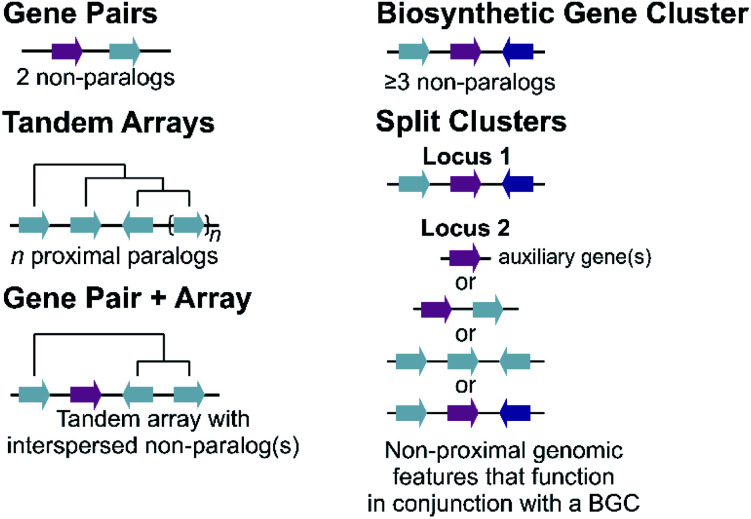
Covering: up to 2022Plants produce a wide range of structurally and biosynthetically diverse natural products to interact with their environment. These specialised metabolites typically evolve in limited taxonomic groups presumably in response to specific selective pressures. With the increasing availability of sequencing data, it has become apparent that in many cases the genes encoding biosynthetic enzymes for specialised metabolic pathways are not randomly distributed on the genome. Instead they are physically linked in structures such as arrays, pairs and clusters. The exact function of these clusters is debated. In this review we take a broad view of gene arrangement in plant specialised metabolism, examining types of structures and variation. We discuss the evolution of biosynthetic gene clusters in the wider context of metabolism, populations and epigenetics. Finally, we synthesise our observations to propose a new hypothesis for biosynthetic gene cluster formation in plants.


Conflict of interest statement

There are no conflicts to declare.

Figures

Fig. 1
Fig. 1. Genomic features of plant specialised metabolism. Non-paralogous genes are indicated by different coloured arrows with connecting lines indicative of a shared genomic region. Tree-like lines illustrate paralogous relationships.
Fig. 2
Fig. 2. Genomic and biosynthetic origins of noscapine and morphinans in Papaver somniferum. Two BGCs on chromosome 11 are involved in the biosynthesis of noscapine (indicated in blue) and morphinans (indicated in red), respectively. Grey arrows on the chromosome represent genes that are not part of the pathways shown.
Fig. 3
Fig. 3. Graphical summary of Brassicaceae triterpene BGCs and the dynamic neighbourhood model for their evolution. (A) Thalianin biosynthetic pathway illustrating the difference between Arabidopsis thaliana and A. lyrata. (B) Genomic organisation and synteny of the thalianol BGC. The inversion observed in A. thaliana species is contrasted with the arrangement of genes for A. lyrata. (C) The movement of genes into dynamic neighbourhoods around clade II OSC members and known OSC-centric BGCs in Brassicaceae. (D) Chromatin signatures and overlapping topology involved in the activation or repression, respectively, of the thalianol BGC. The subtelomeric location of the BGC is also shown. Gene families shown in the figure legend are of the oxidosqualene cyclases (OSC), Cytochrome P450s (CYP), acyltransferases (ACT) and alcohol dehydrogenases (ADH). Gene arrows depict strand orientation with connecting lines indicating contiguous genomic regions.
Fig. 4
Fig. 4. Cucurbitacin biosynthesis in Cucurbitaceae. (A) Cucurbaticin BGC and auxiliary genes conserved in Cucumis sativus, C. melo and Citrullus lanatus. (B) Syntenic relationships of tandem CYP and TF arrays showing species-specific genomic variations. Pseudogenes are shown as rectangles and genes disrupted by a premature stop codon are marked with an asterisk (*). Leaf- (Bl), fruit- (Bt) and root-specific (Br) TFs are indicated. Arrows with a black border indicate co-expressed genes predicted to contribute to biosynthesis of Cucurbatacins. (C) Biosynthetic pathway towards CuB, -C and -E with functionally characterised enzymes shown. Pathway intermediates are represented by black circles. The final step catalysed by the respective ACTs is preceded by an intermediate biosynthesised by a yet to be identified enzyme.
Fig. 5
Fig. 5. Graphical summary of momilactone BGC evolution and syntenic relationships. Note that the BGC is part of a split cluster with other loci involved in momilactone biosynthesis depicted in different panels. All genes involved in O. sativa momilactone biosynthesis are marked with a thick black outline. (A) Simplified pathway for biosynthesis of rice momilactones. (B) Structural differences and syntenic relationships relative to Oryza sativa chromosome 2 show independent evolution of the multifunctional phytocassane associated BGC. (C) Assembly of the momilactone BGC in different species showing gene gain events in Oryza spp., lateral gene flow to Echinochloa crus-galli and convergent evolution in bryophytes. (D) CYP array and auxiliary genes that are part of the momilactone pathway.
Fig. 6
Fig. 6. Mechanisms of gene duplications and genomic rearrangements.
Fig. 7
Fig. 7. Nepetalactone biosynthesis in Nepeta. (A) Biosynthetic pathway for nepetalactone from geranyl pyrophosphate. N. mussinii (NM) and N. cataria (NC) produce three different nepetalactone stereoisomers as end products, controlled by NEPS (nepetalactol-related short chain dehydrogenase) paralogs and MLPL (major latex protein-like protein). (B) Genome sequences of Hyssopus officinalis (HO; non nepetalactone producer), N. mussinii and N. cataria, focussed on three loci of interest: P5βR, GES and NEPS. The P5βR (progesterone 5β-reductase) locus contains the iridoid synthase (ISY) paralogs P5βR and secondary-ISY (SISY). P5βRs have low but detectable ISY activity; NmSISY has high ISY activity; NcSISY is a pseudogene. The NEPS locus features the nepetalactone BGC containing NEPS paralogs, ISY and MLPLs. In N. mussinii it also contains a copy of GES. (C) Proposed chronology of nepetalactone BGC evolution based on biochemical and phylogenomic data. The initials next to a genome region shows it is found in an extant genome as shown in panel (B).
Fig. 8
Fig. 8. Model for plant BGC formation.
None
Samuel J. Smit
None
Benjamin R. Lichman

References

    1. Unsicker S. B. Kunert G. Gershenzon J. Curr. Opin. Plant Biol. 2009;12:479–485. doi: 10.1016/j.pbi.2009.04.001. - DOI - PubMed
    1. Hammerbacher A. Coutinho T. A. Gershenzon J. Plant, Cell Environ. 2019;42:2827–2843. doi: 10.1111/pce.13602. - DOI - PubMed
    1. Pichersky E. Gershenzon J. Curr. Opin. Plant Biol. 2002;5:237–243. doi: 10.1016/S1369-5266(02)00251-0. - DOI - PubMed
    1. Huang A. C. Jiang T. Liu Y. X. Bai Y. C. Reed J. Qu B. Goossens A. Nützmann H. W. Bai Y. Osbourn A. Science. 2019;364:eaau6389. doi: 10.1126/science.aau6389. - DOI - PubMed
    1. Girón-Calva P. S. Li T. Koski T. M. Klemola T. Laaksonen T. Huttunen L. Blande J. D. J. Chem. Ecol. 2014;40:1203–1211. doi: 10.1007/s10886-014-0514-1. - DOI - PubMed

Publication types

MeSH terms

Substances