. 2022 Jul;113(7):2246-2257.
doi: 10.1111/cas.15376. Epub 2022 May 2.

Immunomodulatory and direct activities of ropeginterferon alfa-2b on cancer cells in mouse models of leukemia

Affiliations

Immunomodulatory and direct activities of ropeginterferon alfa-2b on cancer cells in mouse models of leukemia

Kazuki Sakatoku et al. Cancer Sci. 2022 Jul.

Abstract

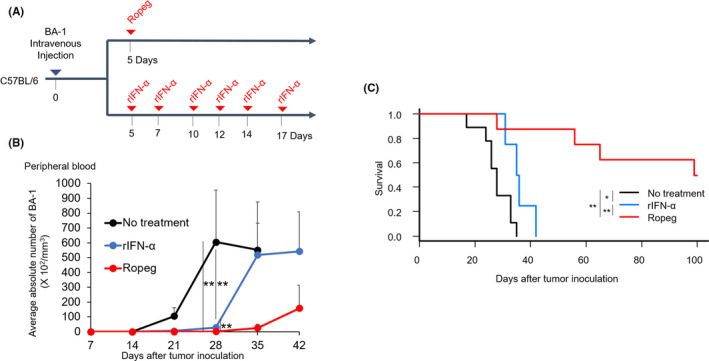
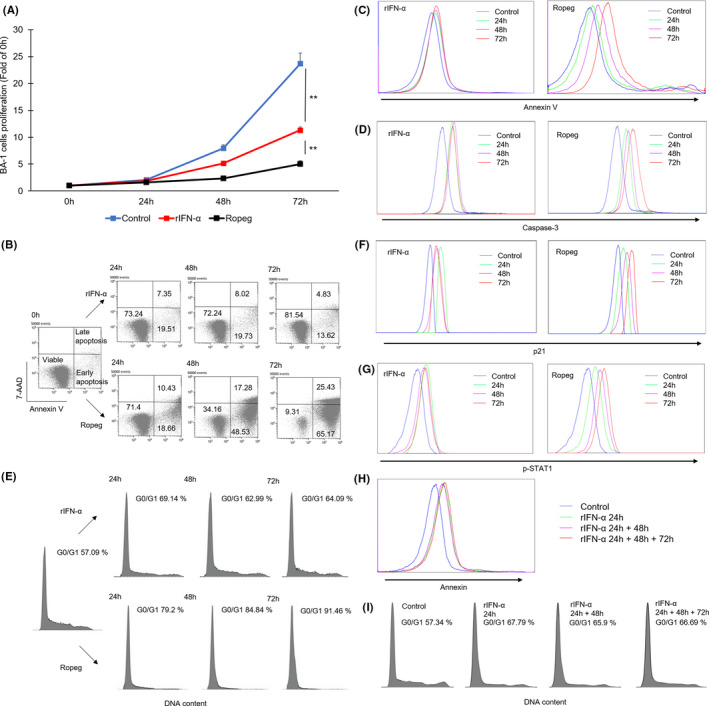
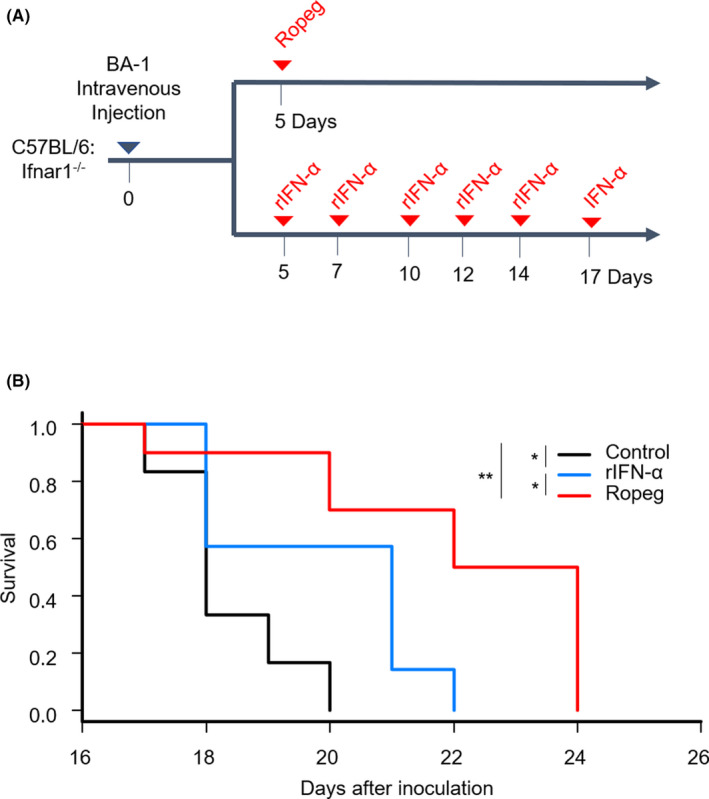
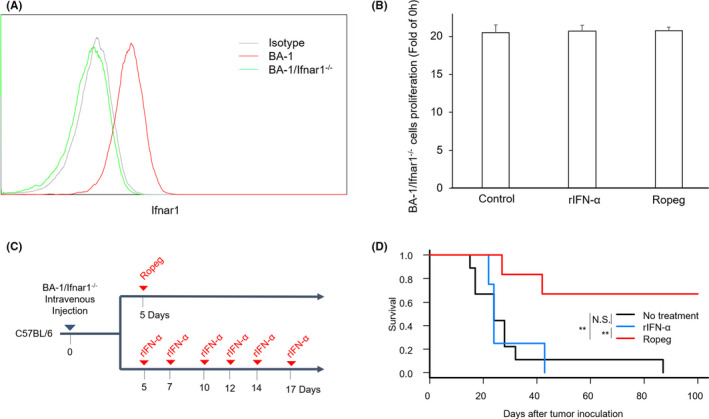
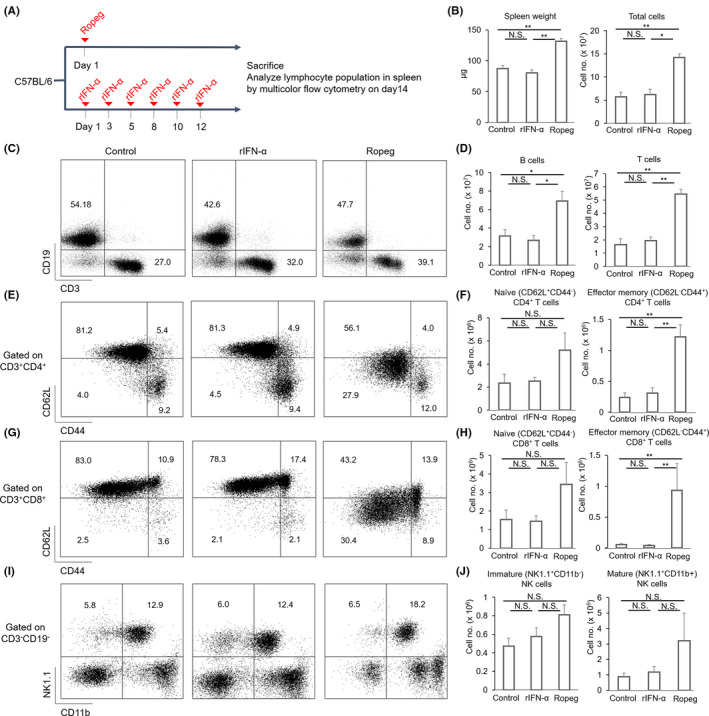
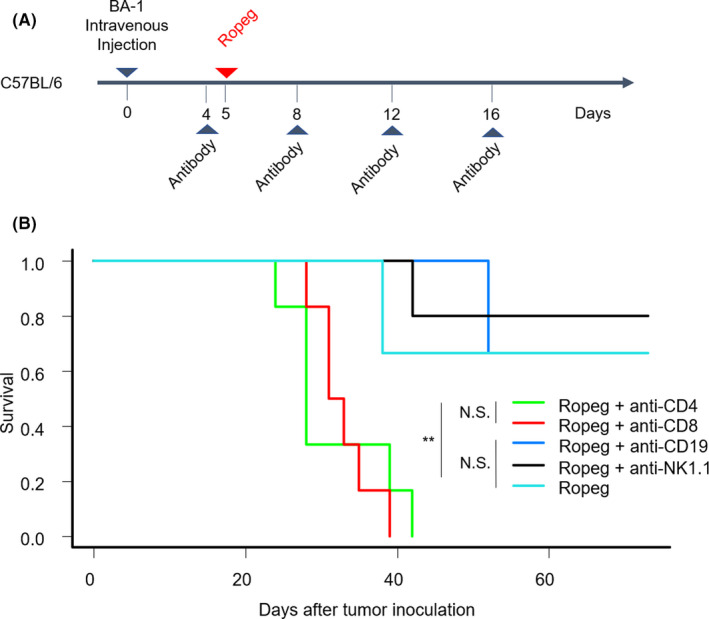
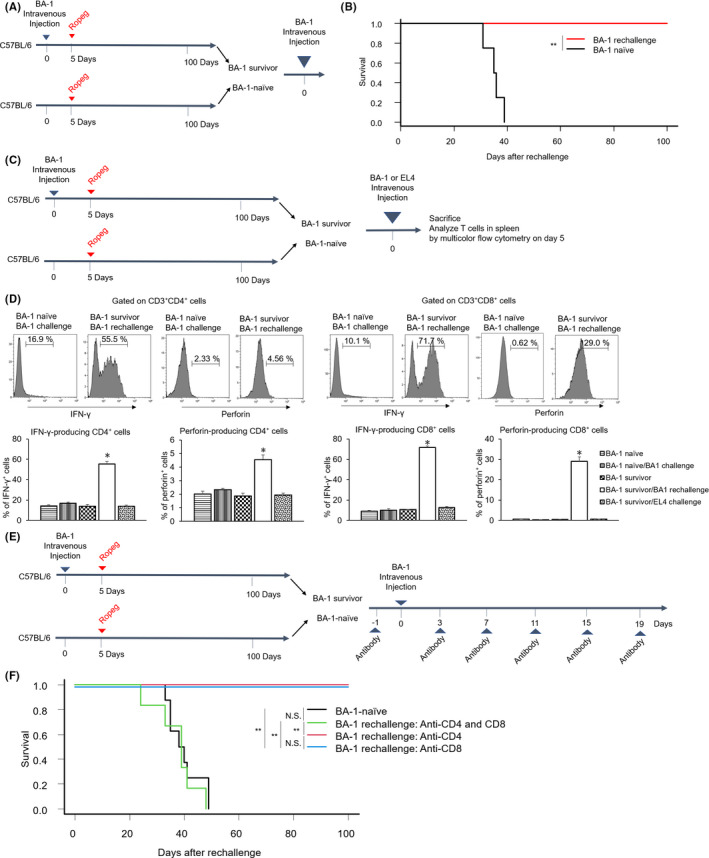
Although ropeginterferon alfa-2b has recently been clinically applied to myeloproliferative neoplasms with promising results, its antitumor mechanism has not been thoroughly investigated. Using a leukemia model developed in immunocompetent mice, we evaluated the direct cytotoxic effects and indirect effects induced by ropeginterferon alfa-2b in tumor cells. Ropeginterferon alfa-2b therapy significantly prolonged the survival of mice bearing leukemia cells and led to long-term remission in some mice. Alternatively, conventional interferon-alpha treatment slightly extended the survival and all mice died. When ropeginterferon alfa-2b was administered to interferon-alpha receptor 1-knockout mice after the development of leukemia to verify the direct effect on the tumor, the survival of these mice was slightly prolonged; nevertheless, all of them died. In vivo CD4+ or CD8+ T-cell depletion resulted in a significant loss of therapeutic efficacy in mice. These results indicate that the host adoptive immunostimulatory effect of ropeginterferon alfa-2b is the dominant mechanism through which tumor cells are suppressed. Moreover, mice in long-term remission did not develop leukemia, even after tumor rechallenge. Rejection of rechallenge tumors was canceled only when both CD4+ and CD8+ T cells were removed in vivo, which indicates that each T-cell group functions independently in immunological memory. We show that ropeginterferon alfa-2b induces excellent antitumor immunomodulation in hosts. Our finding serves in devising therapeutic strategies with ropeginterferon alfa-2b.

Keywords: adoptive immunity; antitumor effector cells; immunomodulatory effect; interferon-alpha; ropeginterferon alfa-2b.


Figures

FIGURE 1
FIGURE 1
Ropeg treatment in BA‐1 cell–injected mice. A, A schematic illustration of the therapy protocol for in vivo experiments. B, Single‐cell suspensions of blood at 7, 14, 21, 28, 35, and 42 d after tumor inoculation were analyzed via flow cytometry to determine the fraction of GFP+ cells (BA‐1 cells). Error bar indicates the mean and SE. Statistical significance was determined using Student's t test with comparisons indicated by brackets (**p < 0.01). C, Survival data in C57BL/6 mice were plotted in a Kaplan‐Meier survival curve, and statistical significance was calculated with the log‐rank test. No treatment (n = 11), rIFN‐α–treated (n = 8), and ropeg‐treated C57BL/6 (n = 8) mice. Data were derived from at least three independent experiments (*p < 0.05; **p < 0.01)
FIGURE 2
FIGURE 2
Direct effect of ropeg and rIFN‐α on BA‐1 cells ex vivo. This section describes the drug‐induced antitumor proliferative effects of coculturing BA‐1 cells with ropeg (5 μg/ml in media) and rIFN‐α (1250 μg/ml in media) for 72 h. A, Tumor growth curves of BA‐1. Error bar indicates the SE. Statistical significance was determined using Student's t test with comparisons indicated by brackets (**p < 0.01). Data were derived from three independent experiments. B, Graphical representation of annexin V and 7‐AAD expression of BA‐1 cells after incubation with ropeg and rIFN‐α. Representative histogram plots representing the expression of (C) annexin V, (D) caspase‐3, (F) p21, and (G) p‐STAT1 in viable BA‐1 cells after incubation with ropeg and rIFN‐α. (E) Representative DNA histogram plots of the cell cycle profile of BA‐1 cells after incubation with ropeg and rIFN‐α. G0/G1 percentages show representative data obtained from three experiments. (H) Annexin V expression in viable BA‐1 after additional administration of rIFN‐α (1250 U/ml every 24 h). (I) Histogram plots representing cell cycle in BA‐1 cells after an additional dose of rIFN‐α (1250 U/ml every 24 h). Histogram and dot plots in this section are representative based on three independent and reproducible experiments
FIGURE 3
FIGURE 3
Direct antiproliferative effect of ropeg for BA‐1 cells in vivo. A, BA‐1 cells (1 × 105) were injected intravenously into Ifnar1−/− C57BL/6 mice. B, Survival data of ifnar1−/− C57BL/6 mice were plotted in a Kaplan‐Meier survival curve, and statistical significance was calculated with the log‐rank test. No treatment (n = 6), rIFN‐α–treated (n = 7), and ropeg‐treated C57BL/6 (n = 10) mice. (*p < 0.05) Data were derived from three independent experiments
FIGURE 4
FIGURE 4
Indirect antiproliferative effect of ropeg on BA‐1 cells in vivo. A, Histographical representation of Ifnar1 in BA‐1 and BA‐1/Ifnar1−/− cells. Histograms showed several cells per channel (vertical axis) versus Ifnar1−/− (horizontal axis). B, Tumor growth of BA‐1/Ifnar1−/− at 72 h after incubation with ropeg (5 μg/ml in media) and rIFN‐α (1250 U/ml in media). Data are derived from three independent experiments (n = 9 per group). Bar charts indicate the mean and SE. C, BA‐1/Ifnar1−/− cells (1 × 105) were injected intravenously into C57BL/6 mice. D, Survival data in C57BL/6 mice were plotted in a Kaplan‐Meier survival curve, and statistical significance was calculated with the log‐rank test. No treatment (n = 9), rIFN‐α–treated (n = 4), and ropeg‐treated C57BL/6 (n = 6) mice. (**p < 0.01) Data were derived from three independent experiments. N.S., not significant
FIGURE 5
FIGURE 5
Changes in the percentage and absolute number of lymphocyte subsets in the spleen after the administration of ropeg. (A) A schematic illustration of the therapy method in the in vivo experiments. (B) Spleen weights and the total number of splenocytes. Splenocytes were analyzed for the expression of (C) CD3 and CD19 gated on available cells, CD62L and CD44 gated on each (E) CD3+CD4+ and (G) CD8+ T cells, and (I) NK1.1 and CD11b gated on CD3CD19 cells. Representative dot plots in each group. The number in each quadrant shows the mean percentage of each population. The total number of (D) B (CD19+) cells, T (CD3+) cells, naïve (CD62L+CD44) and effector memory (CD62LCD44+) cells in (F) CD4+ and (H) CD8+ T cells, and (J) immature and mature NK cells in each treatment group. Results are representative of three independent experiments with five mice in each group. Statistical analyses were performed using a nonparametric Mann‐Whitney U test (*p < 0.05; **p < 0.01)
FIGURE 6
FIGURE 6
Ropeg‐induced tumor rejection is mediated by cellular immunity. A, A schematic illustration of the treatment method in the depletion experiments. Depleting antibodies were administered as described in the “Materials and Methods” section. B, Survival data in C57BL/6 mice were plotted in a Kaplan‐Meier survival curve, and statistical significance was calculated with the log‐rank test. CD4‐ (n = 6), CD8‐ (n = 6), NK1.1‐ (n = 5), and CD19‐depleted (n = 5) C57BL/6 mice were treated with ropeg on day 5 after BA‐1 cell (1 × 105) inoculation. This experiment included control mice (n = 3) that received ropeg without antibodies. Data were derived from three independent experiments. (**p < 0.01)
FIGURE 7
FIGURE 7
Tumor rechallenge of surviving mice with BA‐1 leukemia. A, C57BL/6 mice that achieved leukemia‐free survival for more than 100 d (n = 4; eight mice were injected intravenously with BA‐1 cells, and four survived by ropeg treatment) after intravenous injection of BA‐1 cells were rechallenged with BA‐1 (1 × 103). No further treatment was applied. Age‐matched mice that received no intravenous infusion of BA‐1 cells and only ropeg administration (n = 4) served as controls. B, Survival data derived from three independent experiments were plotted in a Kaplan‐Meier survival curve. Statistical significance was calculated using a log‐rank test (**p < 0.01). C, To evaluate whether BA‐1 leukemia–surviving mice have cytotoxic T cells specific for BA‐1 cells, BA‐1 cells (1 × 103) or another cell line, EL4 cells (1 × 103), were administered to BA‐1 leukemia–surviving mice or age‐matched BA‐1–naïve mice. Five days after intravenous injection of the cell lines, spleens were collected and analyzed for cytotoxic cytokine secretion in T cells via flow cytometry. D, Representative histogram plots showing IFN‐γ or perforin expression gated on CD3+CD4+ (left) and CD3+CD8+ (right) populations. The histograms show the number of cells per channel (vertical axis) versus IFN‐γ or perforin (horizontal axis). Error bars show SE (n = 5‐6 each population). Data were derived from three independent experiments. Statistical analyses were performed using a Kruskal‐Wallis test followed by Mann‐Whitney U test with Bonferroni correction (* indicates p < 0.05 for a two‐arm comparison between the BA‐1–rechallenge group and each of the other groups). E, A schematic illustration to evaluate T‐cell involvement in immunological memory for BA‐1 cells. BA‐1–surviving mice were treated with depleting antibodies according to the doses described in the “Materials and Methods” section twice a week for a total of 3 wk before the rechallenge of BA‐1 cells (1 × 103). F, Survival data derived from three independent experiments were plotted in a Kaplan‐Meier survival curve. Statistical significance was calculated using a log‐rank test (**p < 0.01). BA‐1–naïve (n = 8), CD4‐depleted (n = 3), CD8‐depleted (n = 3), and CD4‐ and CD8‐depleted BA‐1–surviving (n = 6) mice. Data were derived from three independent experiments

Similar articles

References

    1. Sistigu A, Yamazaki T, Vacchelli E, et al. Cancer cell‐autonomous contribution of type I interferon signaling to the efficacy of chemotherapy. Nat Med. 2014;20(11):1301‐1309. - PubMed
    1. Stone ML, Chiappinelli KB, Li H, et al. Epigenetic therapy activates type I interferon signaling in murine ovarian cancer to reduce immunosuppression and tumor burden. Proc Natl Acad Sci U S A. 2017;114(51):E10981‐E10990. - PMC - PubMed
    1. Cauwels A, Van Lint S, Garcin G, et al. A safe and highly efficient tumor‐targeted type I interferon immunotherapy depends on the tumor microenvironment. Oncoimmunology. 2018;7(3):e1398876. - PMC - PubMed
    1. Anguille S, Lion E, Willemen Y, Van Tendeloo VF, Berneman ZN, Smits EL. Interferon‐α in acute myeloid leukemia: an old drug revisited. Leukemia. 2011;25(5):739‐748. - PubMed
    1. Talpaz M, Hehlmann R, Quintás‐Cardama A, Mercer J, Cortes J. Re‐emergence of interferon‐α in the treatment of chronic myeloid leukemia. Leukemia. 2013;27(4):803‐812. - PMC - PubMed