

A Population Pharmacokinetic Model of Whole-Blood and Intracellular Tacrolimus in Kidney Transplant Recipients
- PMID: 35442010
- PMCID: PMC9232416
- DOI: 10.1007/s13318-022-00767-8
A Population Pharmacokinetic Model of Whole-Blood and Intracellular Tacrolimus in Kidney Transplant Recipients
Abstract
Background and objective: The tacrolimus concentration within peripheral blood mononuclear cells may correlate better with clinical outcomes after transplantation compared to concentrations measured in whole blood. However, intracellular tacrolimus measurements are not easily implemented in clinical practice. The prediction of intracellular concentrations based on whole-blood concentrations would be a solution for this. Therefore, the aim of this study was to describe the relationship between intracellular and whole-blood tacrolimus concentrations in a population pharmacokinetic (popPK) model.
Methods: Pharmacokinetic analysis was performed using non-linear mixed effects modelling software (NONMEM). The final model was evaluated using goodness-of-fit plots, visual predictive checks, and a bootstrap analysis.
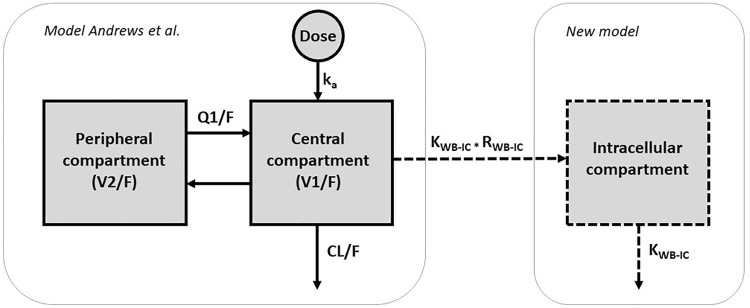
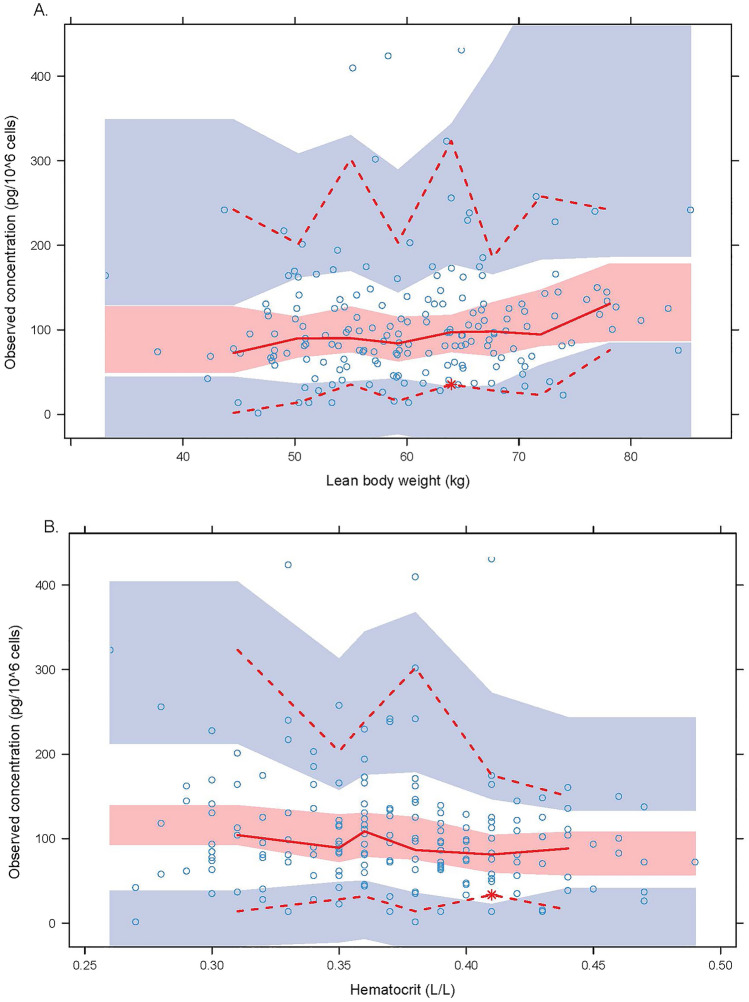
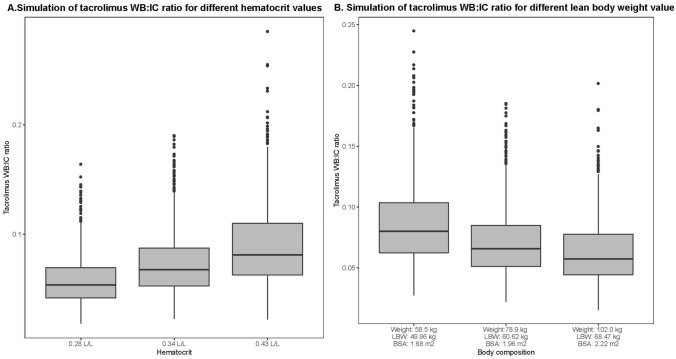
Results: A total of 590 tacrolimus concentrations from 184 kidney transplant recipients were included in the study. All tacrolimus concentrations were measured in the first three months after transplantation. The intracellular tacrolimus concentrations (n = 184) were best described with an effect compartment. The distribution into the effect compartment was described by the steady-state whole-blood to intracellular ratio (RWB:IC) and the intracellular distribution rate constant between the whole-blood and intracellular compartments. Lean body weight was negatively correlated [delta objective function value (ΔOFV) -8.395] and haematocrit was positively correlated (ΔOFV = - 6.752) with RWB:IC, and both lean body weight and haematocrit were included in the final model.
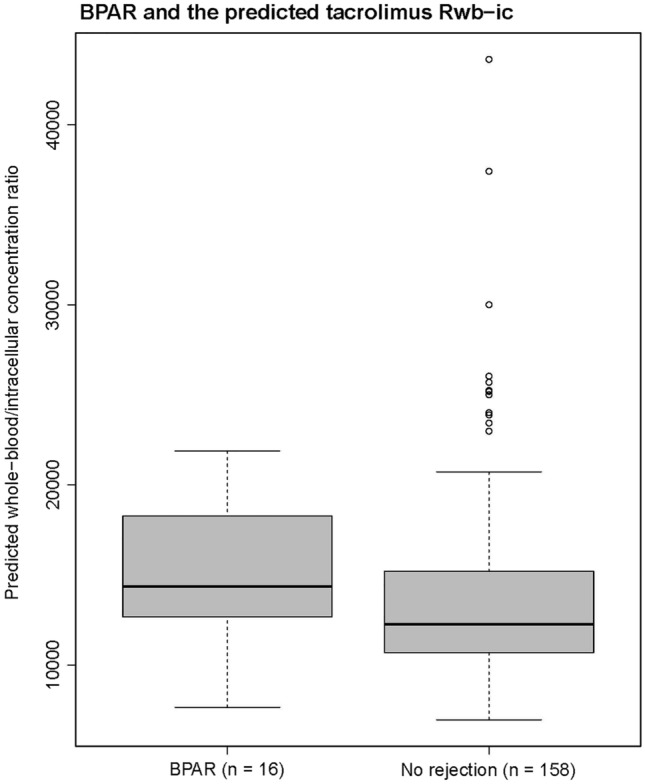
Conclusion: We were able to accurately describe intracellular tacrolimus concentrations using whole-blood concentrations, lean body weight, and haematocrit values in a popPK model. This model may be used in the future to more accurately predict clinical outcomes after transplantation and to identify patients at risk for under- and overexposure. Dutch National Trial Registry number NTR2226.
© 2022. The Author(s).
Conflict of interest statement
D.A. Hesselink has received grant support (paid to his institution) from Astellas Pharma, Chiesi Farmaceutici SpA, and Bristol Myers-Squibb, as well as lecture and consulting fees from Astellas Pharma, Chiesi Farmaceutici SpA, Novartis Pharma, and Vifor Pharma. All other authors declared no competing interests for this work.
Figures

References
-
- Shuker N, Bouamar R, van Schaik RH, Clahsen-van Groningen MC, Damman J, Baan CC, et al. A randomized controlled trial comparing the efficacy of Cyp3a5 genotype-based with body-weight-based tacrolimus dosing after living donor kidney transplantation. Am J Transplant. 2016;16(7):2085–2096. doi: 10.1111/ajt.13691. - DOI - PubMed
-
- Bouamar R, Shuker N, Hesselink DA, Weimar W, Ekberg H, Kaplan B, et al. Tacrolimus predose concentrations do not predict the risk of acute rejection after renal transplantation: a pooled analysis from three randomized-controlled clinical trials. Am J Transplant. 2013;13(5):1253–61. - PubMed
MeSH terms
Substances
LinkOut - more resources
Full Text Sources
Medical
