. 2022 Jul;24(7):1512-1522.
doi: 10.1016/j.gim.2022.03.013. Epub 2022 Apr 19.

The Clinical Variant Analysis Tool: Analyzing the evidence supporting reported genomic variation in clinical practice

Affiliations

The Clinical Variant Analysis Tool: Analyzing the evidence supporting reported genomic variation in clinical practice

Hui-Lin Chin et al. Genet Med. 2022 Jul.

Abstract

Purpose: Genomic test results, regardless of laboratory variant classification, require clinical practitioners to judge the applicability of a variant for medical decisions. Teaching and standardizing clinical interpretation of genomic variation calls for a methodology or tool.

Methods: To generate such a tool, we distilled the Clinical Genome Resource framework of causality and the American College of Medical Genetics/Association of Molecular Pathology and Quest Diagnostic Laboratory scoring of variant deleteriousness into the Clinical Variant Analysis Tool (CVAT). Applying this to 289 clinical exome reports, we compared the performance of junior practitioners with that of experienced medical geneticists and assessed the utility of reported variants.

Results: CVAT enabled performance comparable to that of experienced medical geneticists. In total, 124 of 289 (42.9%) exome reports and 146 of 382 (38.2%) reported variants supported a diagnosis. Overall, 10.5% (1 pathogenic [P] or likely pathogenic [LP] variant and 39 variants of uncertain significance [VUS]) of variants were reported in genes without established disease association; 20.2% (23 P/LP and 54 VUS) were in genes without sufficient phenotypic concordance; 7.3% (15 P/LP and 13 VUS) conflicted with the known molecular disease mechanism; and 24% (91 VUS) had insufficient evidence for deleteriousness.

Conclusion: Implementation of CVAT standardized clinical interpretation of genomic variation and emphasized the need for collaborative and transparent reporting of genomic variation.

Keywords: Exome sequencing; Genomic medicine; Precision medicine; Variant classification; Variant interpretation.


Conflict of interest statement

Conflict of Interest Julius O.B. Jacobsen and Damian Smedley are paid consultants to Congenica Ltd. All other authors declare no conflicts of interest.

Figures
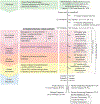
Figure 1
Figure 1. Flowchart illustrating the application of the Clinical Variant Analysis Tool to variants listed on 289 clinical laboratory reports for exome sequencing.
Each step of the analysis is shown as a different color. The outcomes for each step are shown along the right side and the overall outcomes are at the bottom. This analytical framework assesses causality and predicted variant deleteriousness. Evaluation of 289 exome reports found that 42.9% of reports and 38.2% of reported variants supported a diagnosis. Overall, 89.5% of reports supported a diagnosis of a single disorder. 10.5% of reports supported a diagnosis of multiple disorders based on variants in established disease genes, and 14.2% did with inclusion of variants in candidate disease genes. Overall, 79.5% of variants supporting a diagnosis were classified as P or LP by the laboratory, whereas 20.5% of variants supporting a diagnosis were classified as VUS by the laboratory. Evidence used by clinicians to interpret a VUS as supporting a diagnosis included reverse phenotyping, functional studies, or parental segregation for 24, 5, and 5 variants, respectively. 3D, three-dimensional; ACMG, American College of Medical Genetics; AMP, Association of Molecular Pathology; HPO, Human Phenotype Ontology; LP, likely pathogenic; P, pathogenic; VUS, variant of uncertain significance.
Figure 2
Figure 2. Evaluation of variant level evidence for deleteriousness.
A. Assessment of 228 variants with sufficient gene–disease association, phenotype–disease concordance, and disease mechanism congruence. Of these variants, 60.5% had features of deleteriousness supporting a diagnosis, whereas 39.5% did not. Variants supporting a diagnosis had more categories of evidence (mean = 3.1 ± 1.4 SD) supporting deleteriousness than variants that did not (mean = 1.6 ± 1.0 SD). Of variants not supporting a diagnosis, 28% had evidence against deleteriousness. Overall, 84% of variants not supporting a diagnosis fulfilled the population data evidence (ie, absent/low variant frequency in Genome Aggregation Database) for deleteriousness. The characteristics of the 9 categories of evidence are as follows: (1) population data assess rarity in or absence from population databases; (2) computational data are generated using in silico tools (SIFT, PolyPhen, CADD, LIST-S2) to predict potential variant deleteriousness; (3) predictive data represent the expected consequence of the variation based on variant type (eg, null variants) or evidence derived from a different pathogenic/likely pathogenic missense variant or amino acid changes at the same site; (4) functional data represent literature or studies done on the proband and/or the variant to assess deleteriousness; (5) structural data assess whether the variant resides in a mutational hotspot or might deleteriously alter a functional domain or a constrained structure; (6) segregation data document if the variant segregates with the phenotype in the family; (7) de novo data define if the variant is absent in the parents in the context of no prior family history of the phenotype; (8) allelic data assess whether the variant occurs in trans with a pathogenic/likely pathogenic variant for a recessive disease; and (9) replicability or precedence data define whether the variant has previously been reported with the associated phenotype. B. Overall Exomiser scores and (C) LIST-S2 scores for the 228 variants supporting (left) or not supporting (right) a diagnosis. Exomiser scores (overall [left], phenotype [middle], and predicted variant deleteriousness [right]) for the 228 variants (D) supporting or (E) not supporting a diagnosis. Panels (B–E) represent the 228 variants represented in panel (A). B, C. X represents the mean score, the line represents the median score, the box represents the first to third quartile of the scores, and the whiskers represent the maximum to minimum score. Additional outlier scores are represented as dots. CADD, Combined Annotation Dependent Depletion; LIST-S2, Local Identity and Shared Taxa; PolyPhen, Polymorphism Phenotyping; SIFT, Sorting Intolerant From Tolerant.
Figure 3
Figure 3. Bioinformatic assessment of proband phenotypes and clinically reported exome sequencing variants.
A. Phenotypic sufficiency scores for the 2 cohorts studied. B. Comparison of the phenotypic sufficiency scores for the probands contributed by the different clinicians. C. Pareto chart demonstrating overall Exomiser score for variants supporting a diagnosis. D. Pareto chart demonstrating overall Exomiser score for variants not supporting a diagnosis. E. Examples of categorical graphical representation of phenotype in the context of genotype to detect dual diagnoses. The left shows graphical representations of the phenotypic features of a proband with diagnoses of cerebral cavernous malformations (KRIT1) and polycythemia vera (JAK2). The right shows graphical representations of the phenotypic features of a proband with diagnoses of Wilson disease (ATP7B) and Bethlem myopathy (COL6A1); the patient also has STS deficiency, which explains the ichthyosis. The graphical output was generated using LIRICAL. The green bars represent phenotypic features consistent with the disorder. The red bars represent phenotypic features not consistent with the disorder. (A, B) X represents the mean score, the line represents the median score, the box represents the first to third quartile of the scores, and the whiskers represent the maximum to minimum score. Additional outlier scores are represented as dots. HP, Human Phenotype Ontology Term Identifier.

References

    1. MacArthur DG, Manolio TA, Dimmock DP, et al. Guidelines for investigating causality of sequence variants in human disease. Nature. 2014;508(7497):469–476. 10.1038/nature13127. - DOI - PMC - PubMed
    1. Richards S, Aziz N, Bale S, et al. Standards and guidelines for the interpretation of sequence variants: a joint consensus recommendation of the American College of Medical Genetics and Genomics and the Association forMolecular Pathology. Genet Med. 2015;17(5):405–424. 10.1038/gim.2015.30. - DOI - PMC - PubMed
    1. Ellard S, Baple EL, Callaway A, et al. ACGS Best Practice Guidelines for Variant Classification in Rare Disease 2020. Association for Clinical Genomic Science. Published 2020. https://www.acgs.uk.com/media/11631/uk-practice-guidelines-for-variant-c.... Accessed March 10, 2021.
    1. Brnich SE, Abou Tayoun AN, Couch FJ, et al. Recommendations for application of the functional evidence PS3/BS3 criterion using the ACMG/AMP sequence variant interpretation framework. Genome Med. 2019;12(1):3. 10.1186/s13073-019-0690-2. - DOI - PMC - PubMed
    1. Rivera-Muñoz EA, Milko LV, Harrison SM, et al. ClinGen Variant Curation Expert Panel experiences and standardized processes for disease and gene-level specification of the ACMG/AMP guidelines for sequence variant interpretation. Hum Mutat. 2018;39(11):1614–1622. 10.1002/humu.23645. - DOI - PMC - PubMed

Publication types