Randomized Controlled Trial
. 2022 Jul 1;36(8):1117-1127.
doi: 10.1097/QAD.0000000000003229. Epub 2022 Apr 19.

Coordination of inflammatory responses in children with perinatally acquired HIV infection

Affiliations
Randomized Controlled Trial

Coordination of inflammatory responses in children with perinatally acquired HIV infection

Adriana Weinberg et al. AIDS. .

Abstract

Objective: We investigated dynamics of inflammatory biomarkers in children with perinatally acquired HIV (PHIV) who started antiretrovirals at age less than 3 years and achieved sustained virologic control (HIV plasma RNA <400 copies/ml).

Design: This was a retrospective analysis of inflammatory biomarkers in children enrolled in a randomized trial of early (<3 years of age) PI-based versus NNRTI-based regimens (P1060), who achieved sustained virologic control and participated in a neurodevelopmental follow-up study (P1104s) between ages 5 and 11 years.

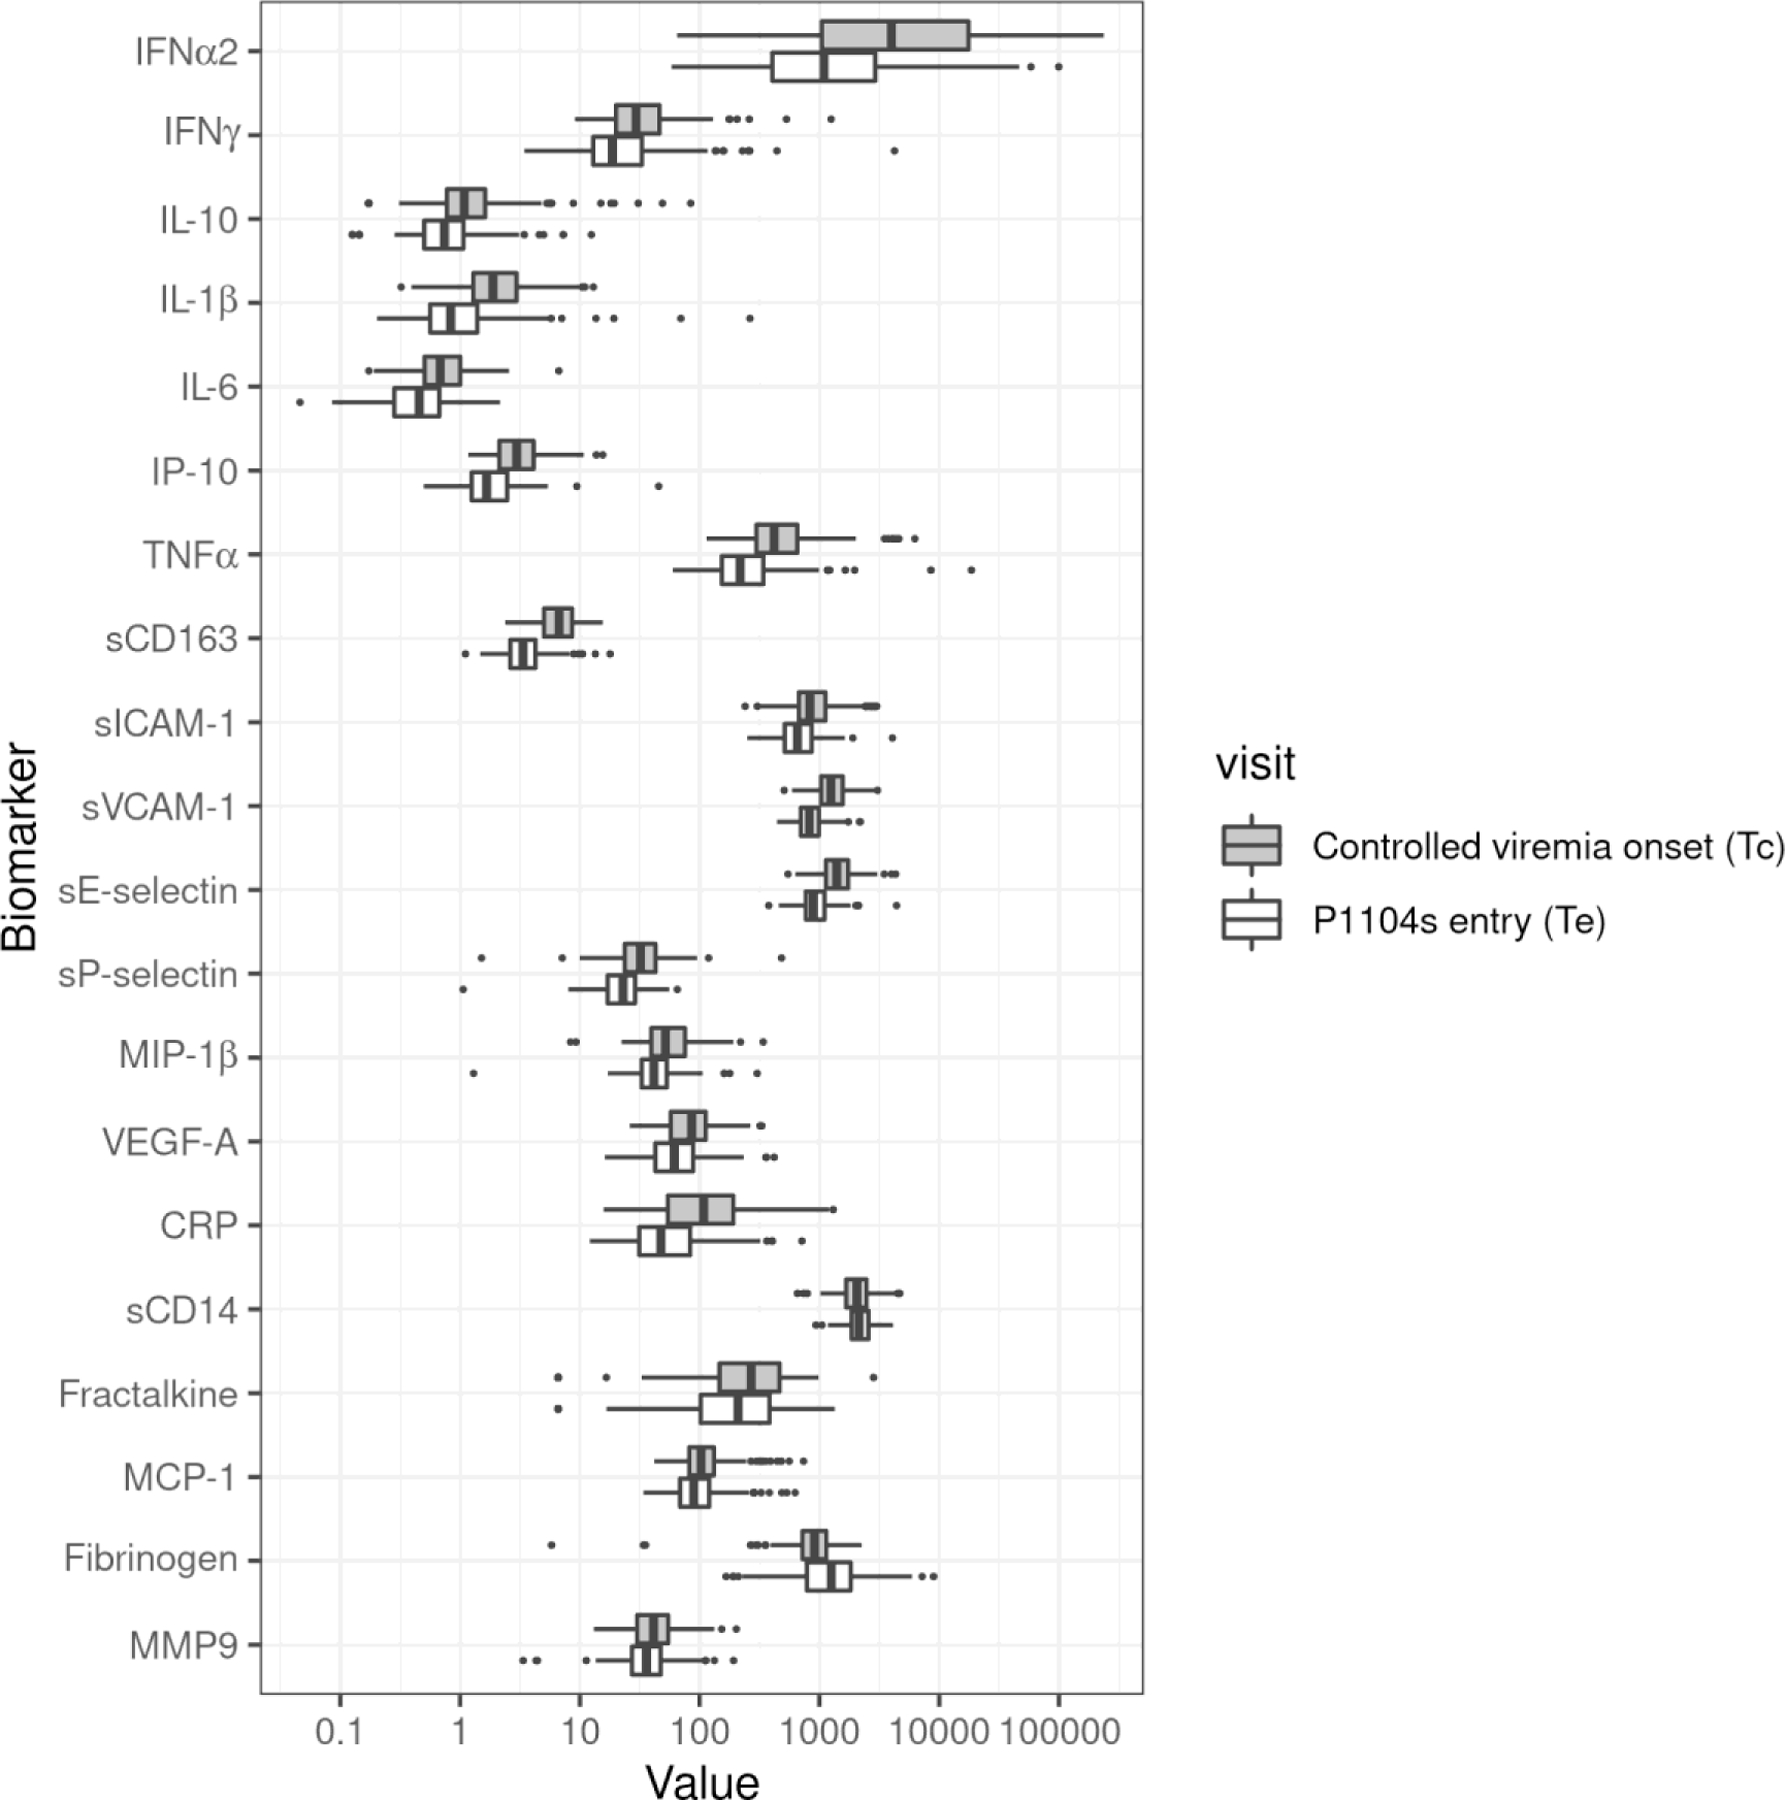
Methods: We measured 20 inflammatory biomarkers using ELISA or chemiluminescence at onset of sustained virologic control (Tc) and at P1104s entry (Te).

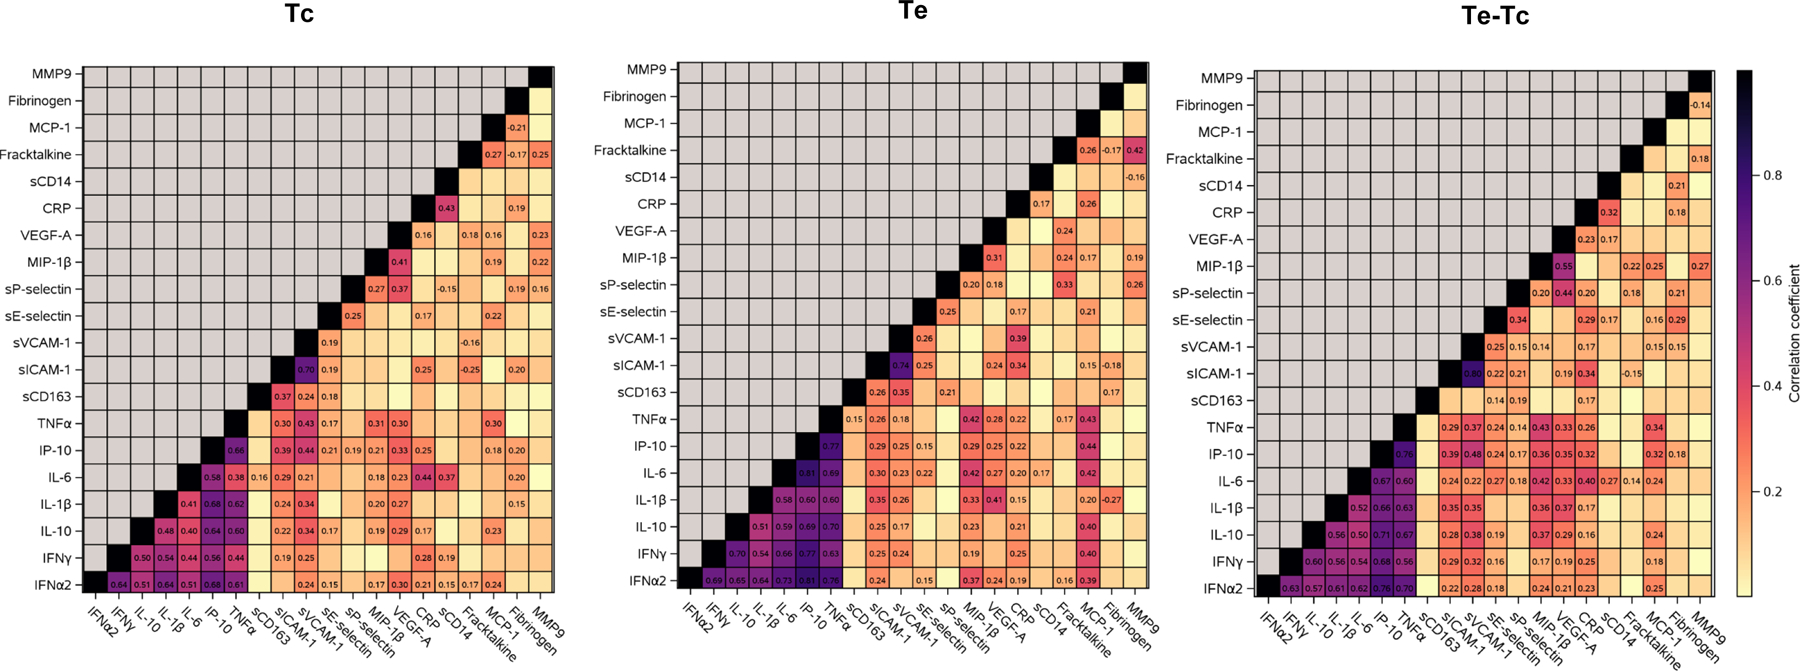
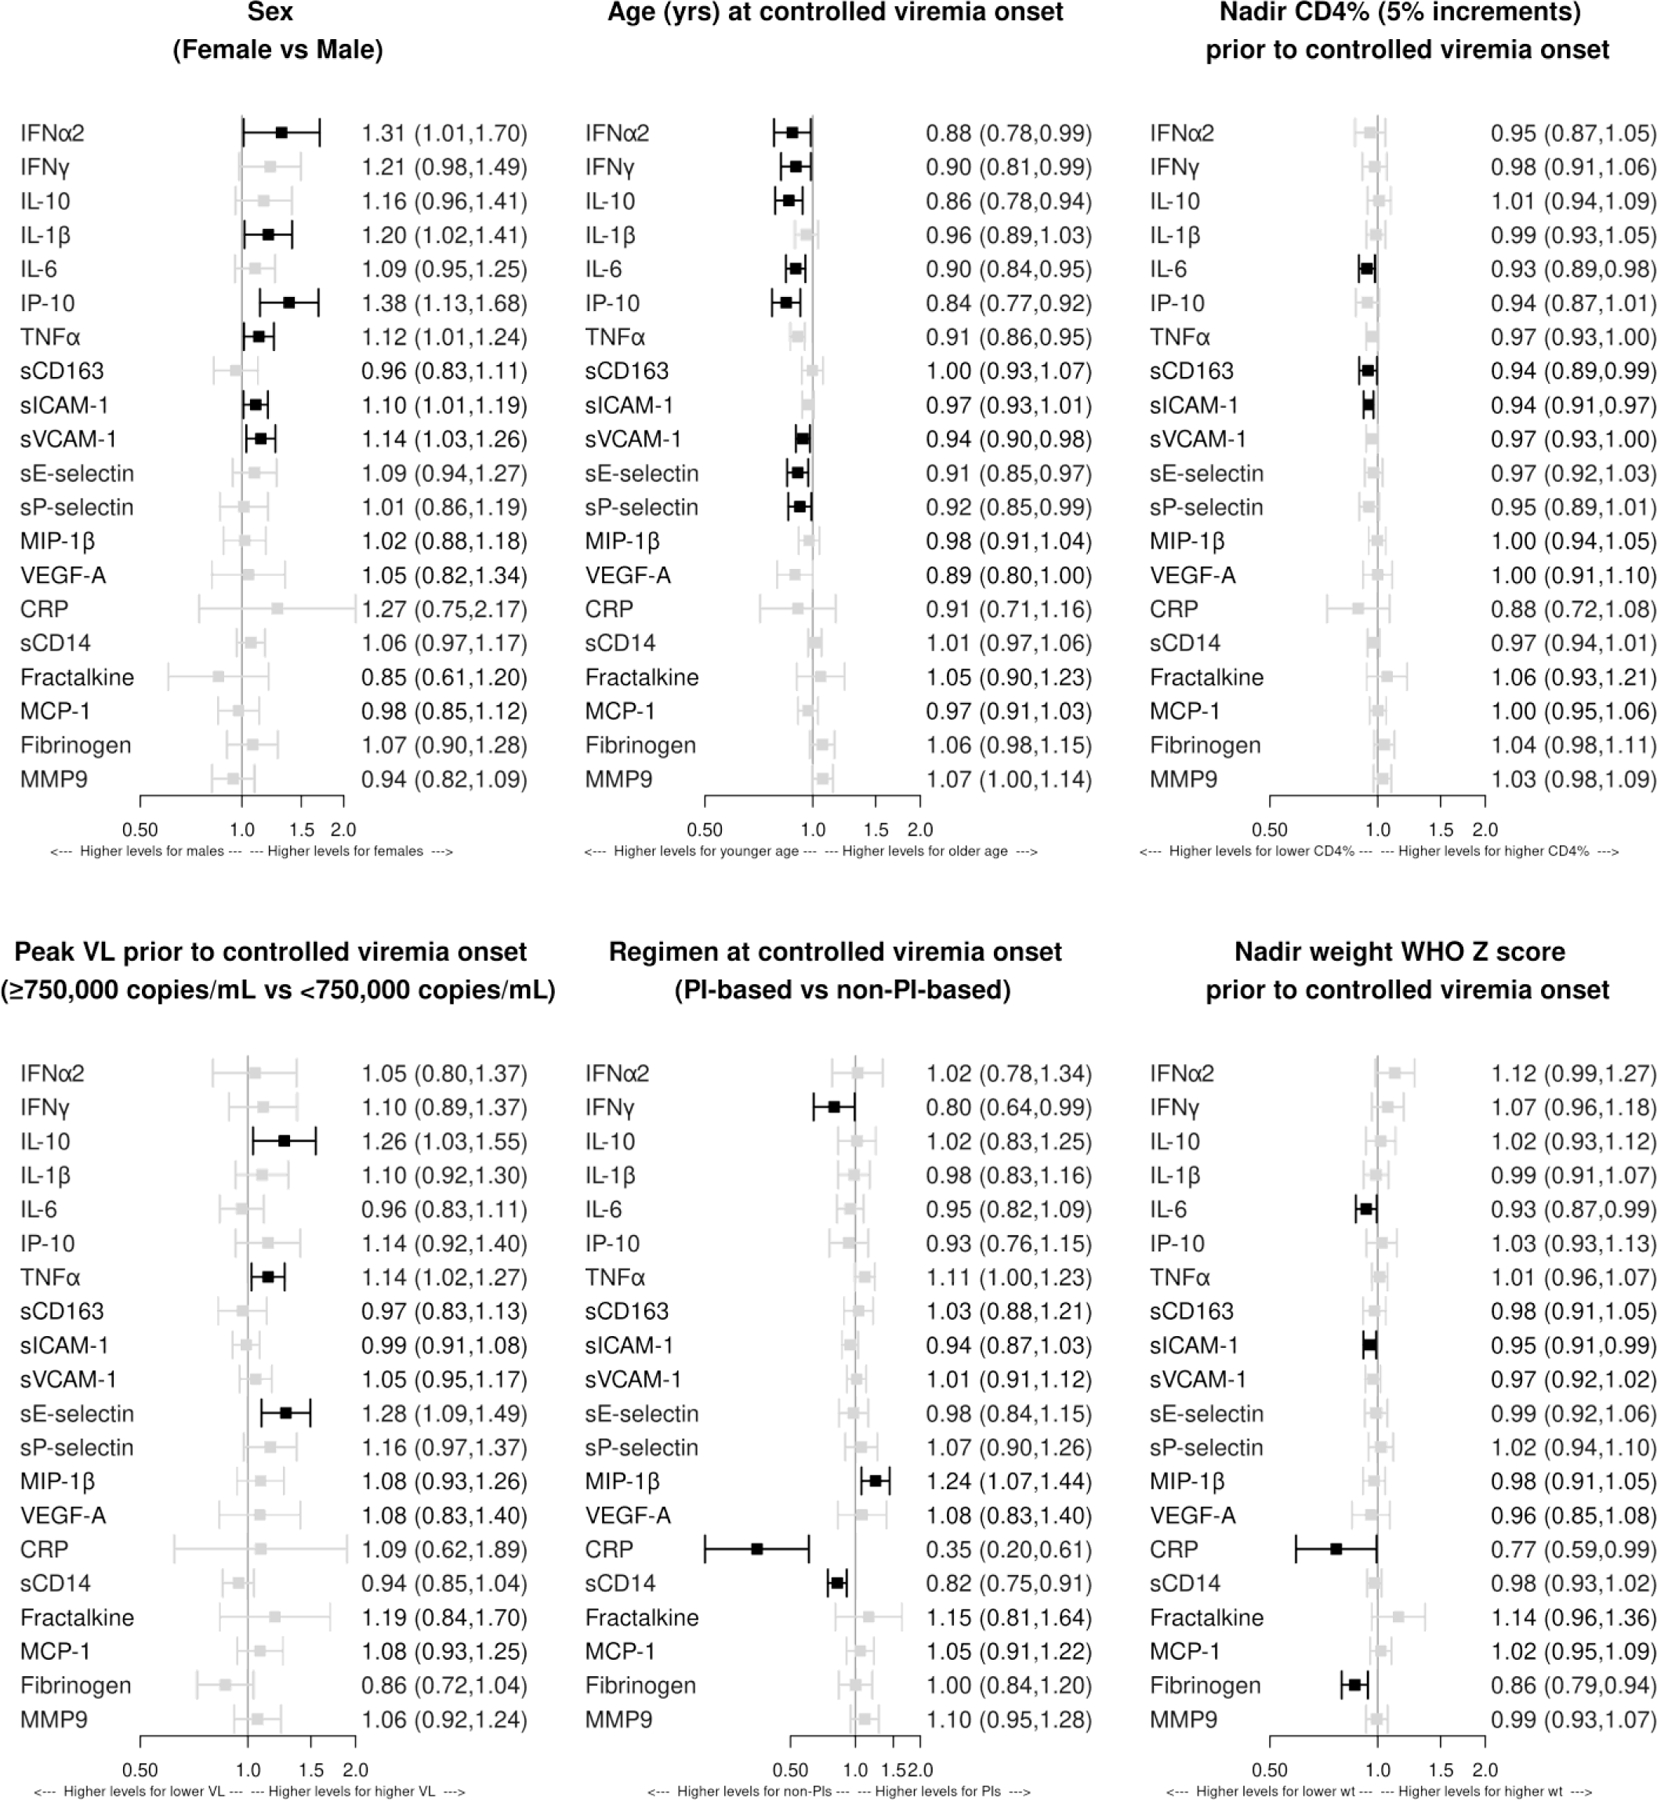
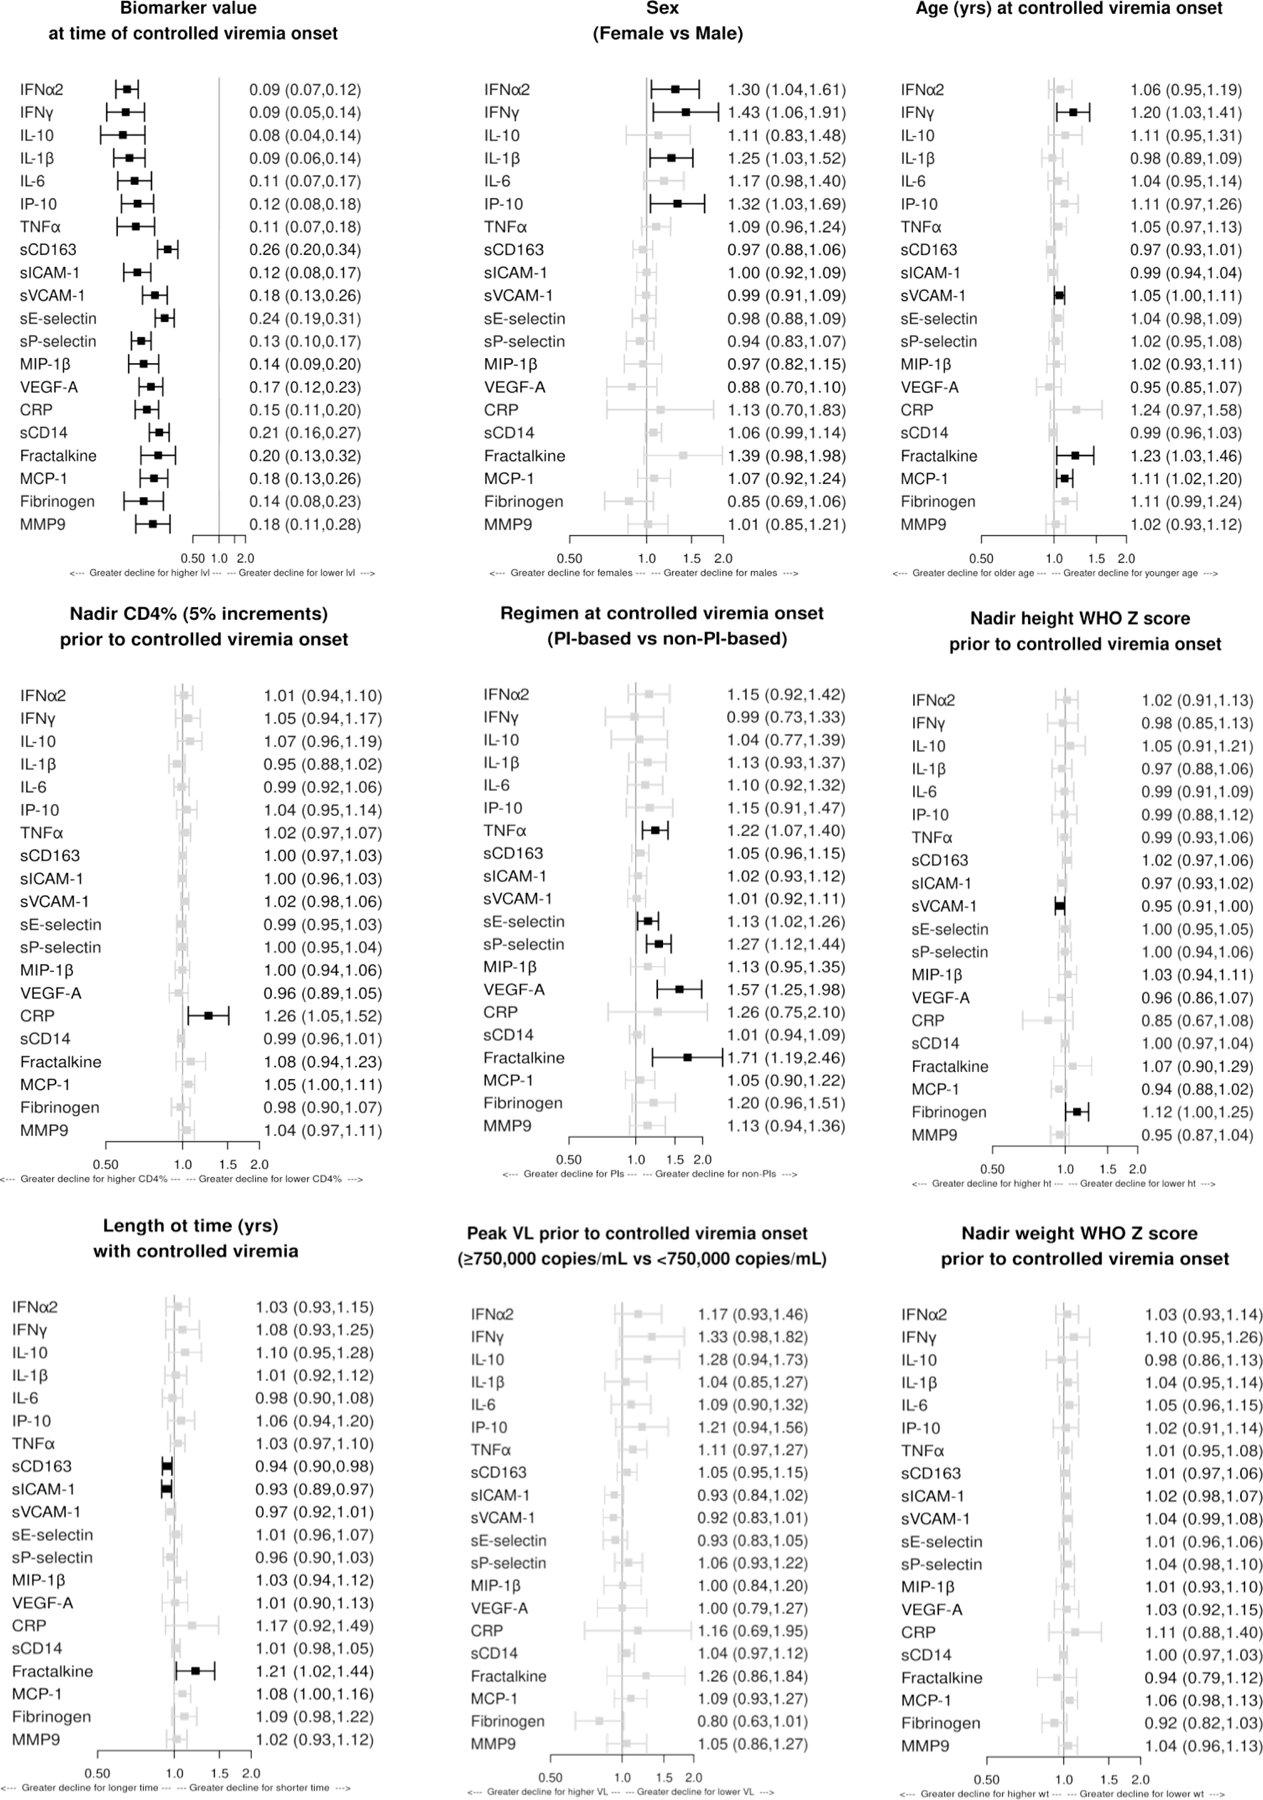
Results: The 213 participants had median ages of 1.2, 1.9, and 7 years at antiretroviral initiation, Tc, and Te, respectively, with 138 on protease inhibitor-based and 74 on NNRTI-based regimens at Tc. Eighteen markers decreased and two increased from Tc to Te (Te-Tc). Biomarker subsets, particularly cytokines, the chemokine IP-10, and adhesion molecules sICAM-1 and sVCAM-1, correlated at Tc, Te, and Te-Tc. At Tc, higher biomarker levels were associated with younger age, female sex, HIV plasma RNA at least 750 000 copies/ml, lower nadir CD4 + %, lower nadir weight z scores, and NNRTI-based treatment. Greater Te-Tc biomarker declines were associated with younger age, male sex, higher Tc biomarker levels, lower nadir CD4 + %, and NNRTI-based treatment. Duration of controlled viremia and nadir height z scores showed mixed associations.

Conclusion: Biomarker expression showed substantial coordination. Most markers decreased after virologic control. Demographic and clinical variables associated with biomarker patterns were identified. Mechanistic studies of these biomarker patterns are needed to inform interventions to control inflammation.


Conflict of interest statement

Conflict of Interest

AW receives research grants from NIH, GSK, Merck and Janssen, and personal fees from Merck and Seqirus. Other authors do not have anything to declare.

Figures

Figure 1.
Figure 1.. Kinetics of plasma biomarkers in children with PHIV on effective ART.
Data were derived from a total of 213 children with PHIV and HIV-1 plasma RNA (viral load; VL) <400 copies/mL for ≥9 months prior to P1104s entry, including 28 with samples at Tc only, 156 at Tc and Te, and 29 at Te only. Dark box plots show plasma concentrations at the time when children reached sustained controlled viremia (Tc) and light box plots at time of P1104s entry (Te). The order in which the analytes are listed is based on a previously published factor analysis[16]. Data are expressed in ng/ml of plasma for sCD14, sCD163, sICAM-1, sVCAM-1, sE-selectin, sP-selectin, CRP, fibrinogen and MMP9, and pg/ml for all other markers. Fibrinogen and sCD14 significantly increased from Tc to Te and all other markers significantly decreased.
Figure 2.
Figure 2.. Plasma biomarker correlations in children with PHIV on effective ART.
Data were derived from 213 children. Graphs represent heatmaps of pairwise Spearman correlations between the markers indicated on the abscissa and ordinate at the timepoints indicated on the graphs. Coefficients of correlation are displayed on the graphs for correlations with p<0.05. Tc indicates beginning of sustained controlled viremia; Te indicates entry in P1104s when the follow up plasma sample was analyzed.
Figure 3.
Figure 3.. Association of demographic and HIV disease characteristics with biomarker levels at Tc.
Effect sizes greater than 1.0 indicate higher biomarker concentrations at Tc (initiation of controlled viremia), on average, in the comparison group relative to the referent group. Separate multivariable models were fit for each biomarker. The following covariates were included in each model: sex, age at Tc, nadir CD4%, peak plasma HIV RNA copies/ml, antiretroviral regimen at Tc, and nadir height and weight WHO Z score. There were no associations with p<0.05 of biomarker levels at Tc with nadir WHO Z scores for height and, therefore, the panel was omitted. Dark boxes indicate associations with p<0.05.
Figure 4.
Figure 4.. Association of demographic and HIV disease characteristics with changes in biomarker levels from Tc to Te.
Changes were defined by the differences in biomarker concentrations from Tc to Te. Effect sizes greater than 1.0 indicate a lesser relative decline (or greater relative increase) in biomarker concentrations between Tc (initiation of controlled viremia) and Te (entry in P1104s) when follow up sample was collected, on average, in the comparison group relative to the referent group. Separate multivariable models were fit for each biomarker. The following covariates were included in each model: sex, age, antiretroviral regimen and biomarker concentration at Tc; nadir CD4%, height WHO Z score and weight WHO Z score; peak plasma HIV RNA copies/ml; and duration of controlled viremia from Tc to Te. Dark boxes indicate associations with p<0.05.

References

    1. Hunt PW, Lee SA, Siedner MJ. Immunologic Biomarkers, Morbidity, and Mortality in Treated HIV Infection. J Infect Dis 2016; 214 Suppl 2:S44–50. - PMC - PubMed
    1. Wada NI, Bream JH, Martinez-Maza O, Macatangay B, Galvin SR, Margolick JB, et al. Inflammatory Biomarkers and Mortality Risk Among HIV-Suppressed Men: A Multisite Prospective Cohort Study. Clin Infect Dis 2016; 63(7):984–990. - PMC - PubMed
    1. Letizia A, Eller MA, Polyak C, Eller LA, Creegan M, Dawson P, et al. Biomarkers of Inflammation Correlate With Clinical Scoring Indices in Human Immunodeficiency Virus-Infected Kenyans. J Infect Dis 2019; 219(2):284–294. - PubMed
    1. Parmigiani A, Alcaide ML, Freguja R, Pallikkuth S, Frasca D, Fischl MA, et al. Impaired antibody response to influenza vaccine in HIV-infected and uninfected aging women is associated with immune activation and inflammation. PLoS One 2013; 8(11):e79816. - PMC - PubMed
    1. Castillo-Mancilla JR, Brown TT, Palella FJ Jr., Macatangay BJC, Breen EC, Jacobson LP, et al. Partial Normalization of Biomarkers of Inflammation and Immune Activation Among Virally Suppressed Men With HIV Infection and High ART Adherence. Open Forum Infect Dis 2020; 7(4):ofaa099. - PMC - PubMed

Publication types