Review
. 2022 Jul 13;122(13):11830-11895.
doi: 10.1021/acs.chemrev.1c00854. Epub 2022 Apr 20.

Anion-Exchange Membrane Water Electrolyzers

Affiliations
Review

Anion-Exchange Membrane Water Electrolyzers

Naiying Du et al. Chem Rev. .

Abstract

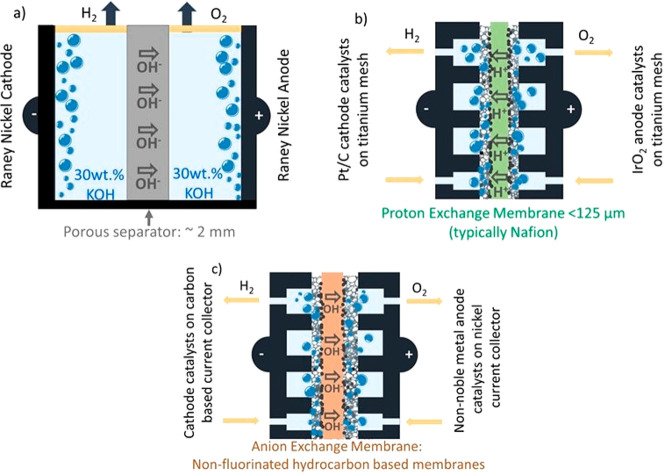
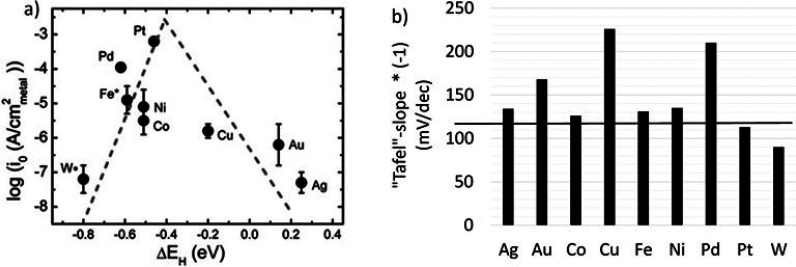
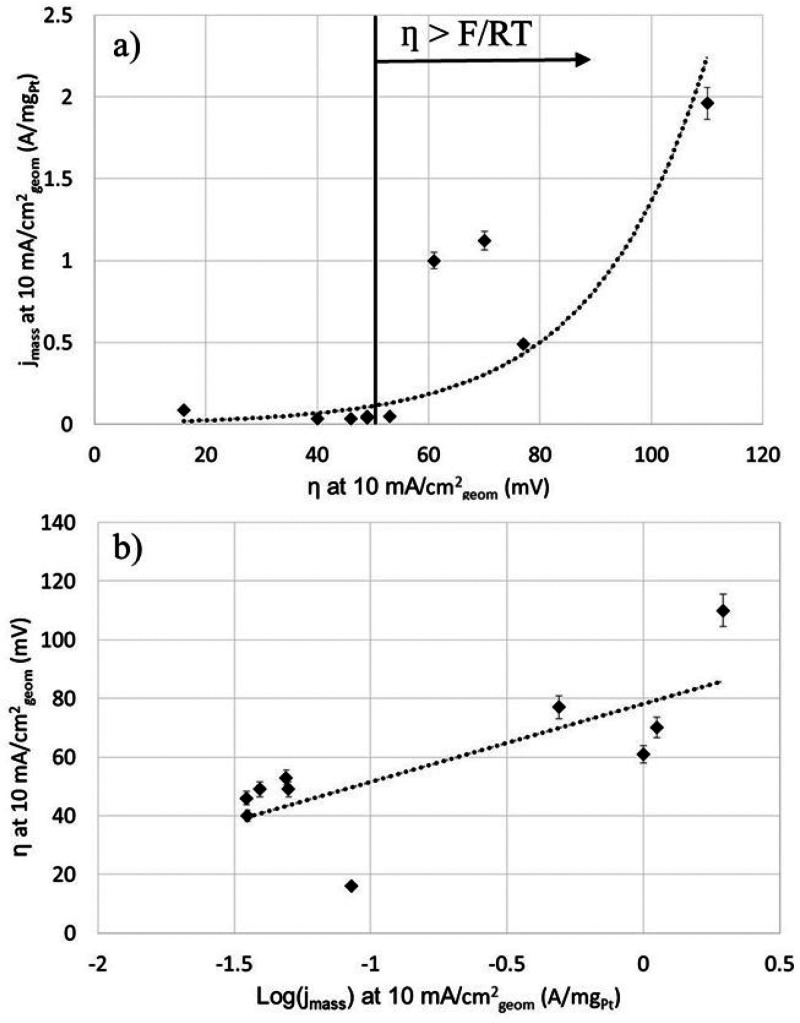
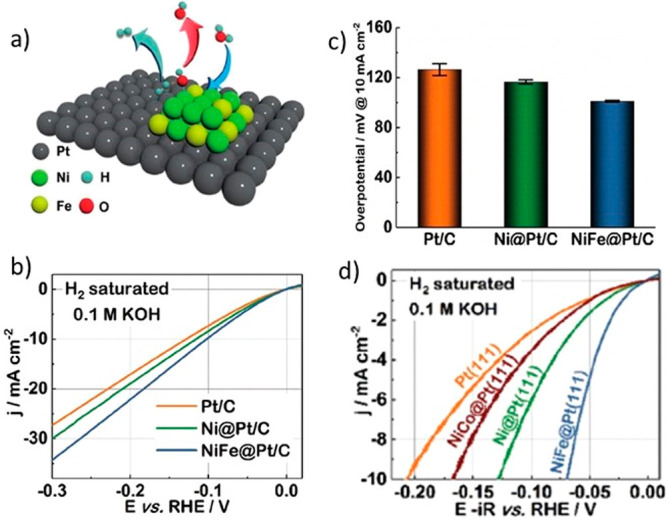
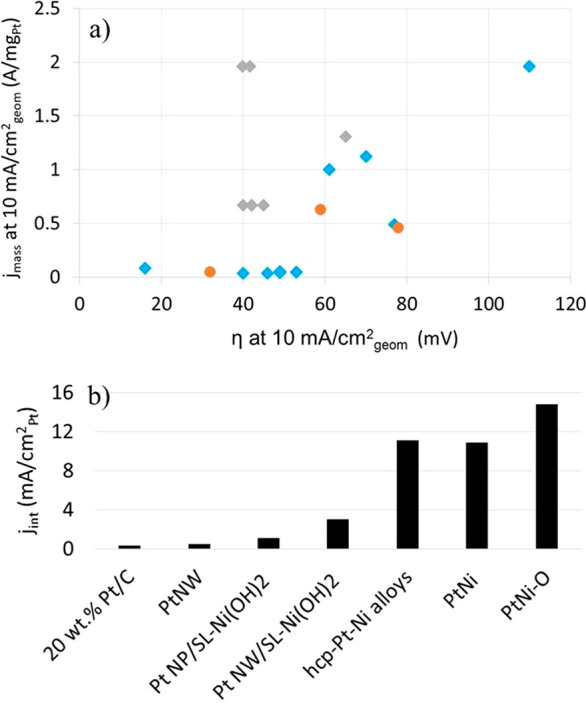
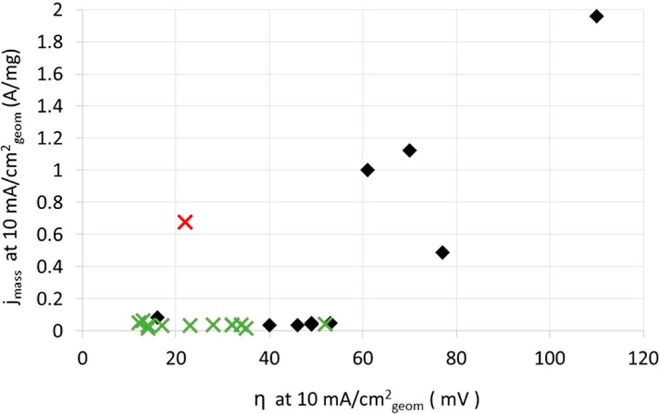
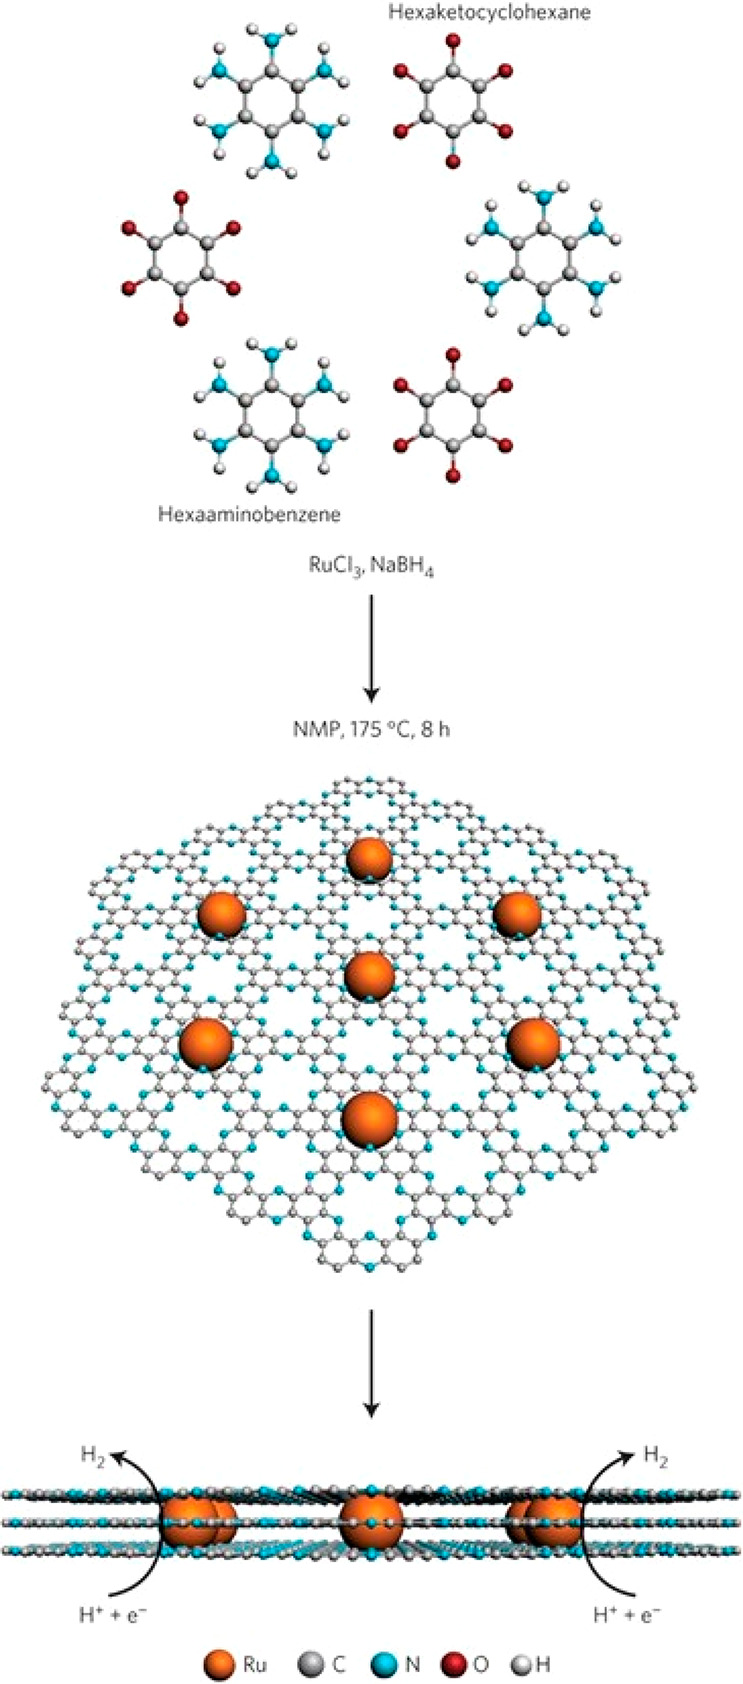
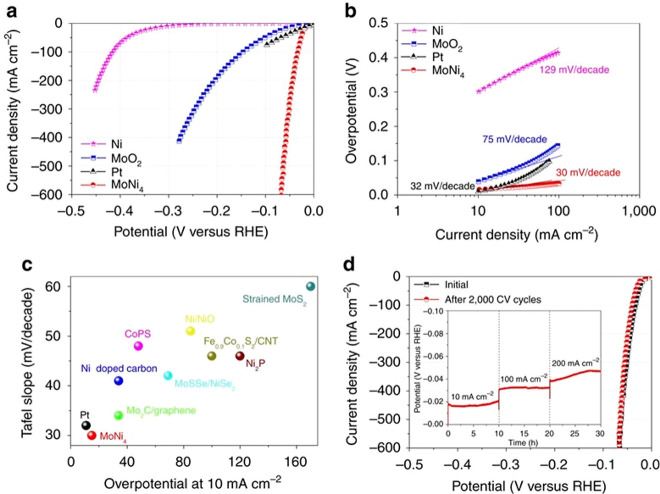
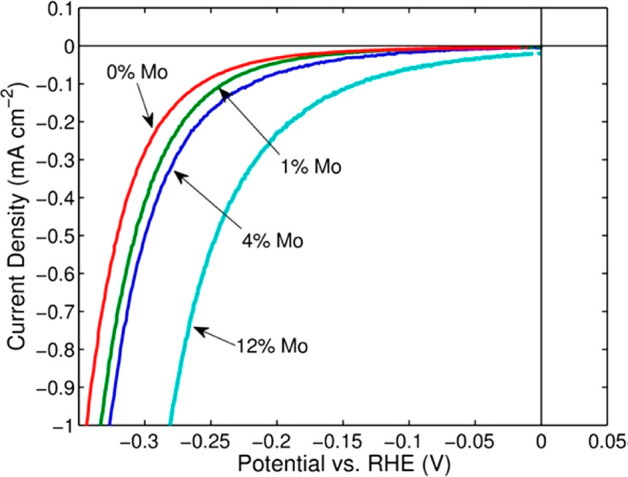
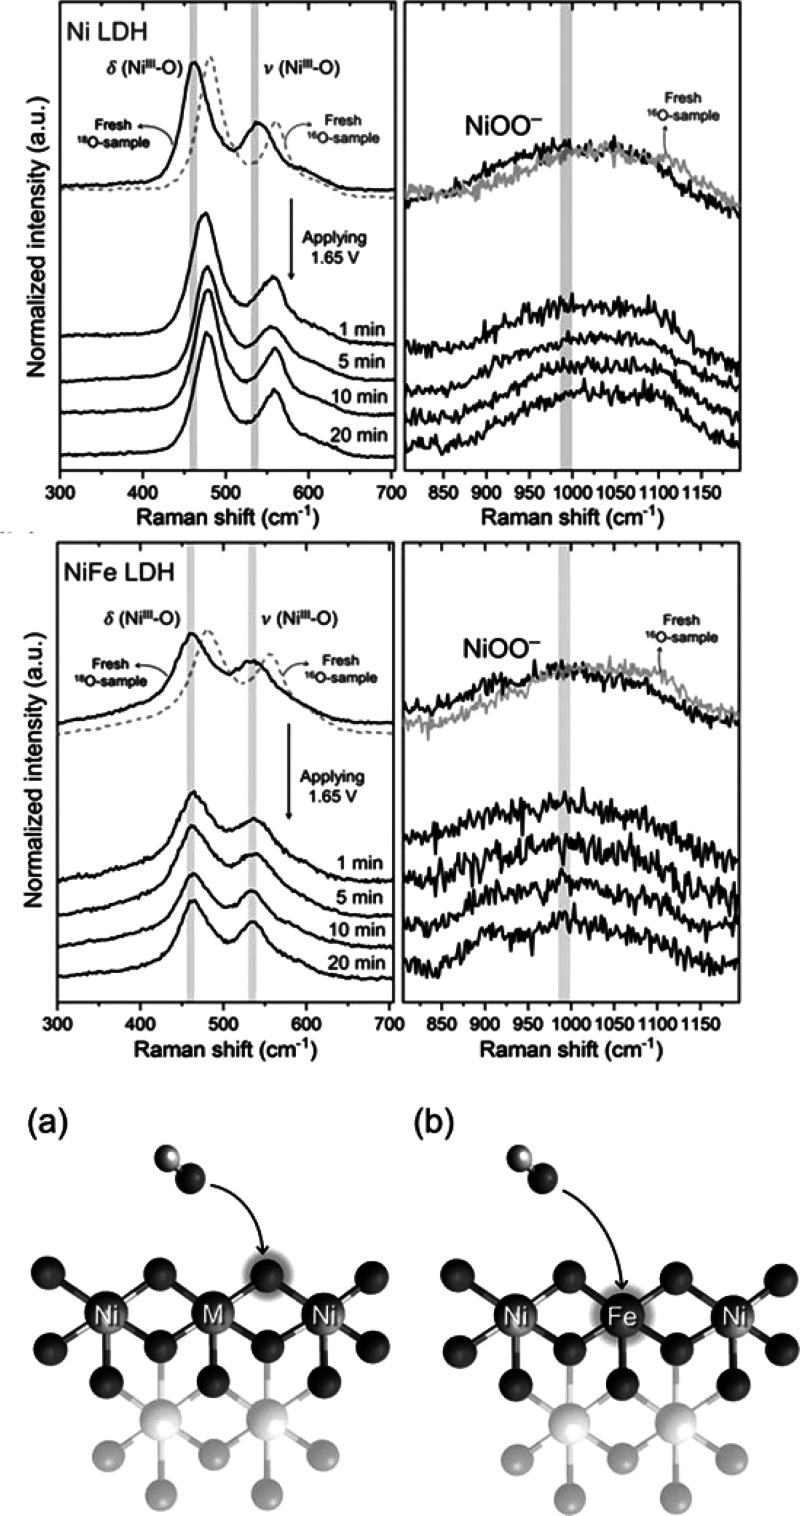
This Review provides an overview of the emerging concepts of catalysts, membranes, and membrane electrode assemblies (MEAs) for water electrolyzers with anion-exchange membranes (AEMs), also known as zero-gap alkaline water electrolyzers. Much of the recent progress is due to improvements in materials chemistry, MEA designs, and optimized operation conditions. Research on anion-exchange polymers (AEPs) has focused on the cationic head/backbone/side-chain structures and key properties such as ionic conductivity and alkaline stability. Several approaches, such as cross-linking, microphase, and organic/inorganic composites, have been proposed to improve the anion-exchange performance and the chemical and mechanical stability of AEMs. Numerous AEMs now exceed values of 0.1 S/cm (at 60-80 °C), although the stability specifically at temperatures exceeding 60 °C needs further enhancement. The oxygen evolution reaction (OER) is still a limiting factor. An analysis of thin-layer OER data suggests that NiFe-type catalysts have the highest activity. There is debate on the active-site mechanism of the NiFe catalysts, and their long-term stability needs to be understood. Addition of Co to NiFe increases the conductivity of these catalysts. The same analysis for the hydrogen evolution reaction (HER) shows carbon-supported Pt to be dominating, although PtNi alloys and clusters of Ni(OH)2 on Pt show competitive activities. Recent advances in forming and embedding well-dispersed Ru nanoparticles on functionalized high-surface-area carbon supports show promising HER activities. However, the stability of these catalysts under actual AEMWE operating conditions needs to be proven. The field is advancing rapidly but could benefit through the adaptation of new in situ techniques, standardized evaluation protocols for AEMWE conditions, and innovative catalyst-structure designs. Nevertheless, single AEM water electrolyzer cells have been operated for several thousand hours at temperatures and current densities as high as 60 °C and 1 A/cm2, respectively.


Conflict of interest statement

The authors declare no competing financial interest.

Figures

Figure 1
Figure 1
Historical trend of the global usage of H2 predominantly produced by utilizing a fossil fuel feedstock divided into industrial sectors. “Other pure” stands for applications needing high-purity H2, “DRI” stands for direct reduced iron steel production, and “Other mixed” stands for applications using H2 as a mixture gas, e.g., fuel or feedstock synthesis gas. Made from ref (1). Copyright 2019 U.S. Department of Energy.
Figure 2
Figure 2
Schematic for the coupling of renewable (wind or solar) energy with water electrolysis. The figure shows options for short-, medium-, and long-term storage for the energy in the form of H2 and possible end uses including payback options. LOHC stands for liquid organic hydrogen carrier.
Figure 3
Figure 3
Schematic of the three types of WEs as (a) traditional alkaline finite WE (AWE), (b) zero-gap PEMWE running under acidic conditions using an H+ conducting membrane, and (c) zero-gap AEMWE utilizing an OH conducting membrane. The goal is to use noble metal-free catalysts for the cathode and anode of an AEMWE.
Figure 4
Figure 4
Schematic of a bipolar membrane (BPM) WE employing a solid AEM (blue) and PEM (red) with a water-dissociation (WD) catalyst layer located at the AEM|PEM interface. The OER and HER take place at the anode, indicated as aPTEal, and the cathode, indicated as cPTEac, respectively. Reprinted with permission from Open Access article. Copyright 2021 Royal Society of Chemistry under CC Attribution 3.0 Unported License https://creativecommons.org/licenses/by/3.0/.
Figure 5
Figure 5
Typical potential (Ecell)–current density (j) curves using arbitrary values demonstrating the cumulative contributions of different voltage losses. The anode and cathode voltages (Ean and Ecat) can be reduced by using catalysts of higher activity and improved catalyst layers, while the ohmic voltage (Eohm) loss depends on both electrode conductivity and membrane ionic conductivity. Both,= potential losses due to gas bubble formation (Ebubble) and ohmic losses (Eohm) are reflected in the iRcell term shown in the simplified eq 5. Many factors influence the actual E losses thar are demonstrated in the figure. Reprinted with permission from (98). Copyright 2017 DTU Energy, Department of Energy and Energy Storage.
Figure 6
Figure 6
Cell voltage (Ecell)–curve as a function of the applied current density for a PEMWE. The influences of T and P are shown. The thermoneutral voltage of 1.48 V, labeled as Utn, and the reversible voltage of 1.23 V, labeled as Urev, are also shown. Reprinted with permission from ref (24). Copyright 2018 Elsevier.
Figure 7
Figure 7
Schematic diagram of components for a single cell of an AEMWE. In this schematic, IrO2-based catalysts and a porous titanium transport layer (PTL) are used at the anode. (The titanium PTL is referred to as GDL in the schematic.) At the cathode (right-hand side), carbon-supported Pt (Pt/C) catalysts and a porous carbon GDL are used. H2O, OH, and gas (H2 and O2) molecule flow are also indicated in the figure. Depending on the AEMWE, other catalyst compositions, e.g., Ni- and Fe-based anode catalysts, are often used. Reprinted with permission from ref (107). Copyright 2019 Elsevier.
Figure 8
Figure 8
Demonstration of the erroneous impact of attempted Tafel slope measurements using slow-sweep voltage polarization, i.e., a nonsteady-state method. The data are for a Co foil measured using a 0.1 M KOH electrolyte. Reprinted with permission from ref (115). Copyright 2021 American Chemical Society.
Figure 9
Figure 9
HER results measured for bulk, single-metal electrodes in 0.1 M KOH. (a) jo versus calculated HBE (ΔH) values revealing a Volcano-plot relationship. (b) Tafel slope values as reported. The horizontal line at −120 mV/dec [shown in (b)] indicates the highest value a Tafel slope can display. (a, b) Reprinted with permission from ref (121). Copyright 2013 American Chemical Society.
Figure 10
Figure 10
Mass current density (jmass) for Pt/C catalysts reported in the literature versus the corresponding η value, both of which were measured at 10 mA/cmgeom2. Additional information about the Pt/C catalysts and the literature references are given in Table S1. (a) The data follow an exponential-type relationship, which is confirmed by (b), which shows essentially the same as (a) but as a plot of η versus the log 10 of jmass of the Pt/C catalysts.
Figure 11
Figure 11
(a) H-spillover mechanism and enhancement of HER activities created by various Ni(OH)2-type clusters deposited on (b, c) Pt/C and (d) bulk Pt(111) crystals. A NiFe(OH)2 cluster on Pt is used to demonstrate the H-spillover mechanism in (a), while Ni(OH)2 and NiFe(OH)2 clusters are deposited on Pt/C powder catalysts for the polarization curves and η values shown in (b) and (c), respectively. (d) Polarization curves for NiCo(OH)2, Ni(OH)2, and NiFe(OH)2 clusters deposited onto bulk Pt(111). The abbreviations NiCo@, Ni@, and NiFe@ for the NiCo(OH)2, Ni(OH)2, and NiFe(OH)2 clusters, respectively, are used in the graphs. Reprinted with permission from ref (140). Copyright 2020 Wiley.
Figure 12
Figure 12
(a) Mass current activities per amount of Pt versus the corresponding η for various Pt–Ni catalysts, both measured at 10 mA/cmgeom2. (b) Plot of the intrinsic activity per ECSA of Pt (jint) measured at η = 70 mV for two Pt-based and a number of Pt–Ni-based catalysts. The data used for (a) and (b) are shown in Tables S2 and S3, respectively. The blue diamonds represent Pt/C, the gray diamonds represent PtxNiy alloys, and the orange circles represent the Pt nanosized catalysts wih Ni(OH) in (a).
Figure 13
Figure 13
Mass activities (jmass) versus the corresponding η values of various supported catalysts, namely, Ru nanoparticles (green crosses), a 2.5 nm Pt1Ru1.54 alloy (red cross), and Pt/C (black diamonds). The jmass and η values are measured at 10 mA/cmgeom2 in 1 M KOH. The mass activities are measured in A/mg noble metal catalyst for the supported Pt1Ru1.54 alloy and the Pt/C catalysts, while in the case of the supported Ru catalysts, the mass activities are in mg per total catalyst, i.e., including the carbon support. Details about the catalysts, the actual values, and the corresponding references are given in Table S4.
Figure 14
Figure 14
Schematic of the synthesis to form nanosized Ru catalysts embedded within holey, two-dimensional carbon nanosheets made of repeating C2N units. Reprinted with permission from ref (143). Copyright 2017 Springer Nature.
Figure 15
Figure 15
HER data extracted for Ni, Pt, and two Mo-based catalysts in 1 M KOH. (a, b) Slow-sweep polarization curves and Tafel slope values extracted from the polarization curves, respectively. (c) Comparison of Tafel slope values to other catalysts reported in the literature. (d) Results for a stabilization test carried out under potential cycling for the MoNi4 catalyst. Reprinted with permission from ref (162). Copyright 2017 Springer Nature.
Figure 16
Figure 16
Polarization data of commercially available and metallurgically prepared Ni and Ni–Mo alloys with varying Mo content. Experiments were performed in 2 M KOH solutions. The Ni and Ni–Mo alloy samples were coin-sized samples prepared by cutting cylindrical rods and were carefully polished to create a smooth surface. Reprinted with permission from ref (178). Copyright 2013 American Chemical Society.
Figure 17
Figure 17
Pourbaix diagrams of cobalt, copper, iron, and nickel in aqueous electrolytes at ambient pressure and 25 °C. The inset shows the voltage–pH range that an anode catalyst may experience in an AEMWE. The diagrams were constructed from ref (204).
Figure 18
Figure 18
Transmission electron microscopy images for various Ir-based catalysts are as follows: (a–c) Ir particles, (d–f) nanosized Ir particles, (g–i) Ir black from Umicore, (j–l) amorphous IrOx from (a) TKK and (b) the rutile form of IrO2. Reprinted with permission from ref (207). Copyright 2019 Elsevier.
Figure 19
Figure 19
Comparison of mass activities (jmass) reported for commercial Ir-oxide powder catalysts versus the corresponding overpotential (η). Both jmass and the corresponding η values were measured at 10 mA/cmgeom2. (b) Enlarged version of (a) demonstrating the variability in the reported data for the lower η range. Details of the Ir-oxide mass loadings on the electrodes and references are given in Table S6. The majority of the Ir-oxides were reported to be IrO2, with the exception of two oxides that are referred to as IrOx, as indicated in (a).
Figure 20
Figure 20
(a) Scanning electron microscopy (SEM) images, (b) XRD patterns, and (c) unit cell structures for Ni(OH)2 and NiFeOxHy catalysts. (b) XRD patterns for different amounts of Fe in the NiFeOxHy catalysts. (c) Interlayer of H2O in the open LDH structure of the NiFeOxHy catalyst. Reprinted with permission from ref (169). Copyright 2014 American Chemical Society.
Figure 21
Figure 21
Effect of a 1 ppm Fe impurity in a 25 wt % KOH electrolyte on the cyclic voltammogram (CV) characteristics of a nickel oxide thin-film electrode. The steep increase in current at ∼0.52 V seen for the CV curve containing the Fe impurity (lower graph) is due to the Fe-impurity-facilitated OER. Reprinted with permission from ref (218). Copyright 1987 IOP Publishing.
Figure 22
Figure 22
OER activity trends for various thin-film catalysts made using Fe-free precursors and Fe-free 1 M KOH electrolyte solutions. (a) η plotted versus the corresponding TOF number for the catalysts. (b) CV characteristics. The mass of the thin films was used to calculate the TOF number. Reprinted with permission from ref (221). Copyright 2015 American Chemical Society.
Figure 23
Figure 23
Influence of the atom % of Fe incorporated into NiOxHy films. (a) CV characteristics of the films showing a continued shift of the redox peaks of the Ni2+/Ni3+ reaction to more-positive potentials, while the onset potential for the OER is shifted to lower values up to 15 atom % Fe, followed by an increase for the higher Fe atom % concentrations. (b) Linear increase of the Ni2+/Ni3+ redox reaction potentials with increasing atom % Fe, while the number of electrons transferred in the film shows a linear decrease. Reprinted with permission from ref (228). Copyright 2013 American Chemical Society.
Figure 24
Figure 24
(a) Tafel slopes measured in a thin-catalyst-layer setup, (b) conductivity of the as-prepared powders, and (c) performance of the OER catalysts in a single-cell AEMWE for a range of OER catalyst powders. The Tafel slopes in (a) were extracted from steady-state measurements in 1 M KOH electrolytes at 20 °C. The AEMWE performances were measured under a pure water feed at 50 °C. Reprinted with permission from ref (208). Copyright 2019 American Chemical Society.
Figure 25
Figure 25
Isotope-exchange experiments and in situ Raman spectra of 18O-labeled (top) Ni and (middle) NiFe LDH, indicating the frequency shift and contribution of oxygen lattice for Ni, while the frequency remains constant for NiFe LDH. The figures at the bottom show the suggested scheme for O2 involvement (a) with and (b) without Fe. Reprinted with permission from ref (266). Copyright 2019 Wiley.
Figure 26
Figure 26
Schematic diagram summarizing the important factors in designing an electrode for high-rate water splitting. Reprinted with permission from ref (274). Copyright 2021 American Chemical Society.
Figure 27
Figure 27
Dissolution rates during transient measurements for nine different metal electrodes (as indicated in the graphs). The metals are grouped according to their electronic structure, i.e., either 3d, 4d, or 5d. Three metals per group were selected. The studies were carried out in 0.05 M NaOH. Reprinted with permission from ref (275). Copyright 2021 Wiley.
Figure 28
Figure 28
Changes in the masses of various thin-film catalysts before and after constant-current experiments at 5 mA/cm2 for 6 h in 1 M KOH. Different loadings of the catalyst were used, as indicated in the figure (loadings 1, 2, and 3). The names of the catalysts and the catalyst compositions (measured before and after 6 h of chronopotentiometric experiments) are also shown in the graphs.
Figure 29
Figure 29
Differences a catalyst can experience in a traditional electrochemical experiment labeled as an aqueous model system (AMS) and in an MEA of an AEMWE cell. The differences can be the electrode architecture, the electrolyte, reactant and product transport, and the operating conditions. Reprinted with permission from ref (277). Copyright 2021 Elsevier.
Figure 30
Figure 30
Examples of different types of common alkaline-stable cations for AEMs. Adapted with modification from ref (36).
Figure 31
Figure 31
Hofmann elimination and nucleophilic degradation occurring via ammonium group displacement.
Figure 32
Figure 32
Conformational analysis of DABCO (one of the syn-periplanar structures is highlighted in red).
Figure 33
Figure 33
Schematic illustration of the processes taking place in the AEM while applying the direct current under the conditions of the conductivity measurement carried out under N2 and H2O atmospheres. Adapted from ref (316) with permission. The black rectangular boxes show the sensor electrodes and the anode and cathode for the two H2O splitting reactions. Closing the circuit turned the system on, allowing a low (typically 100 μA) current flow. The measurement setup shown in the figure yielded in-plane values.
Figure 34
Figure 34
AFM tapping phase images revealing the architecture–morphology–properties relationship of AEMs (BQAPPO and TQAPPO). The xy scales in the AFM images are 100 nm per square. The bright and dark domains in AFM images are designated as the hydrophobic and hydrophilic phases, respectively. Adapted with permission from ref (317). Copyright 2015 Springer Nature.
Figure 35
Figure 35
(a) Structure of a composite copoly(arylene ether sulfone)/nano-ZrO2 AEM designed to simultaneously achieve a high ionic conductivity, low water uptake, and improved thermal, mechanical, and chemical stabilities. Adapted with permission from ref (357). Copyright 2014 Royal Society of Chemistry. The blue dots are nano-ZrO2. (b) Porous-sandwich structure composite AEMs. Adapted with permission from ref (358). Copyright 2018 Elsevier. (c) Electric-field-oriented and magnetic-field-oriented composite AEMs. Adapted with permission from refs ( and 360). Copyright 2014 and 2018 Royal Society of Chemistry, respectively.
Figure 36
Figure 36
Comparison between the water uptake, OH conductivity (σ), and ex situ stability of typical BTMA-, DMP-, ASU-, side-chain-, imidazolium-, phosphonium/sulfonium-, cobaltocenium-, and ruthenium-type AEPs. The water uptake (Wu) corresponds to the σ value at the same temperature (most AEPs are recorded at 80 °C, but some for the side-chain-, imidazolium-, sulfonium-, and ruthenium-type AEPs are plotted at room temperature and 60 °C due to insufficient information). The alkaline stability was recorded based on the temporal stability of AEPs in 1 M NaOH or KOH at 80 °C with degradation <10%, and some of the stable AEPs were evaluated at harsher conditions. Adapted with permission from ref (350). Copyright 2021 Elsevier.
Figure 37
Figure 37
Simplified schematic of the triple-phase (gas, liquid, and solid) boundary for the OER showing the catalyst particles (black) that are in direct contact with the current collector (shown as a gray bar in the figure). The OH-conducting AEI acting as an electrolyte and often also as a binder is shown in blue. In an actual MEA, the catalyst particles form up to several-micrometer-thick layers, and electronic conductions through the catalyst layer (from catalyst particle to adjunct catalyst particles) are needed.
Figure 38
Figure 38
(a) Polarization curves and (b) Nyquist plots for AEMWEs with different (10, 20, and 30 wt %) AEI loadings at 50 °C and (c) field-emission (FE)-SEM images of the MEAs fabricated using the different AEI loadings. KOH (1 M) at 1 mL/min was fed to the anode and cathode. Reprinted with permission from ref (107). Copyright 2019 Elsevier.
Figure 39
Figure 39
SEM images of 2 mg/cm2 CuCoOx anode catalyst layers with (a) 10 wt % and (b) 30 wt % ionomer loadings. (c) Polarization curves of the single AEMWE cells for pure water (dashed lines) and for 0.1 M KOH (solid lines) feed. (d) iR-corrected linear sweep voltammograms of the CuCoOx anode catalyst layers with varying ionomer contents at pH 12.7 (solid) and pH 7 (dashed) of a 0.05 M phosphate buffer solution in a scanning-flow-cell measurement. A Pt loading of 0.5 mg/cm2 was used at the cathode. (c, d) Reprinted with permission from ref (403). Copyright 2022 Elsevier.
Figure 40
Figure 40
(Top) Dependency of the performance for an AEMFC (y-axes) on the adsorption of phenyl from the ionomer for different cathode (H2 oxidation) catalysts. The lower figure shows DFT-calculated adsorption energies for different substituted benzenes on Pt as a function of the system size (C atoms per molecule). Adapted with permission from ref (409). Copyright 2019 American Chemical Society.
Figure 41
Figure 41
Phenyl oxidation of (a) benzyltrimethylammonium hydroxide and (b) polyaromatic AEI at OER potentials. Adapted with permission from ref (415). Copyright 2019 American Chemical Society.
Figure 42
Figure 42
(a) Polarization curves of an AEM water electrolyzer before and after the 100 h test at 2.1 V at 80 °C. (b) 1H NMR spectra of the anode AEI before and after the durability test. The inset in (b) is the expanded view of the oxidized phenol peak in the 1H NMR spectra; * denotes other expected oxidation sites. Adapted with permission from ref (415). Copyright 2019 American Chemical Society.
Figure 43
Figure 43
Schematics of different AEMWE cells including (A) only PTL and (B) the addition of a NiMPL-PTL on the anode and the cathode. (C) AEMWE-cell performances measured at 60 °C for water feed and for configured PTL/PTL (commercial Ni mesh) and NiMPL-PTL/NiMPL-PTL. (D) Electrochemical impedance spectroscopy measurements for the two cell configurations at 0.5 A/cm2 (from 50 kHz to 100 mHz). Reprinted with permission from ref (428). Copyright 2021 Elsevier.
Figure 44
Figure 44
SEM and optical microscopy images for different metal substrates, as follows: (a) 0.065 mm Ni wire mesh, (b) nonwoven stainless steel, (c) nonwoven Ni, (d) nonwoven C–Ni conductive composite, (e) GDE, and (f) stainless steel web. Reprinted with permission from ref (35). Copyright 2020 Royal Society of Chemistry.
Figure 45
Figure 45
Flow-field designs commonly applied in PEMWEs: (A) single serpentine, (B) multiple serpentine, and (C) parallel column. Reprinted with permission from ref (435). Copyright 2019 Royal Society of Chemistry.
Figure 46
Figure 46
(a) Voltage (Ecell) and (b) high-frequency resistance (HFR) versus j curves. The catalysts are at the cathode, PtRu/C 0.36 mgPt/cm2, and at the anode, IrO2 0.75 mgIr/cm2. Dilute KOH or deionized (DI) water serves as the liquid electrolyte. Hexamethyltrimethylammonium-functionalized Diels–Alder polyphenylene (HTMA-DAPP) is used as the AEM and AIE. The AEM wet thickness is 50 μm. All the measurements were conducted at 60 °C and ambient pressure. Reprinted with permission from ref (446). Copyright 2021 IOP Publishing.
Figure 47
Figure 47
Applied voltage breakdown for (a) water, (b) 0.01 M KOH, and (c) 1 M KOH. The dashed line shows the location corresponding to the largest j in (a). (d) Bar graph of the applied-voltage breakdowns at 0.56 A/cm2 (indicated by the dashed lines). The cell overpotential is broken down into the following: anode kinetic losses (blue), cathode kinetic losses (green), high-frequency resistance (HFR) loss (red), catalyst-layer (CL) ohmic loss (yellow), and ion-exchange loss (gray). The anode kinetic losses are further broken down into three parts: anode kinetic losses due to gas-bubble coverage (light blue), anode kinetic losses due to low pH (medium blue), and intrinsic kinetics loss (dark blue). Reprinted with permission from ref (446). Copyright 2021 IOP Publishing.

References

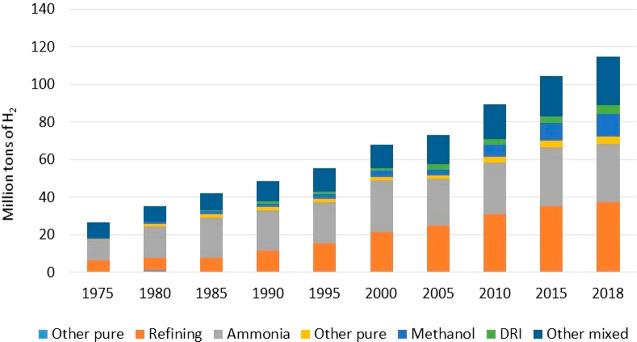
    1. Connelly E.; Elgowainy A.; Ruth M.. Current Hydrogen Market Size: Domestic and Global; DOE Hydrogen and Fuel Cells Program: 2019; pp 1–5.
    1. The Future of Hydrogen; International Energy Agency: 2019; p 18.
    1. Sample Report: Hydrogen Generation Market Analyses; Grand View Research (CVR), 2020; pp 6–7.
    1. Probstein R. F.; Hicks R. E.. Synthetic Fuels; McGraw-Hill: New York, 1982; p 20.
    1. The engineering toolbox. https://www.engineeringtoolbox.com/ (accessed Oct 2020).