. 2022 Apr 22;8(16):eabm9128.
doi: 10.1126/sciadv.abm9128. Epub 2022 Apr 20.

In-person schooling and associated COVID-19 risk in the United States over spring semester 2021

Affiliations

In-person schooling and associated COVID-19 risk in the United States over spring semester 2021

Kirsten E Wiens et al. Sci Adv. .

Abstract

Because of the importance of schools to childhood development, the relationship between in-person schooling and COVID-19 risk has been one of the most important questions of this pandemic. Previous work in the United States during winter 2020-2021 showed that in-person schooling carried some risk for household members and that mitigation measures reduced this risk. Schooling and the COVID-19 landscape changed radically over spring semester 2021. Here, we use data from a massive online survey to characterize changes in in-person schooling behavior and associated risks over that period. We find increases in in-person schooling and reductions in mitigations over time. In-person schooling is associated with increased reporting of COVID-19 outcomes even among vaccinated individuals (although the absolute risk among the vaccinated is greatly reduced). Vaccinated teachers working outside the home were less likely to report COVID-19-related outcomes than unvaccinated teachers working exclusively from home. Adequate mitigation measures appear to eliminate the excess risk associated with in-person schooling.


Figures

Fig. 1.
Fig. 1.. Changes over time in in-person schooling by county.
Distribution of survey responses from 12 January to 31 March (left column), 1 April to 12 June (center column), and change over time (right column). Results are shown for (A) number (n) of survey respondents reporting ≧1 school-aged child in the household, (B) percent reporting in-person schooling, (C) percent of respondents with in-person schooling reporting full-time in-person instruction, and (D) average number of school-based mitigation measures. “Relative amount” in the right column indicates values in 1 April 1 to 12 June (center column) divided by values in 12 January to 31 March (left column). Gray indicates county/periods where fewer than 10 respondents reported in-person schooling.
Fig. 2.
Fig. 2.. Concurrent changes in in-person schooling, vaccination, and variant prevalence.
Changes over time between 12 January and 12 June in (A) percent of respondents living with school-aged children reporting any in-person schooling, (B) average number of school-based mitigation measures, (C) smoothed percent of Global Initiative on Sharing All Influenza Data (GISAID) SARS-CoV-2–sequenced isolates that were Alpha or Delta, and (D) percent of respondents living with school-aged children reporting having received at least one COVID-19 vaccine dose. Top panel line plots show national averages by week weighted using U.S. CTIS survey weights (A and B), state population (C), and county population (D). Bottom panel histograms show the number of county months with the indicated percentages (A, C, and D) or numbers (B). Note that the number of respondents decreased over time (Fig. 1D), which may contribute to the increasing number of zero values in the histograms in June.
Fig. 3.
Fig. 3.. Risk associated with in-person schooling overall and by grade level.
Odds ratios of COVID-19–related outcomes by full- and part-time in-person schooling compared to no in-person schooling, overall and stratified by grade, adjusted for individual- and county-level covariates across the study period from 12 January to 12 June. Note that grade-stratified analyses include only those respondents who reported living with school-aged children in a single grade category, while the overall analyses include all respondents living with school-aged children; thus, the overall estimates do not always fall in between the grade-specific estimates.
Fig. 4.
Fig. 4.. Individual mitigation measures.
(A) Percent of respondents with in-person schooling that reported each mitigation measure being used in January and June, weighted using U.S. CTIS survey weights. (B) Odds ratio of COVID-19–related outcomes among respondents with children in in-person schooling who reported each mitigation measure compared to those with children in in-person schooling who did not report each measure, adjusted for individual- and county-level covariates across the study period from 12 January to 12 June.
Fig. 5.
Fig. 5.. Risk associated with in-person schooling over time by number of reported mitigation measures.
Odds ratio of COVID-19–related outcomes by full- and part-time in-person schooling and number of school-based mitigation measures compared to no in-person schooling, adjusted for individual- and county-level covariates. “Overall” indicates adjusted odds ratios of full-time and part-time schooling with any number of mitigation measures compared to no in-person schooling. Odds ratios are shown across the entire study period from 12 January to 12 June (January–June) as well as within time periods from 12 January to 28 February (January–February), 1 March to 30 April (March–April), and 1 May to 12 June (May–June).
Fig. 6.
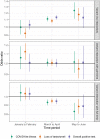
Fig. 6.. Risk associated with in-person schooling and Alpha/Delta variants over time.
Estimated baseline risk (top) associated with the proportion of cases due to the Alpha and Delta variants and interaction with part-time (middle) and full-time (bottom) in-person schooling status. Interaction terms show the additional impact of the variant on top of baseline risk due to part- and full-time in-person schooling. Risk is shown within a 2-month time strata.
Fig. 7.
Fig. 7.. Correlations among vaccination, in-person schooling, and mitigation measures.
Pearson’s correlation coefficients between percent vaccinated with at least one dose of a COVID-19 vaccine, percent of respondents living with school-aged children reporting in-person schooling, and average number of school-based mitigation measures by county and month. Results are shown within time periods of 12 January to 28 February (left), 1 March to 30 April (center), and 1 May 1 to 12 June (right). All coefficients shown were significant (P < 0.05). Limited to county-months with at least five respondents.
Fig. 8.
Fig. 8.. Risk associated with in-person schooling and number of vaccine doses.
(A) Odds ratio of COVID-19–related outcomes by number of reported vaccine doses (0, 1, or 2) and in-person schooling status [living in a household with a child participating in any in-person (any IP) or no in-person (no IP) schooling], adjusted for individual- and county-level covariates. Zero vaccine doses and any in-person schooling is the reference group. (B) Odds ratio of COVID-19–related outcomes with one and two vaccine doses compared to zero doses when data are stratified by none, part-time, and full-time in-person schooling. (C) Odds ratio of COVID-19–related outcomes with part- and full-time in-person schooling compared to no in-person schooling when data are stratified by vaccine doses.
Fig. 9.
Fig. 9.. Risk by occupation and paid work outside the home.
Odds ratio of COVID-19–related outcomes contrasting office workers not reporting extra household work for pay to those in other employment categories not reporting work for pay outside the home (top) and to those reporting work for pay outside the home (bottom). The middle panel shows the odds ratio (i.e., increased risk) within each category associated with working outside the home compared to no work outside the home. Food service workers are excluded from this analysis, because less than 5% reported working exclusively from home (fig. S7).

References

    1. “Map: Where were schools required to be open for the 2020-21 school year?,” Education Week, 28 July 2020; www.edweek.org/leadership/map-where-are-schools-closed/2020/07.
    1. WHO, WHO coronavirus (COVID-19) dashboard; access date: 11 September 2021, https://covid19.who.int.
    1. Centers for Disease Control and Prevention (CDC), COVID data tracker (CDC, 2020); https://covid.cdc.gov/covid-data-tracker.
    1. MCH Strategic Data, COVID-19 IMPACT: School district operational status; access date: 11 September 2021, https://mchstrategicdata.maps.arcgis.com/apps/MapSeries/index.html?appid....
    1. Viner R. M., Mytton O. T., Bonell C., Melendez-Torres G. J., Ward J., Hudson L., Waddington C., Thomas J., Russell S., van der Klis F., Koirala A., Ladhani S., Panovska-Griffiths J., Davies N. G., Booy R., Eggo R. M., Susceptibility to SARS-CoV-2 infection among children and adolescents compared with adults: A systematic review and meta-analysis. JAMA Pediatr. 175, 143–156 (2021). - PMC - PubMed