. 2022 Apr 20;18(4):e1009487.
doi: 10.1371/journal.pcbi.1009487. eCollection 2022 Apr.

All2: A tool for selecting mosaic mutations from comprehensive multi-cell comparisons

Affiliations

All2: A tool for selecting mosaic mutations from comprehensive multi-cell comparisons

Vivekananda Sarangi et al. PLoS Comput Biol. .

Erratum in

Abstract

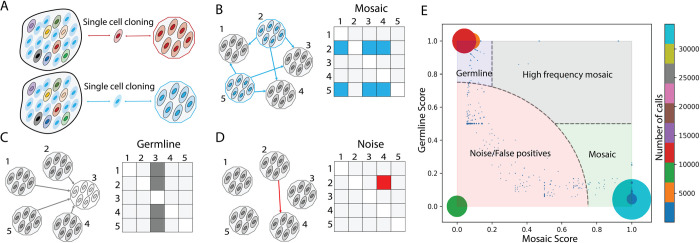
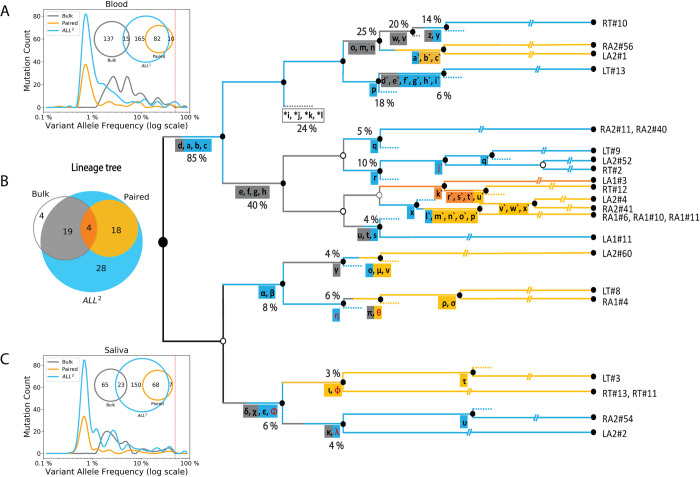
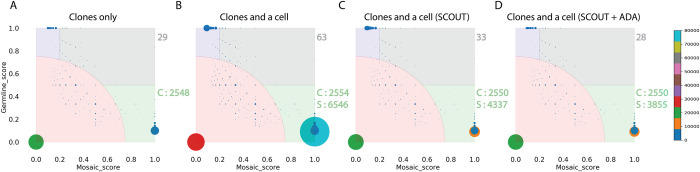
Accurate discovery of somatic mutations in a cell is a challenge that partially lays in immaturity of dedicated analytical approaches. Approaches comparing a cell's genome to a control bulk sample miss common mutations, while approaches to find such mutations from bulk suffer from low sensitivity. We developed a tool, All2, which enables accurate filtering of mutations in a cell without the need for data from bulk(s). It is based on pair-wise comparisons of all cells to each other where every call for base pair substitution and indel is classified as either a germline variant, mosaic mutation, or false positive. As All2 allows for considering dropped-out regions, it is applicable to whole genome and exome analysis of cloned and amplified cells. By applying the approach to a variety of available data, we showed that its application reduces false positives, enables sensitive discovery of high frequency mutations, and is indispensable for conducting high resolution cell lineage tracing.


Conflict of interest statement

The authors have declared that no competing interests exist.

Figures

Fig 1
Fig 1. Conceptual overview of All2 approach and scoring.
(A) A tissue/sample is made up of different cells (ovals) carrying various mosaic mutations (reflected by different colors). Post single cell clonal expansion, rare mosaic mutations (in red) can be easily detected by comparing the clone to the bulk tissue. However, frequent mutations (in blue) will be missed by this approach. (B-D) Each mutation in clone-to-clone (which is cell-to-cell) comparison can be represented by a NxN matrix of pairwise clone comparisons, where each box represents the call between a clone in the row versus a clone in the column. (B) In case of a true mosaic mutation, the calls are arranged as rows in the matrix. The pattern in the matrix shows that the mutation is called in clone 2 and clone 5 when comparing them to other clones. (C) In case of a germline variant, the calls are arranged in a column(s) in the matrix. The displayed pattern suggests that the mutation is present in all clones except clone 3. (D) The pattern has a sporadic distribution of calls in the pairwise matrix and does not suggest either mosaic mutations or germline variants. Such call is deemed as a false positive or noise. (E) Distribution of mosaic and germline scores for calls (the size of the dot/circle corresponds to the number of calls with the same scores; the color represents number of calls depicted in the colorbar. The plot can be divided into four areas: mosaic mutations (light green area, where the mutations have high mosaic scores and low germline scores), germline variants (light blue area, where the mutations have high germline and low mosiac scores), high frequency mosaic mutations (light gray area, where calls have both high mosaic and high germline scores) and, lastly, noise or false positive calls (light red area).
Fig 2
Fig 2. Calls from All2 enable reconstruction of high-resolution lineage tree.
(A, C) Application of All2 to iPSC clones discovers more variants (cyan) than analysis of deeply sequenced bulk tissues (gray) or pairwise comparison of clonal lines and the bulk (orange). The approach also calls variants across entire VAF spectrum. Analysis of bulk may discover variants with intermediate VAF (1%-10%) which are not sampled in clones. For the displayed comparison, variants with at least two supporting reads in the bulks are considered for each discovery approach. (B) Lineage tree reconstructed from the analysis of 25 clones from an adult individual. Variants discovered from either bulks (gray) or from pairwise (orange) comparisons provide limited information as compared to All2, which is the most comprehensive. Multiple branches in the lineage tree can be traced when using additional variants (cyan) discovered by applying only the All2 approach, which is also reflected in the Venn diagram. SNVs found only in the bulk tissues are marked with asterisks and define putative branch not sampled by clones. INDELs are colored in red and SNVs are colored in black. The percentage values next to branches denote the average fraction of the cells in bulks carrying the mutations. Clone names are shown on the right.
Fig 3
Fig 3. All2 in ADA mode reduces false positive calls from allele dropout in MDA.
(A) Score distribution when applying All2 to 11 clones derived from single brain progenitor cells. There are 29 calls for high frequency (gray area) and 2548 calls for low frequency (green area) mosaic mutations. The ‘C’ points to mosaic calls in the clones). (B) Adding one MDA amplified cell to the analysis results in double the number of calls for high frequency mosaic mutations. Noise also increases. The ‘S’ points to the calls coming from the single cell. (C) Application of a specialized single cell caller SCOUT on the single cell partially mitigates issues with calling, i.e., reduces the noise and the number of mosaic calls. (D) Applying the ADA mode results in almost the same set of high frequency mosaic mutations. The mode also reduced calls for mosaic mutations in single cell without affecting calls in the clones. The color (and size) of the circles corresponds to the number of mutations sharing the same scores as depicted in the colorbar. The mosaic mutations are represented by the light green area, germline muations are represented in light blue area, high frequency mosaic mutations are represented in the light gray area and noise is represented by the light red area.

References

    1. Martincorena I, Fowler JC, Wabik A, Lawson ARJ, Abascal F, Hall MWJ, et al. Somatic mutant clones colonize the human esophagus with age. Science. 2018;362(6417):911–7. doi: 10.1126/science.aau3879 - DOI - PMC - PubMed
    1. Yokoyama A, Kakiuchi N, Yoshizato T, Nannya Y, Suzuki H, Takeuchi Y, et al. Age-related remodelling of oesophageal epithelia by mutated cancer drivers. Nature. 2019;565(7739):312–7. doi: 10.1038/s41586-018-0811-x - DOI - PubMed
    1. Lee-Six H, Øbro NF, Shepherd MS, Grossmann S, Dawson K, Belmonte M, et al. Population dynamics of normal human blood inferred from somatic mutations. Nature. 2018;561(7724):473–8. doi: 10.1038/s41586-018-0497-0 - DOI - PMC - PubMed
    1. Zhang L, Dong X, Lee M, Maslov AY, Wang T, Vijg J. Single-cell whole-genome sequencing reveals the functional landscape of somatic mutations in B lymphocytes across the human lifespan. Proc Natl Acad Sci U S A. 2019;116(18):9014–9. doi: 10.1073/pnas.1902510116 - DOI - PMC - PubMed
    1. Bae T, Tomasini L, Mariani J, Zhou B, Roychowdhury T, Franjic D, et al. Different mutational rates and mechanisms in human cells at pregastrulation and neurogenesis. Science. 2018;359(6375):550–5. doi: 10.1126/science.aan8690 - DOI - PMC - PubMed

Publication types