

Evaluation of the Mexican warning label nutrient profile on food products marketed in Mexico in 2016 and 2017: A cross-sectional analysis
- PMID: 35442949
- PMCID: PMC9067899
- DOI: 10.1371/journal.pmed.1003968
Evaluation of the Mexican warning label nutrient profile on food products marketed in Mexico in 2016 and 2017: A cross-sectional analysis
Abstract
Background: Different nutrient profiles (NPs) have been developed in Latin America to assess the nutritional quality of packaged food products. Recently, the Mexican NP was developed as part of the new warning label regulation implemented in 2020, considering 5 warning octagons (calories, sugar, sodium, saturated fats, and trans fats) and 2 warning rectangles (caffeine and non-nutritive sweeteners). The objective of this cross-sectional study was to evaluate the Mexican NP and other NPs proposed or used in Latin America against the Pan American Health Organization (PAHO) model.
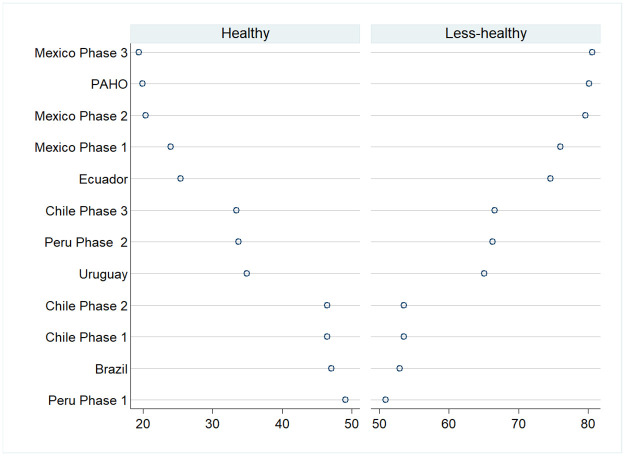
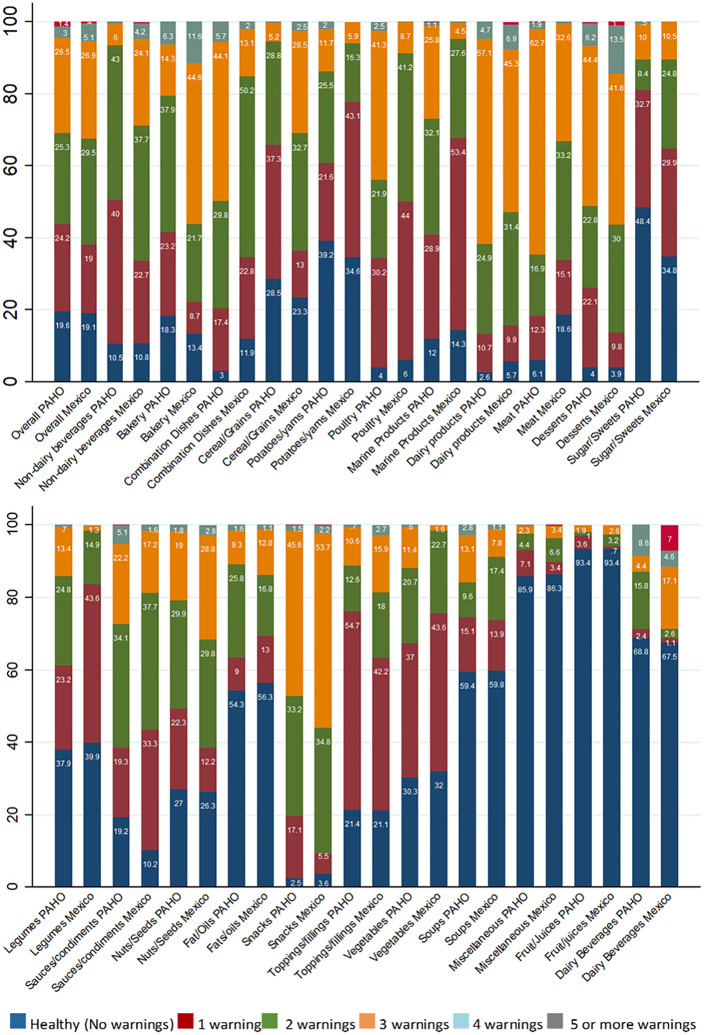
Methods and findings: Nutrition content data of 38,872 packaged food products available in the Mexican market were collected in 2016 and 2017. The evaluation of the Mexican NP, including its 3 implementation phases of increasing stringency (2020, 2023, and 2025), was conducted by comparing the percentage of products classified as "healthy" (without warnings) or "less healthy" (with 1 or more warnings), as well as the number and type of warnings assigned to food products, against the PAHO NP. Using the calibration method, we compared the classifications produced by the PAHO model against those produced by the NP models of Ecuador, Chile (3 phases), Peru (2 phases), Uruguay, and Brazil. Kappa coefficients and Pearson correlations were estimated, and proportion tests were performed. We found that the 3 implementation phases of the Mexican NP had near to perfect agreement in the classification of healthy foods (Mexico NP models: 19.1% to 23.8%; PAHO model: 19.7%) and a strong correlation (>91.9%) with the PAHO model. Other NPs with high agreement with the PAHO model were the Ecuador (89.8%), Uruguay (82.5%), Chile Phase 3 (82.3%), and Peru Phase 2 (84.2%) NPs. In contrast, the Peru Phase 1, Brazil, and Chile Phase 1 NP models had the highest percentage of foods classified as healthy (49.2%, 47.1%, and 46.5%, respectively) and the lowest agreement with the PAHO model (69.9%, 69.3%, and 73%, respectively). Study limitations include that warnings considered by the Mexican NP models were evaluated as if all the warnings were octagon seals, while 2 out of the 7 were rectangular warnings (caffeine and non-nutritive sweeteners), and that our data are limited by the quality of the information reported in the list of ingredients and the nutrition facts table of the products.
Conclusions: The 3 implementation phases of the Mexican NP were useful to identify healthy food products. In contrast, the Peru Phase 1, Brazil, and Chile Phase 1 NP models may have limited usefulness for the classification of foods according to the content of ingredients of concern. The results of this study may inform countries seeking to adapt and evaluate existing NP models for use in population-specific applications.
Conflict of interest statement
The authors have declared that no competing interests exist.
Figures
Similar articles
-
Product reformulation in non-alcoholic beverages and foods after the implementation of front-of-pack warning labels in Mexico.PLoS Med. 2025 Mar 18;22(3):e1004533. doi: 10.1371/journal.pmed.1004533. eCollection 2025 Mar. PLoS Med. 2025. PMID: 40100880 Free PMC article.
-
From the most to the least flexible nutritional profile: Classification of foods marketed in Brazil according to the Brazilian and Mexican models.Front Nutr. 2022 Sep 20;9:919582. doi: 10.3389/fnut.2022.919582. eCollection 2022. Front Nutr. 2022. PMID: 36204372 Free PMC article.
-
Estimated effects of the implementation of the Mexican warning labels regulation on the use of health and nutrition claims on packaged foods.Int J Behav Nutr Phys Act. 2021 Jun 10;18(1):76. doi: 10.1186/s12966-021-01148-1. Int J Behav Nutr Phys Act. 2021. PMID: 34112183 Free PMC article.
-
Impact of color-coded and warning nutrition labelling schemes: A systematic review and network meta-analysis.PLoS Med. 2021 Oct 5;18(10):e1003765. doi: 10.1371/journal.pmed.1003765. eCollection 2021 Oct. PLoS Med. 2021. PMID: 34610024 Free PMC article.
-
A review of implementation and evaluation of Pan American Health Organization's policies to prevent childhood obesity in Latin America.Obes Sci Pract. 2021 Oct 30;8(3):352-362. doi: 10.1002/osp4.572. eCollection 2022 Jun. Obes Sci Pract. 2021. PMID: 35664241 Free PMC article. Review.
Cited by
-
Product reformulation in non-alcoholic beverages and foods after the implementation of front-of-pack warning labels in Mexico.PLoS Med. 2025 Mar 18;22(3):e1004533. doi: 10.1371/journal.pmed.1004533. eCollection 2025 Mar. PLoS Med. 2025. PMID: 40100880 Free PMC article.
-
Food additives and PAHO's nutrient profile model as contributors' elements to the identification of ultra-processed food products.Sci Rep. 2023 Aug 30;13(1):13698. doi: 10.1038/s41598-023-40650-3. Sci Rep. 2023. PMID: 37648698 Free PMC article.
-
Self-reported decreases in the purchases of selected unhealthy foods resulting from the implementation of warning labels in Mexican youth and adult population.Int J Behav Nutr Phys Act. 2024 Jun 14;21(1):64. doi: 10.1186/s12966-024-01609-3. Int J Behav Nutr Phys Act. 2024. PMID: 38877496 Free PMC article.
-
Socioeconomic determinants of overweight and obesity among Mexican children and adolescents: Systematic review and meta-analysis.Obes Rev. 2025 Aug;26(8):e13926. doi: 10.1111/obr.13926. Epub 2025 Apr 10. Obes Rev. 2025. PMID: 40210200 Free PMC article.
-
From the most to the least flexible nutritional profile: Classification of foods marketed in Brazil according to the Brazilian and Mexican models.Front Nutr. 2022 Sep 20;9:919582. doi: 10.3389/fnut.2022.919582. eCollection 2022. Front Nutr. 2022. PMID: 36204372 Free PMC article.
References
-
- WHO Regional Office for Europe. WHO Regional Office for Europe nutrient profile model. Copenhagen: WHO Regional Office for Europe; 2015 [cited 2022 Apr 4]. https://www.euro.who.int/__data/assets/pdf_file/0005/270716/Nutrient-chi....
-
- World Health Organization. Nutrient profiling: report of a WHO/IASO technical meeting. Geneva: World Health Organization; 2011 [cited 2022 Apr 4]. https://apps.who.int/iris/handle/10665/336447.
-
- Pan American Health Organization. Pan American Health Organization nutrient profile model. Washington (DC): Pan American Health Organization; 2016 [cited 2022 Apr 4]. https://iris.paho.org/bitstream/handle/10665.2/18621/9789275118733_eng.pdf.
-
- Labonté M-È, Poon T, Gladanac B, Ahmed M, Franco-Arellano B, Rayner M, et al. Nutrient profile models with applications in government-led nutrition policies aimed at health promotion and noncommunicable disease prevention: a systematic review. Adv Nutr. 2018;9:741–88. doi: 10.1093/advances/nmy045 - DOI - PMC - PubMed
Publication types
MeSH terms
Substances
LinkOut - more resources
Full Text Sources
Medical
Miscellaneous
