. 2022 Apr 20;17(4):e0267268.
doi: 10.1371/journal.pone.0267268. eCollection 2022.

Ultrasound stimulation of the motor cortex during tonic muscle contraction

Affiliations

Ultrasound stimulation of the motor cortex during tonic muscle contraction

Ian S Heimbuch et al. PLoS One. .

Abstract

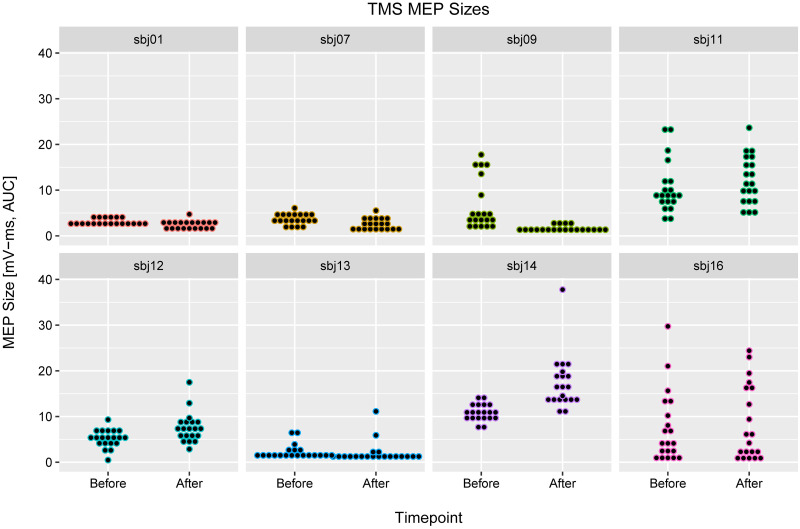
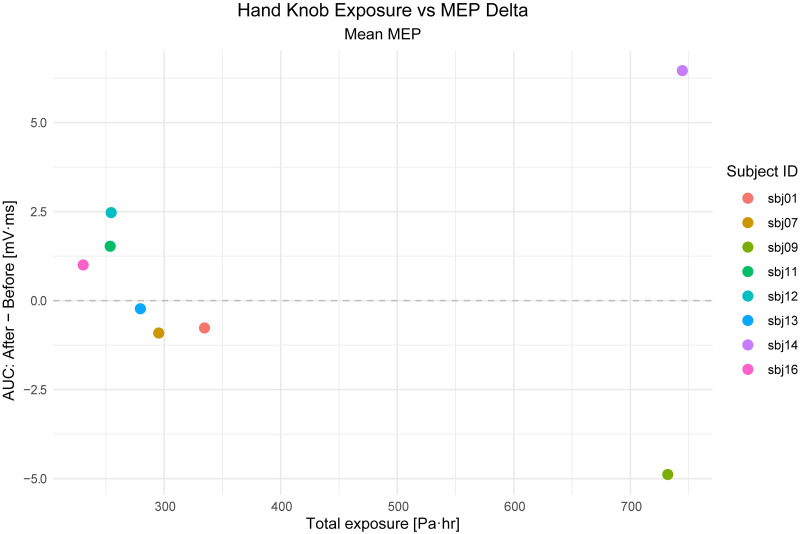
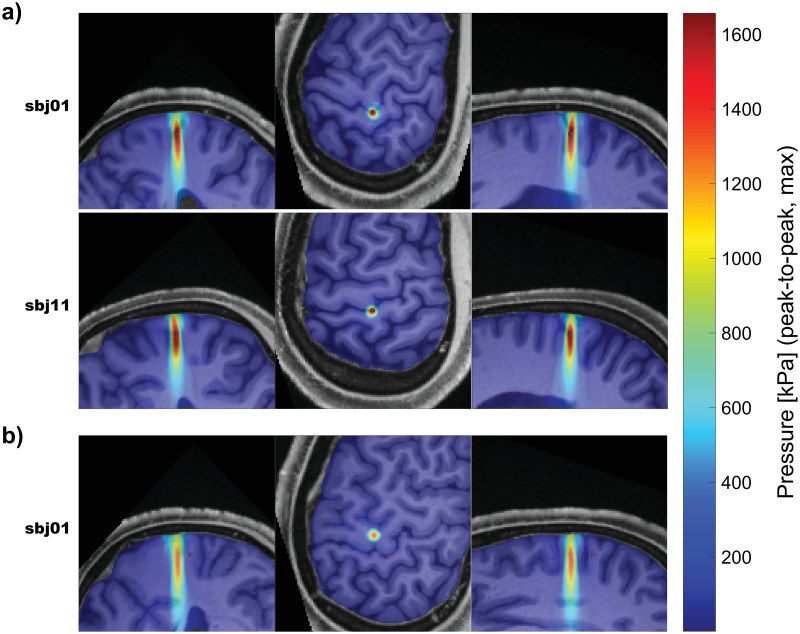
Transcranial ultrasound stimulation (tUS) shows potential as a noninvasive brain stimulation (NIBS) technique, offering increased spatial precision compared to other NIBS techniques. However, its reported effects on primary motor cortex (M1) are limited. We aimed to better understand tUS effects in human M1 by performing tUS of the hand area of M1 (M1hand) during tonic muscle contraction of the index finger. Stimulation during muscle contraction was chosen because of the transcranial magnetic stimulation-induced phenomenon known as cortical silent period (cSP), in which transcranial magnetic stimulation (TMS) of M1hand involuntarily suppresses voluntary motor activity. Since cSP is widely considered an inhibitory phenomenon, it presents an ideal parallel for tUS, which has often been proposed to preferentially influence inhibitory interneurons. Recording electromyography (EMG) of the first dorsal interosseous (FDI) muscle, we investigated effects on muscle activity both during and after tUS. We found no change in FDI EMG activity concurrent with tUS stimulation. Using single-pulse TMS, we found no difference in M1 excitability before versus after sparsely repetitive tUS exposure. Using acoustic simulations in models made from structural MRI of the participants that matched the experimental setups, we estimated in-brain pressures and generated an estimate of cumulative tUS exposure experienced by M1hand for each subject. We were unable to find any correlation between cumulative M1hand exposure and M1 excitability change. We also present data that suggest a TMS-induced MEP always preceded a near-threshold cSP.


Conflict of interest statement

The authors have declared that no competing interests exist.

Figures

Fig 1
Fig 1. tUS device and pulse protocol.
(a) tUS transducer in housing used. The cylindrical transducer is seated into the handheld, 3D-printed housing. The signal cable enters from the bottom of the handle (not shown). A 3D tracking attachment is located on the back of the housing. (b) Illustration of a single trial of tUS. A single trial consisted of a 300-ms burst of ultrasound. The tUS device was emitting ultrasound for 36% of the time during the burst (i.e. duty cycle = 36%). The burst consisted of short, 36-ms pulses of ultrasound (i.e. pulse length = 36 ms) repeated every 1 ms (i.e pulse repetition frequency = 1000 Hz). Acoustic frequency of the ultrasound was 500 kHz. Most trials in this experiment were of the 300-ms burst protocol shown here, but a subset (25%) of tUS trials were 500-ms bursts that otherwise used the same parameters shown here (see Methods). C) Illustration of the inter-trial interval for tUS trials. Mean trial interval 10 s with ± 2 s jitter.
Fig 2
Fig 2. Average spectrograms of EMG during tonic contraction.
(a) TMS trials. (b) tUS trials (300-ms tUS duration trials only). Signal around the 1000-Hz range from 0.2–0.5 s during tUS trials is noise recorded from the amplifier. This frequency component matches the pulse repetition frequency. Example EMG traces placed below the spectrograms illustrate timing.
Fig 3
Fig 3. Silence durations across trials, using a sliding window.
Duration is as measured from the start point of a given sliding window iteration. (a) TMS. (b) tUS. X-axis: Timepoint measured from. Middle Trace: Mean silence duration. Inner Margin: SEM. Outer Margin: STD.
Fig 4
Fig 4. cSP length for each TMS intensity, per subject.
Line: median. Ribbon: standard error of the mean. One subject (sbj08) with whom resting motor threshold was used is not shown here (see S8 Fig).
Fig 5
Fig 5. TMS MEP sizes, before and after tUS.
Each subplot contains data from one subject: trials before and after tUS on the left and right, respectively. Each point marks the size of one MEP (area under the curve, mV-ms). Points are organized into vertical-axis bins to allow visualization akin to a violin plot (i.e. original data are not discrete values). Using amplitude instead of area under the curve did not change the results (S15 Fig).
Fig 6
Fig 6. M1hand exposure vs. cortical excitability.
Estimate of total exposure of M1hand to tUS cumulatively during the session (horizontal axis) compared to the change in cortical excitability, as measured by TMS-evoked MEP (vertical axis). Rs = -0.21.
Fig 7
Fig 7. Simulated pressures (examples).
Examples of simulated pressures for targets used in the experiment. These three examples were chosen to highlight how a small spatial deviation can significantly affect sonication exposure at a given coordinate. Simulated pressure maps are overlayed over the respective structural MRI. One example per row; all three dimensions per row. Slices shown were made at the maximum pressure value. Note that these are not standard slices (i.e. coronal, sagittal, horizontal), since the volume was reoriented as part of pre-simulation processing, A small magenta circle denotes the registered M1 coordinate. (a) Two example trajectories that were aimed at the respective subject’s M1hand. (b) One example trajectory that was not aimed at the respective subject’s M1hand. Pressure maps for all subjects and trajectories are available in the (S14 Fig).

Similar articles

Cited by

References

    1. Deffieux T, Younan Y, Wattiez N, Tanter M, Pouget P, Aubry J-F. Low-Intensity Focused Ultrasound Modulates Monkey Visuomotor Behavior. Curr Biol. 2013;23: 2430–2433. doi: 10.1016/j.cub.2013.10.029 - DOI - PubMed
    1. Legon W, Sato TF, Opitz A, Mueller J, Barbour A, Williams A, et al.. Transcranial focused ultrasound modulates the activity of primary somatosensory cortex in humans. Nat Neurosci. 2014;17: 322–9. doi: 10.1038/nn.3620 - DOI - PubMed
    1. Lee W, Kim H, Jung Y, Song I-U, Chung YA, Yoo S-S. Image-guided transcranial focused ultrasound stimulates human primary somatosensory cortex. Sci Rep. 2015;5: 8743. doi: 10.1038/srep08743 - DOI - PMC - PubMed
    1. Wagner T, Valero-Cabre A, Pascual-Leone A. Noninvasive Human Brain Stimulation. Annu Rev Biomed Eng. 2007;9: 527–565. doi: 10.1146/annurev.bioeng.9.061206.133100 - DOI - PubMed
    1. Roth Y, Amir A, Levkovitz Y, Zangen A. Three-dimensional distribution of the electric field induced in the brain by transcranial magnetic stimulation using figure-8 and deep H-coils. J Clin Neurophysiol. 2007;24: 31–38. doi: 10.1097/WNP.0b013e31802fa393 - DOI - PubMed

Publication types

MeSH terms