. 2022 Jul 21;140(3):171-183.
doi: 10.1182/blood.2021014614.

Mechanosensation by endothelial PIEZO1 is required for leukocyte diapedesis

Affiliations

Mechanosensation by endothelial PIEZO1 is required for leukocyte diapedesis

ShengPeng Wang et al. Blood. .

Abstract

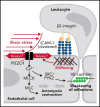
The extravasation of leukocytes is a critical step during inflammation that requires the localized opening of the endothelial barrier. This process is initiated by the close interaction of leukocytes with various adhesion molecules such as ICAM-1 on the surface of endothelial cells. Here we reveal that mechanical forces generated by leukocyte-induced clustering of ICAM-1 synergize with fluid shear stress exerted by the flowing blood to increase endothelial plasma membrane tension and to activate the mechanosensitive cation channel PIEZO1. This leads to increases in [Ca2+]i and activation of downstream signaling events including phosphorylation of tyrosine kinases sarcoma (SRC) and protein tyrosine kinase 2 (PYK2), as well as of myosin light chain, resulting in opening of the endothelial barrier. Mice with endothelium-specific Piezo1 deficiency show decreased leukocyte extravasation in different inflammation models. Thus, leukocytes and the hemodynamic microenvironment synergize to mechanically activate endothelial PIEZO1 and subsequent downstream signaling to initiate leukocyte diapedesis.


Figures

None
Graphical abstract
Figure 1.
Figure 1.
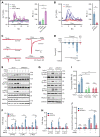
PIEZO1 mediates leukocyte transendothelial migration in vitro. (A) HUVECs pretreated with 10 ng/mL TNFα were transfected with 360 siRNAs pools against RNAs encoding transmembrane proteins expressed in endothelial cells and were then exposed to THP-1 monocytic cells for 3 hours. Shown is the ratio of THP-1 cells that transmigrated the HUVEC monolayer transfected with a particular siRNA pool and with control siRNA. The plot shows the ranked average ratios of 3 independent experiments. (B) HUVECs were transfected with control (siCtrl) or PIEZO1-specific siRNA (siPIEZO1), and rolling, adhesion, and transmigration of human PMNs applied together with flow (1.2 dynes/cm2) were analyzed (n = 8 independent experiments per group). Cells treated with control siRNA were set as 100%. (C-I) The indicated endothelial cells were transfected with control (siCtrl) or PIEZO1-specific siRNA (siPIEZO1) or were left untransfected (E). (C) Rolling, adhesion, and transmigration of mouse PMNs (n = 8 per group) applied together with flow (1.2 dynes/cm2) to a bEnd.3 cell monolayer. Cells treated with control siRNA were set as 100%. (D,F,G) Transmigration of human peripheral blood mononuclear cells (D) (n = 4 independent experiments per group), human PMNs (F) (n = 6 independent experiments per group), or mouse PMNs (G) (n = 6 independent experiments per group) across HUVECs (D,F) or bEnd.3 cells (G) pretreated without or with 1 μM Yoda1 for 15 minutes. (E) MLECs were isolated from EC-Piezo1-KO and control mice, and transmigration of mouse PMNs was determined after pretreament without or with 1 μM Yoda1 for 15 minutes (n = 5 independent experiments). (H) HUVEC barrier integrity was assessed using an electric cell-substrate impedance sensing (ECIS) system in the absence or presence of 1 μM Yoda1 (n = 8 independent experiments per group). (I) Paracellular permeability of the endothelial monolayer cultured in transwell plates was determined using 40 kDa FITC-dextran (n = 5 independent experiments per group; a.u., arbitrary units). Shown are mean values ± SEM; *P ≤ .05; **P ≤ .01; ***P ≤ .001 (unpaired t test [B-H], 2-way ANOVA [I]).
Figure 2.
Figure 2.
PIEZO1 mediates leukocyte transendothelial migration in vivo. (A) Endothelium-specific PIEZO1-deficient mice (EC-Piezo1-KO) or control animals were injected intraperitoneally with PBS or 500 ng of TNFα, and the number of peritoneal CD11b+;Ly6G+ neutrophils was determined by flow cytometry (n = 4 mice, −TNFα; n = 5 mice, +TNFα). (B-D) EC-Piezo1-KO and control mice were treated with croton oil on 1 ear. Six hours later, animals were euthanized, and ears were immunostained as whole mounts with antibodies against PECAM-1 (blue, endothelium), collagen-IV (red, basement membrane), and MRP14 (green, neutrophil). Arrows indicate neutrophils. Scale bar, 10 μm. (B) Representative images of stained ears. (C) Schematic drawing illustrating the criteria to delineate the 5 positions in which leukocyte are found during extravasation. (D) Distribution pattern of neutrophil positions relative to the endothelium and basement membrane (n = 16 mice, control; n = 14 mice, EC-Piezo1-KO; 3-5 vessels were analyzed per animal). (E-F) Confocal imaging of PMNs and lung microvessels 4 hours after intraperitoneal injection of 1 mg/kg LPS in EC-Piezo-KO and control mice (E). Quantitative analysis of extravasated neutrophils per field (F; n = 6 mice, wild type; n = 6 mice, EC-Piezo1-KO). (G-H) EC-Piezo1-KO and control animals were injected with 50 ng (in 100 µL PBS) IL-1β intrascrotally. After 3 hours, the cremaster muscle was isolated and stained for PECAM-1 and MRP14 (G). The quantitative analysis of extravasated neutrophils per vessel area is shown in panel H (n = 8 mice, control; n = 10 mice, EC-Piezo1-KO; 2-3 vessels were analyzed per animal). (I) EC-Piezo1-KO and control mice were analyzed by intravital microscopy of cremaster venules 4 hours after injection of 50 ng IL-1β for extravasated leukocytes (n = 9 mice per group; 4-10 measurements per animal). (J) Evans blue extravasation was assessed after subcutaneous injection of 20 µL PBS without or with 100 μM of histamine or 100 ng/mL VEGF (n = 8 mice, PBS and histamine; n = 4 mice, VEGF). Shown are mean values ± SEM. n.s., nonsignificant; **P ≤ .01; ***P ≤ .001 (unpaired t test).
Figure 3.
Figure 3.
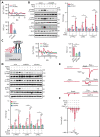
Leukocytes and flow synergistically induce PIEZO1 activation to stimulate endothelial downstream signaling. (A) HUVECs were preactivated with TNFα, loaded with Fluo-4, and exposed to PMNs alone, low flow (1.2 dynes/cm2) alone, or both. [Ca2+]i was determined as fluorescence intensity (RFU, relative fluorescence units). (B) HUVECs transfected with control (siCtrl) or PIEZO1-specific siRNA (siPIEZO1) were preactivated with TNFα, loaded with Fluo-4, and exposed to PMNs and low flow (1.2 dynes/cm2) given together. [Ca2+]i was determined as fluorescence intensity. Five traces representative of the traces of 1 experiment are shown in panels A and B, and the time point of addition of PMNs is indicated by an arrow. The bar diagrams in panels A and B show the area under the curve (AUC) of the [Ca2+]i traces from 6 independent experiments (20-40 cells were analyzed per experiment). (C-D) Currents from MLECs of wild-type (control) or EC-Piezo1-KO mice were recorded in the whole cell patch clamp configuration. The holding potential was −80 mV, and the MLECs were exposed to PMNs, low flow (1.2 dynes/cm2), or both (n = 8-9 independent measurements per condition). (E-H) Immunoblot analysis of total and phosphorylated PYK2, SRC, and MLC in lysates of TNFα-activated HUVECs transfected with control siRNA (siCtrl) or siRNA directed against PIEZO1 and incubated without or with human PMNs in the absence or presence of low flow (1.2 dynes/cm2) (E) or without or with 5 μM Yoda1 (G). Immunoblot analysis of PIEZO1 and GAPDH served as controls. Bar diagrams (F,H) show the densitometric analysis of 3 independent experiments. (I) Transmigration of human PMNs across TNFα-activated HUVECs preincubated for 30 minutes with the PYK2 and SRC inhibitors PF431396 (10 μM) and PP2 (10 μM), respectively (n = 5 independent experiments). (J) HUVECs transfected with control (siCtrl) or PIEZO1-specific siRNA (siPIEZO1) were preactivated with TNFα and exposed to PMNs alone, low flow (1.2 dynes/cm2) alone, or both. After 15 minutes, VE-cadherin internalization was determined as described in Methods (n = 4 independent experiments). Shown are mean values ± SEM. *P ≤ .05; **P ≤ .01; ***P ≤ .001 (1-way ANOVA [A,D]; unpaired t test [B,F,H-J]).
Figure 4.
Figure 4.
Endothelial PIEZO1 activation by leukocytes involves ICAM-1 activation and flow. (A-B) HUVECs were transfected with control siRNA (siCtrl) or siRNA directed against ICAM-1. After treatment with TNFα, cells were exposed to low flow and human PMNs (A) or to flow and PMNs alone or given together (B). Thereafter, the free [Ca2+]i was determined after loading of HUVECs with Fluo4 (A), or immunoblot analysis of total and phosphorylated PYK2, SRC, and MLC was performed (B). Immunoblot analysis of GAPDH served as control. The bar diagram (A) shows the AUC of the [Ca2+]i-trace from 3 independent experiments. The bar diagram (B) shows the densitometric analysis of 3 independent experiments. The arrow in panel A indicates the time point of addition of PMNs. (C-D) TNFα-activated HUVECs transfected with control siRNA (siCtrl) or siRNA directed against ICAM-1 or PIEZO1 were exposed to low flow and anti–ICAM-1 antibody beads (ICAM-1 beads) given together (C) or to low flow and anti–ICAM-1 beads alone or given together (D). Thereafter, the free [Ca2+]i was determined after loading of HUVECs with Fluo-4 (C), or immunoblot analysis of total and phosphorylated PYK2, SRC, and MLC (D) was performed. Traces shown in panel C represent signals from 20 to 40 cells, and the time point of addition of beads is indicated by an arrow. In panel D, immunoblot analysis of GAPDH served as controls. Bar diagrams (C) show the AUC of the [Ca2+]i traces from 3 independent experiments. Bar diagrams (D) show the densitometric analysis of 3 independent experiments. (E-F) Currents from HUVECs pretreated without or with 10 µM Gd3+ or 5 µM GsMTx4 and exposed to low flow (1.2 dynes/cm2), anti–ICAM-1 beads, or both were recorded in the whole cell patch clamp configuration at a holding potential of −80 mV. Shown are characteristic traces (E) and statistical analysis of 5 to 12 independent recordings (F). Shown are mean values ± SEM. *P ≤ .05; **P ≤ .01; ***P ≤ .001 (unpaired t test [A-B]; 1-way ANOVA [C-D,F]).
Figure 5.
Figure 5.
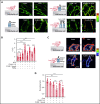
Flow and ICAM-1 clustering synergistically increase endothelial membrane tension. (A-B) Fluorescence lifetime τ1 images of FliptR in TNFα-activated HUVECs kept under static conditions or in the presence of low flow (1.2 dynes/cm2) or exposed to anti–ICAM-1 antibody beads or to anti–ICAM-1 crosslinking antibodies (ICAM-1 XL) without or together with low flow. The color bar corresponds to lifetime in nanoseconds. Scale bar, 15 µm. Corresponding lifetime mean values indicating membrane tension are shown in the bar diagram (B; n = 40 measurements from 5 independent experiments). (C-D) Representative pseudocolored Förster resonance energy transfer (FRET) images of MSS-expressing cells kept under static conditions or in the presence of low flow (1.2 dynes/cm2) or exposed to anti–ICAM-1 crosslinking antibodies (ICAM-1 XL) without or together with low flow (C). The color bar indicates YPet/ECFP emission ratio. Corresponding normalized YPet/ECFP emission ratio of Förster resonance energy transfer (FRET) biosensors indicating membrane tension are shown in the bar diagram (D; n = 15-22 measurements from 3 independent experiments). Shown are mean values ± SEM. n.s., nonsignificant; **P ≤ .01; ***P ≤ .001 (1-way ANOVA).
Figure 6.
Figure 6.
Actin polymerization and actomyosin contractility mediate increase of endothelial membrane tension and downstream signaling induced by ICAM-1 clustering. (A-G) HUVECs were preincubated without or with 10 µM cytochalasin D (CytoD) or 30 µM blebbistatin (Bleb) (A-D) or were transfected with control siRNA (siCtrl) or siRNA directed against the RNA encoding α-actinin-4 (siACTN4) or cortactin (siCTTN) (E-G) and were exposed to low flow alone, anti–ICAM-1 clustering antibodies (ICAM-1 XL) alone or both, and membrane tension was determined using FliptR (A-B,G; n = 20 measurements from 3 independent experiments), or immunoblot analysis of total and phosphorylated PYK2, SRC, and MLC was performed (C-F). Bar diagrams show lifetime mean values (B,G) or immunoblot analysis of total and phosphorylated PYK2, SRC, and MLC (D,F; 3 independently performed immunoblot experiments). (H) Schematic representation showing how fluid shear stress exerted by the flowing blood and leukocyte-induced ICAM-1 clustering synergistically activate PIEZO1 to induce downstream signaling events resulting in opening of the endothelial barrier. Shown are mean values ± SEM. *P ≤ .05; **P ≤ .01; ***P ≤ .001 (1-way ANOVA).

Comment in

References

    1. Gerhardt T, Ley K. Monocyte trafficking across the vessel wall. Cardiovasc Res. 2015;107(3):321-330. - PMC - PubMed
    1. Vestweber D. How leukocytes cross the vascular endothelium. Nat Rev Immunol. 2015;15(11):692-704. - PubMed
    1. Muller WA. Getting leukocytes to the site of inflammation. Vet Pathol. 2013;50(1):7-22. - PMC - PubMed
    1. Nourshargh S, Alon R. Leukocyte migration into inflamed tissues. Immunity. 2014;41(5):694-707. - PubMed
    1. Ley K, Laudanna C, Cybulsky MI, Nourshargh S. Getting to the site of inflammation: the leukocyte adhesion cascade updated. Nat Rev Immunol. 2007; 7(9):678-689. - PubMed

Publication types

MeSH terms