. 2022 May 10;55(5):879-894.e6.
doi: 10.1016/j.immuni.2022.03.018. Epub 2022 Apr 19.

Concerted type I interferon signaling in microglia and neural cells promotes memory impairment associated with amyloid β plaques

Affiliations

Concerted type I interferon signaling in microglia and neural cells promotes memory impairment associated with amyloid β plaques

Ethan R Roy et al. Immunity. .

Abstract

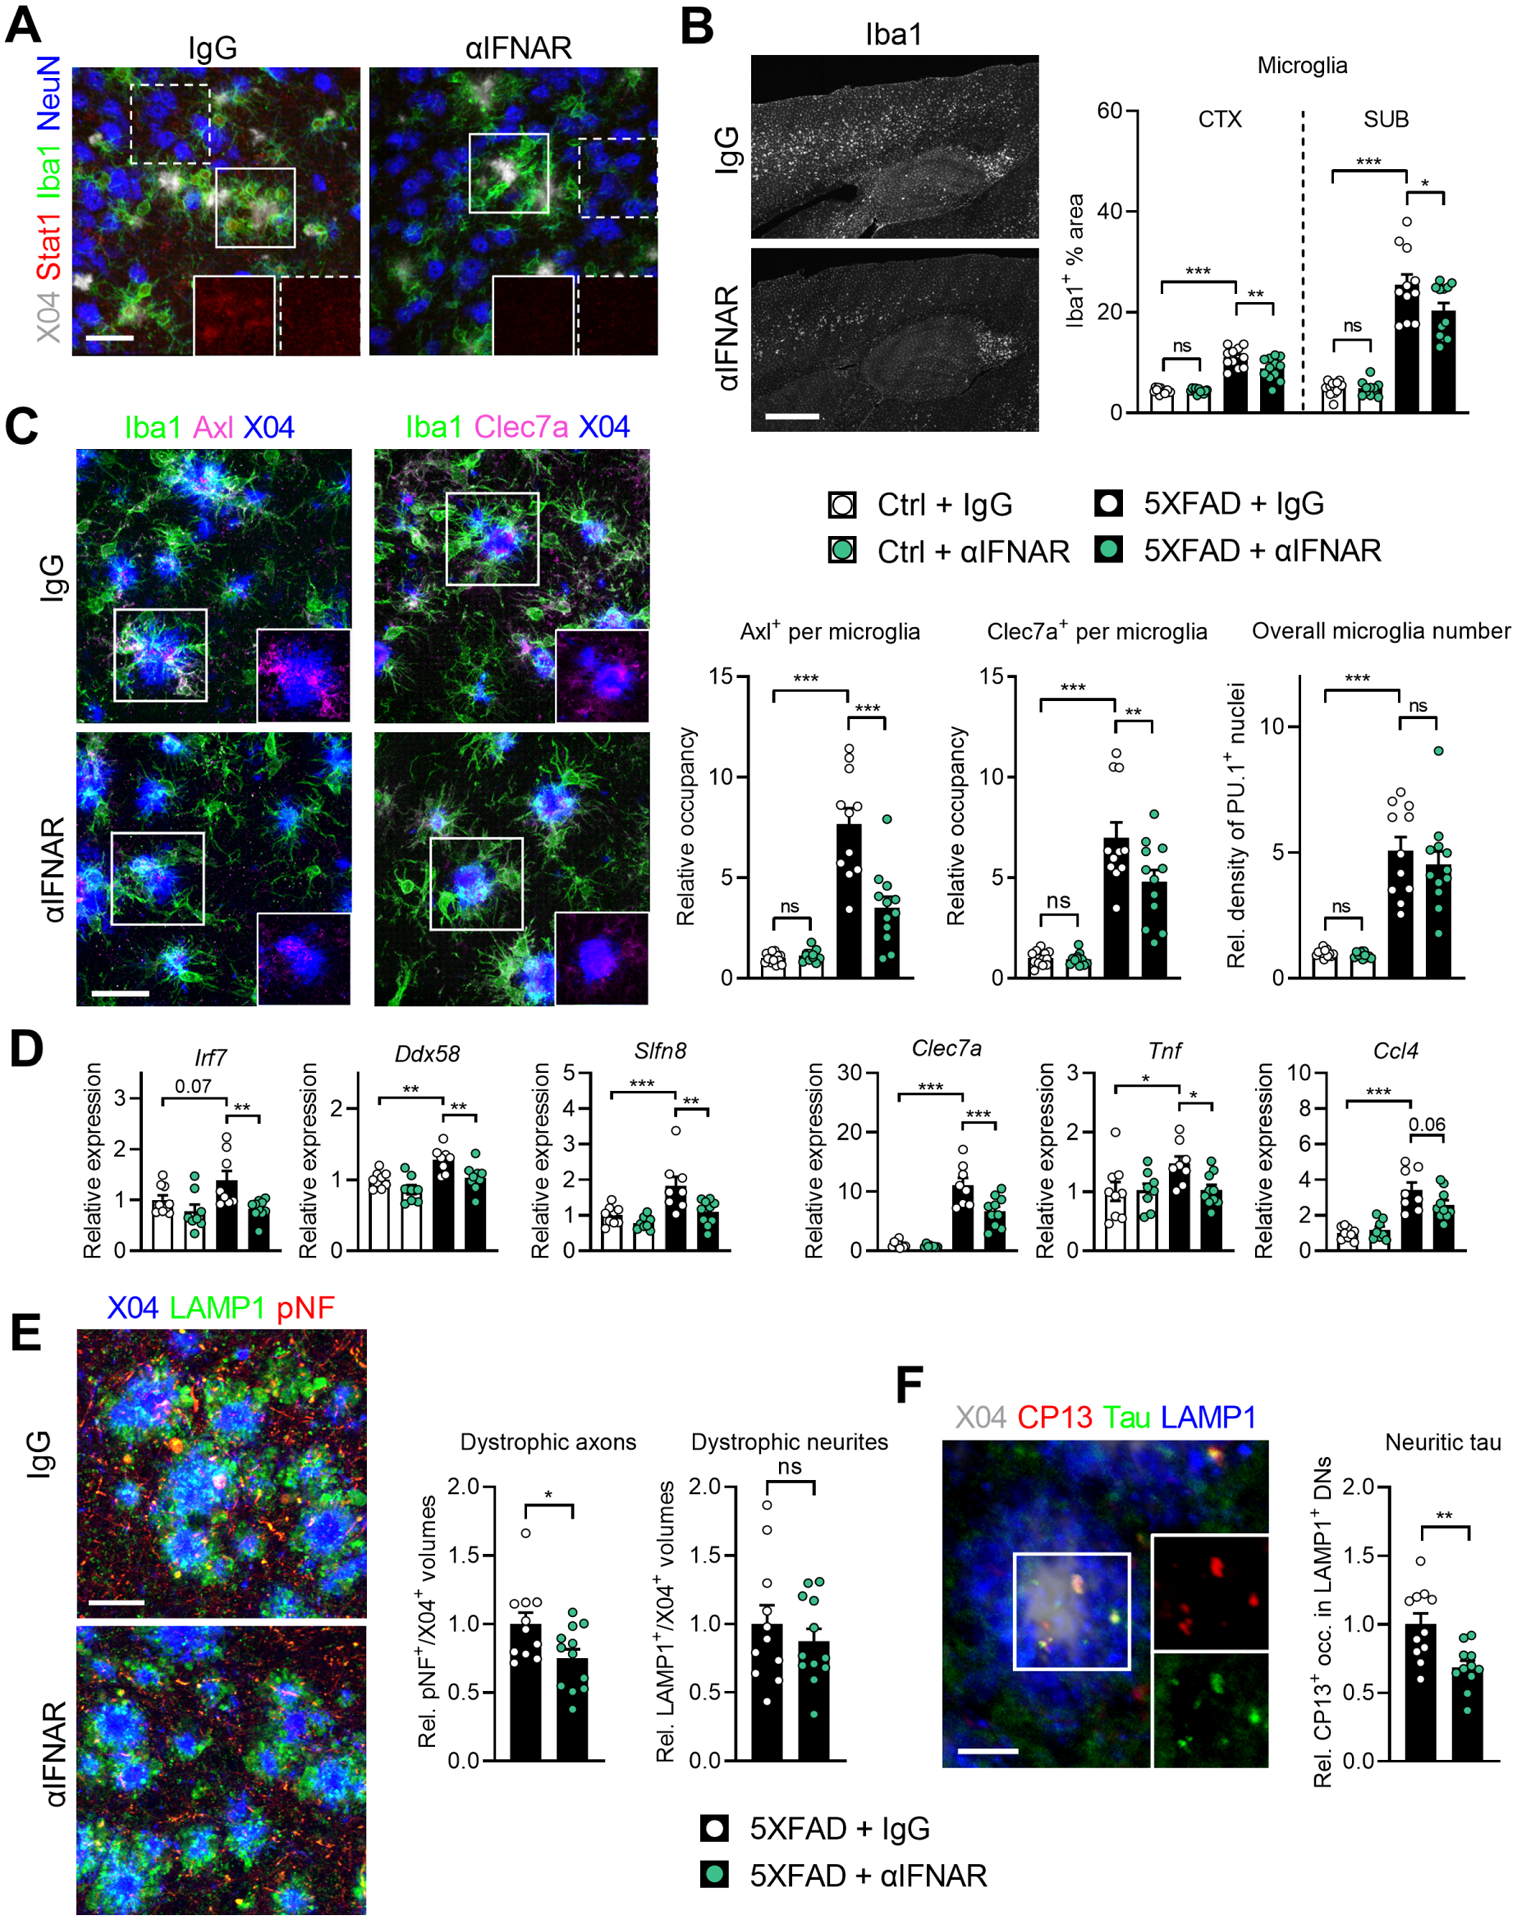
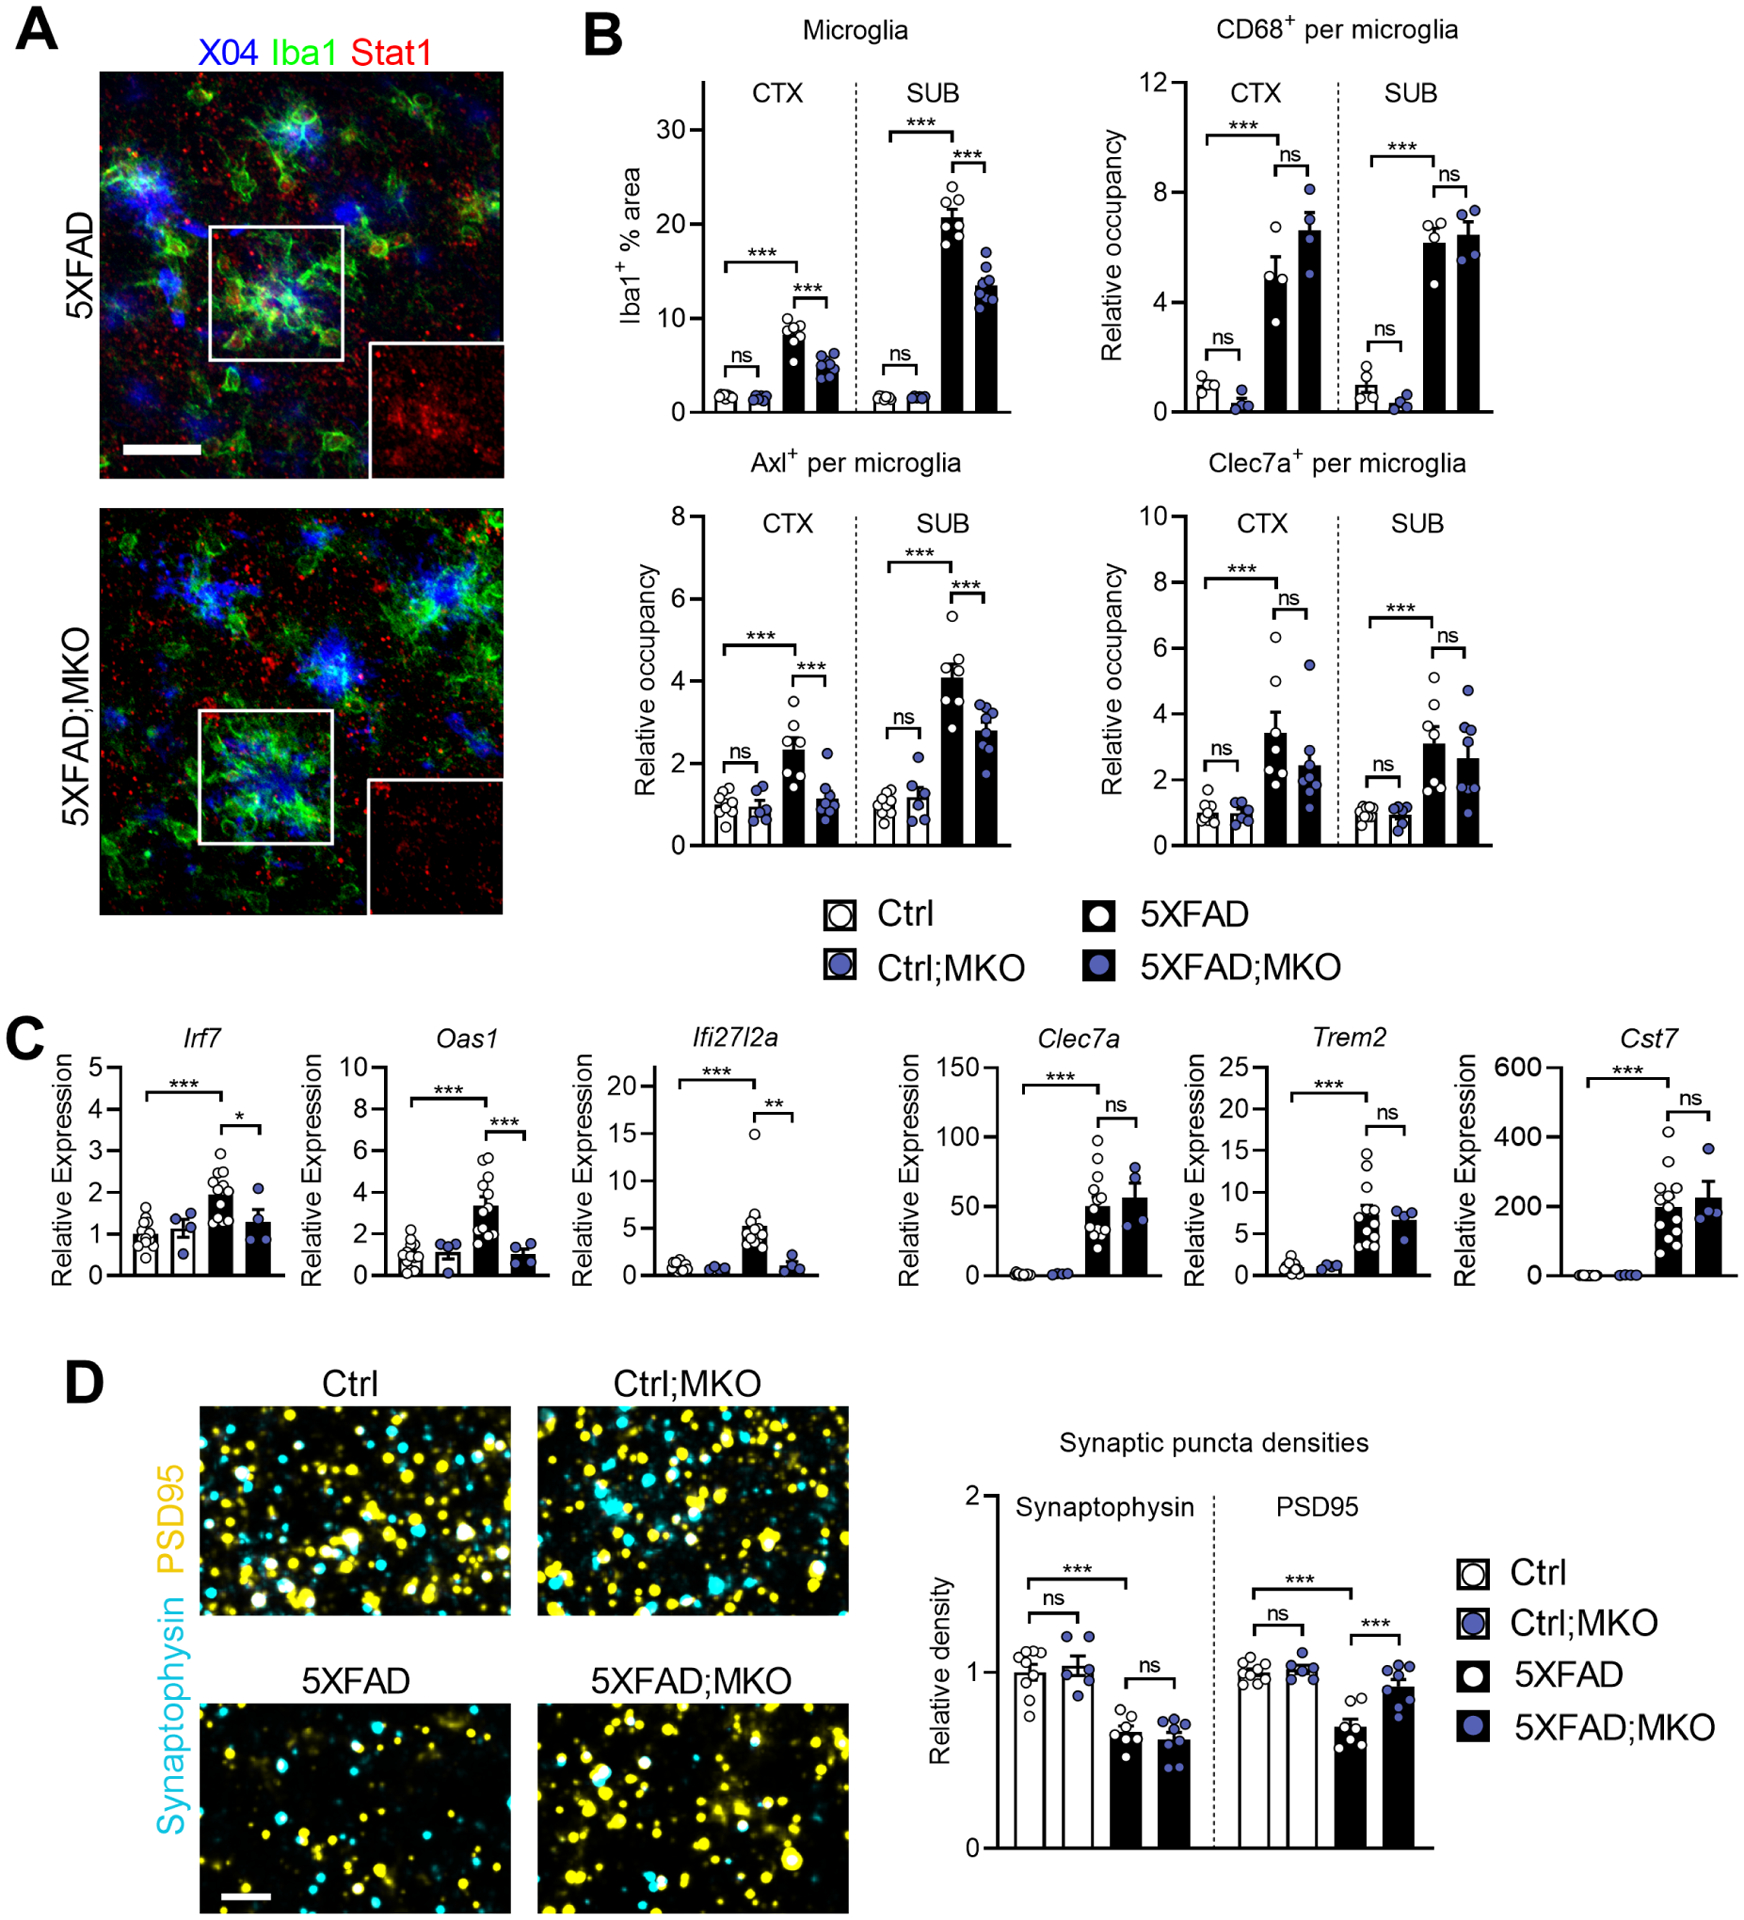
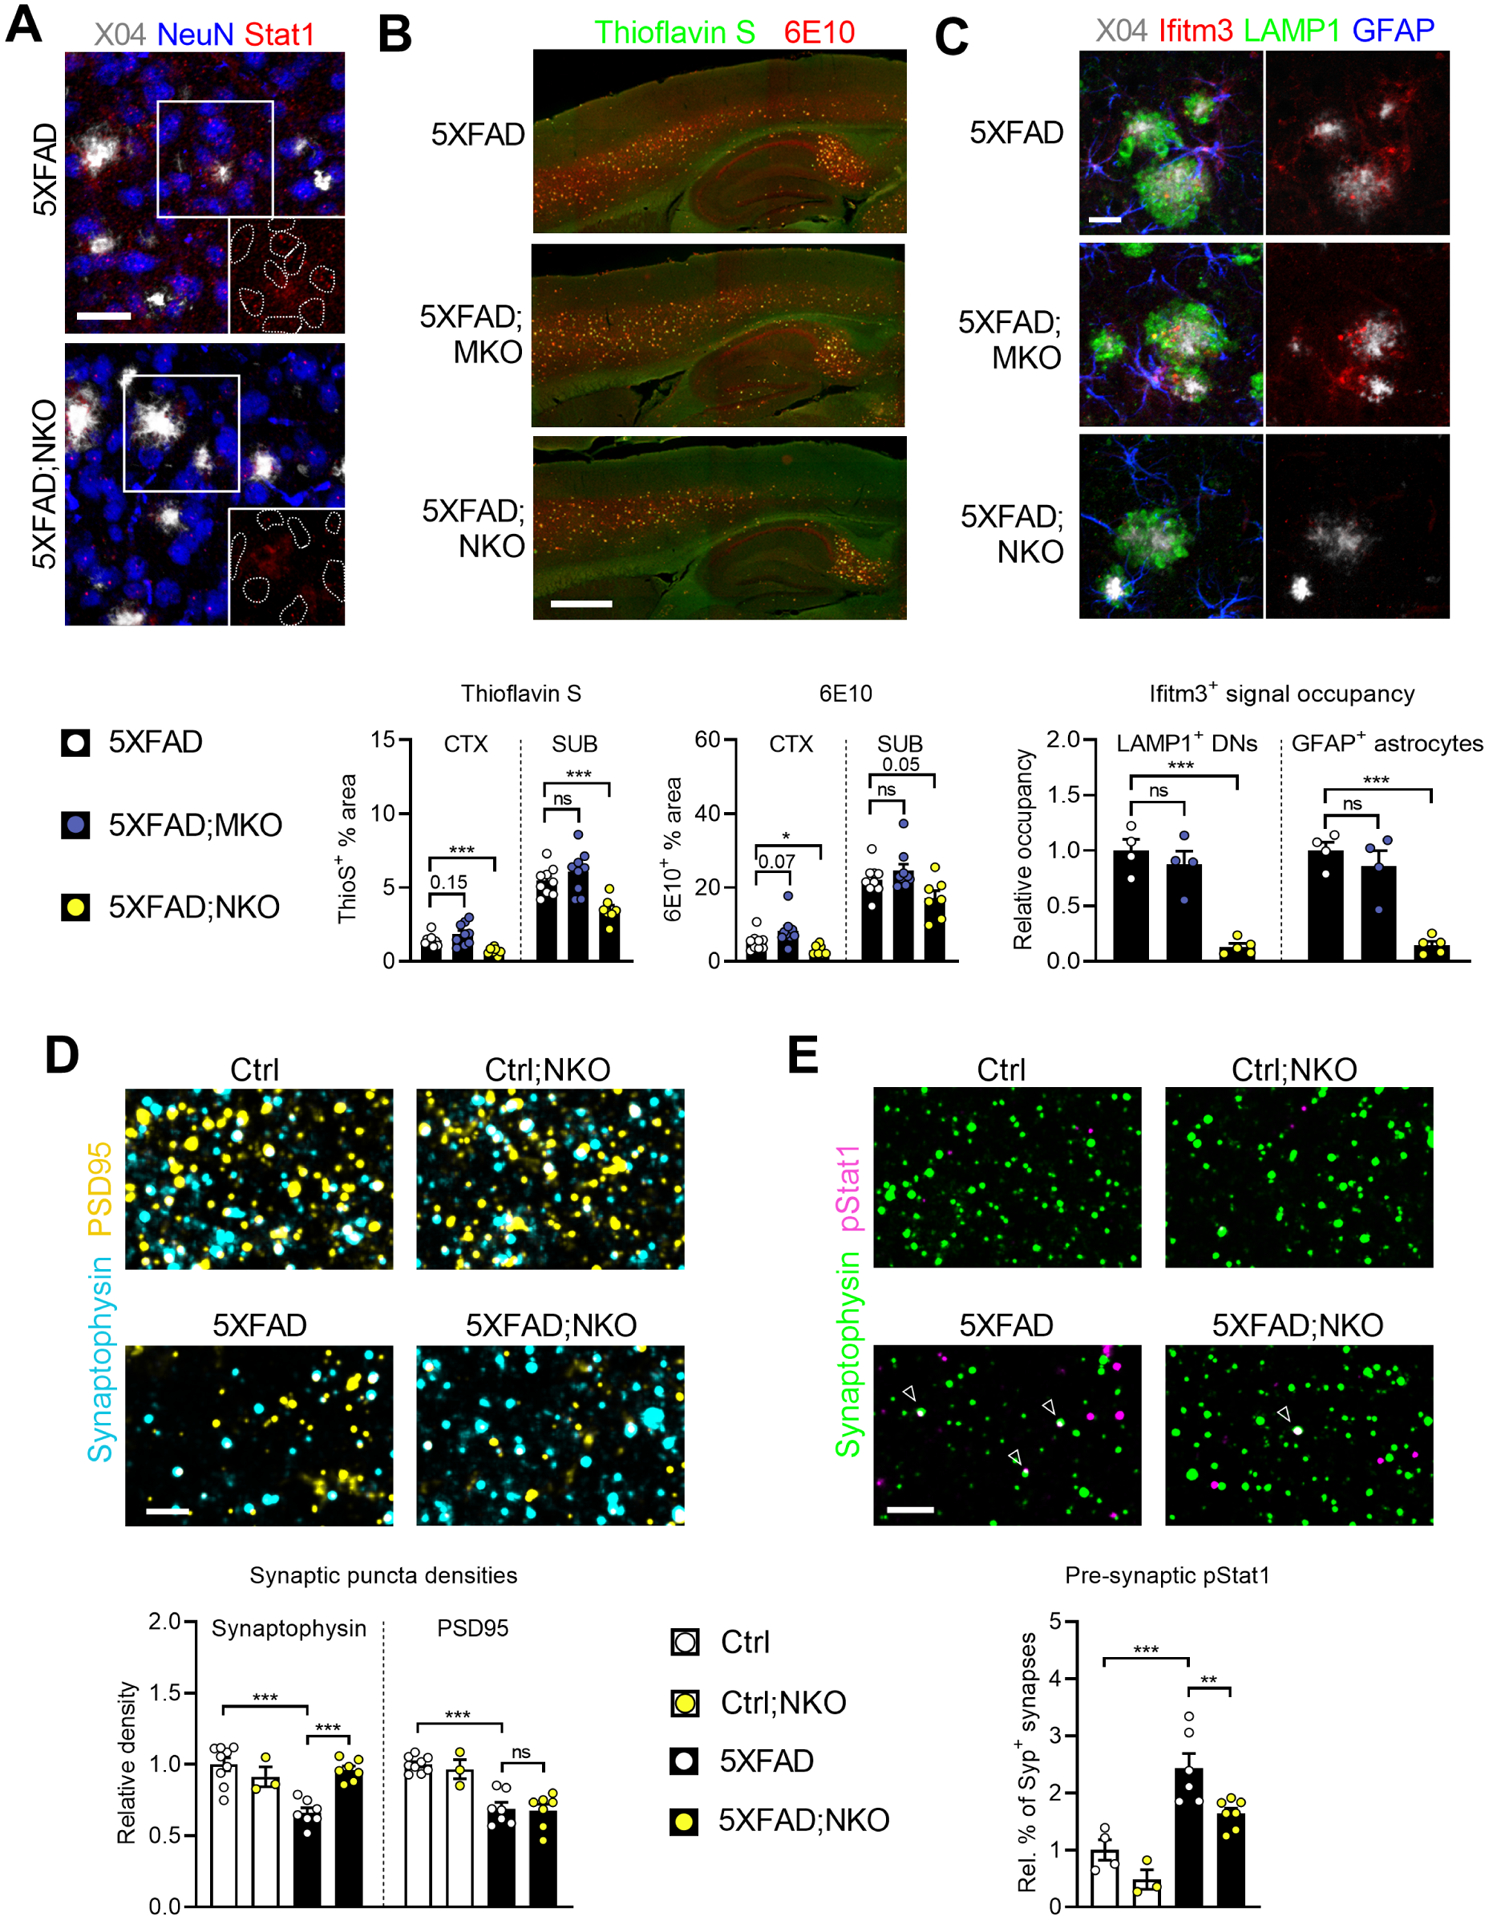
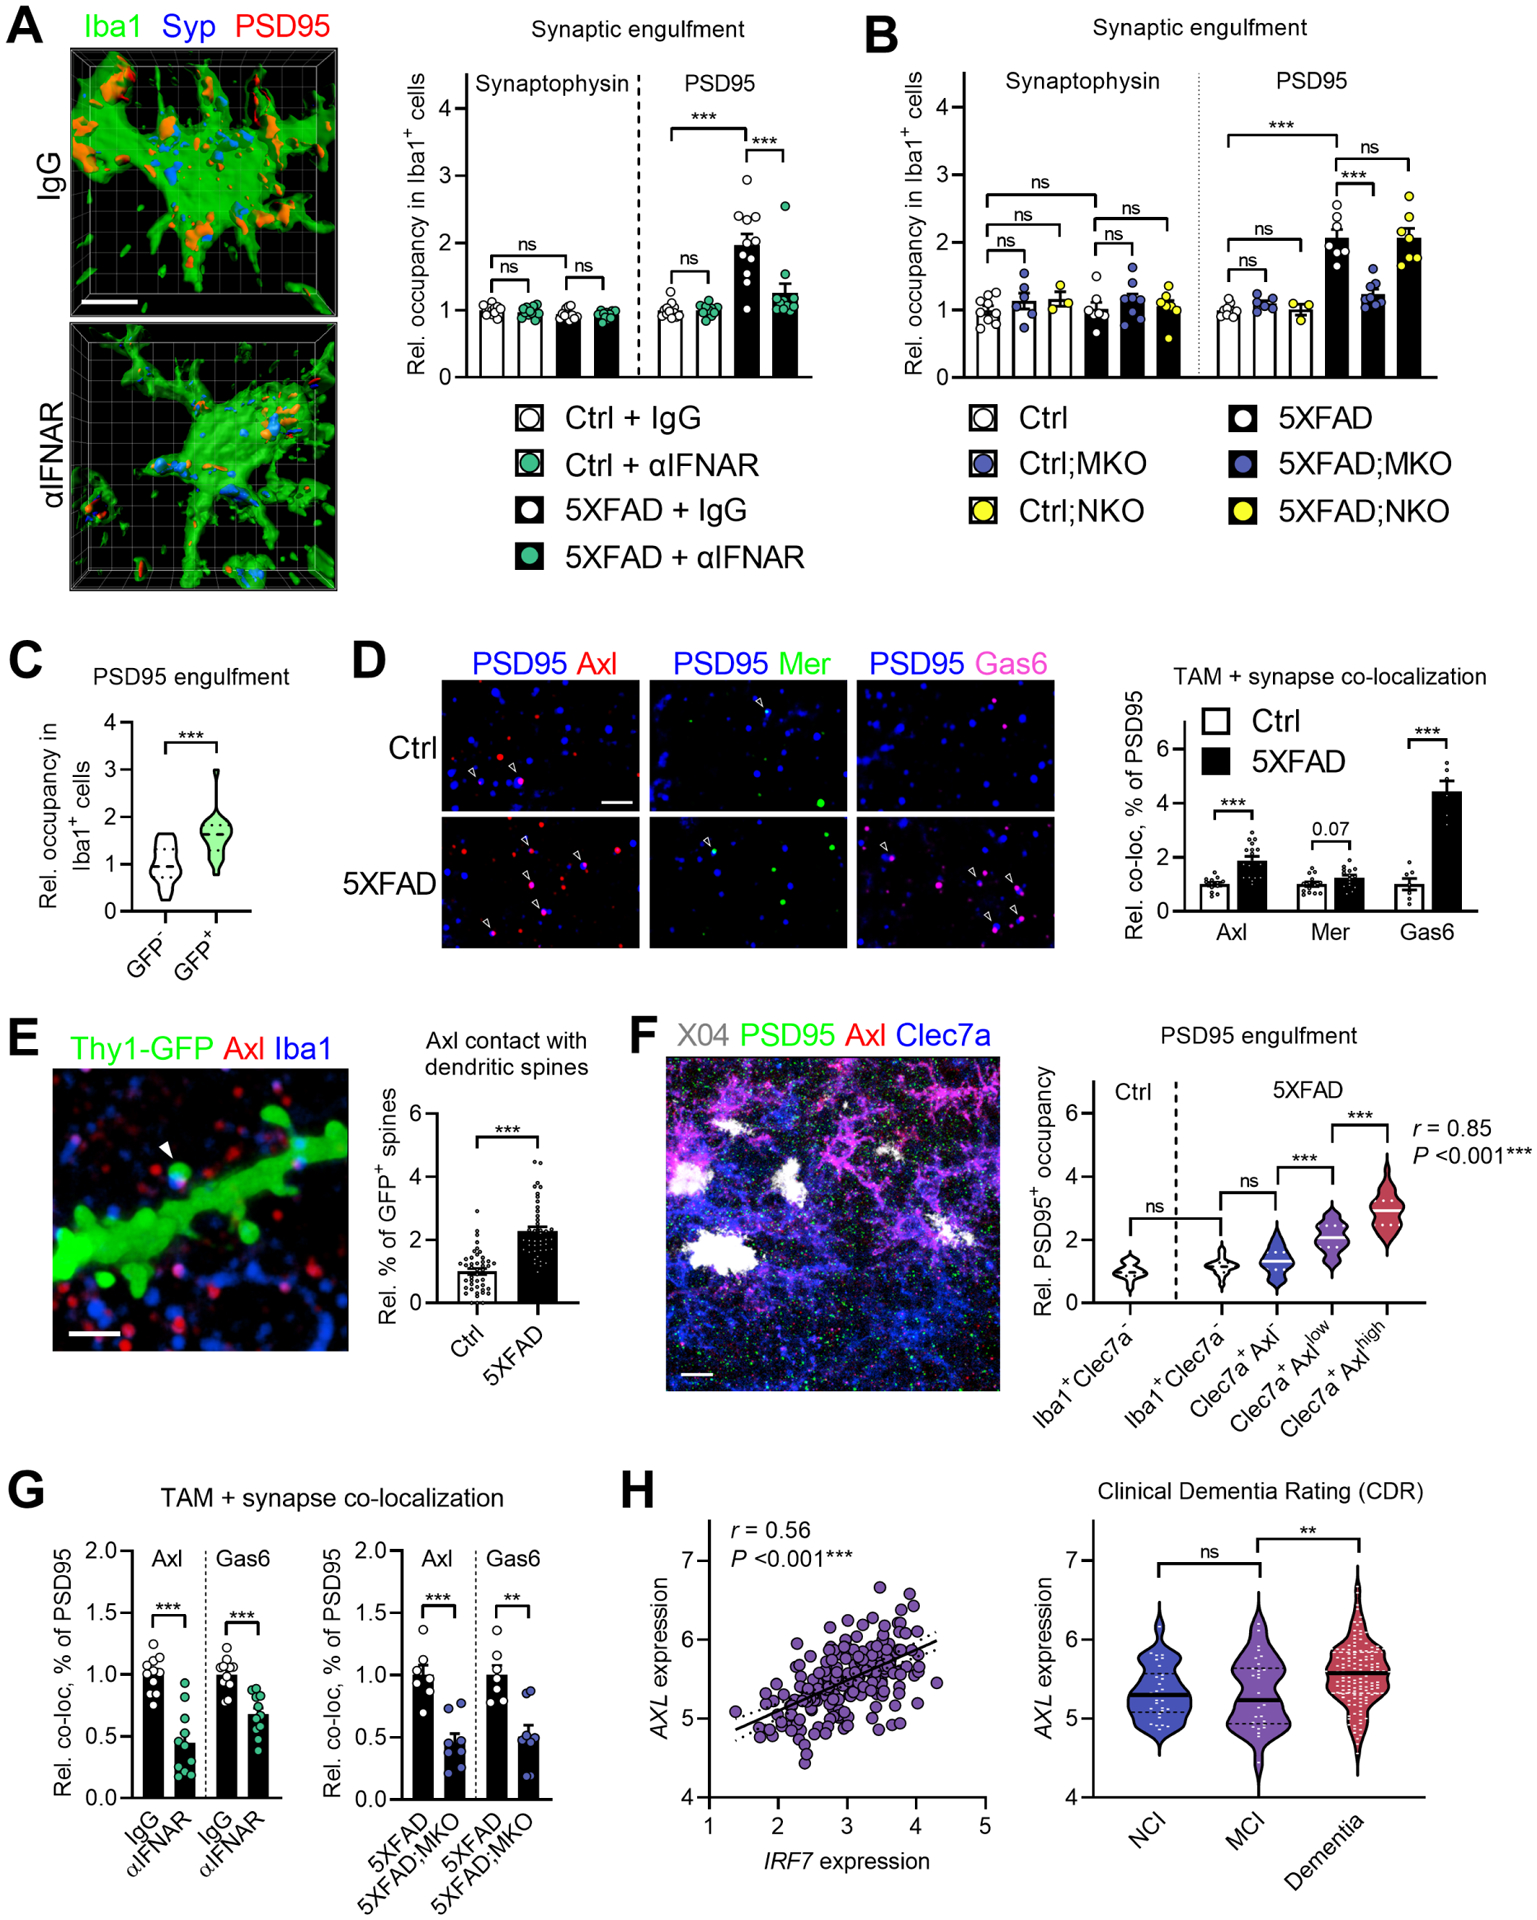
The principal signals that drive memory and cognitive impairment in Alzheimer's disease (AD) remain elusive. Here, we revealed brain-wide cellular reactions to type I interferon (IFN-I), an innate immune cytokine aberrantly elicited by amyloid β plaques, and examined their role in cognition and neuropathology relevant to AD in a murine amyloidosis model. Using a fate-mapping reporter system to track cellular responses to IFN-I, we detected robust, Aβ-pathology-dependent IFN-I activation in microglia and other cell types. Long-term blockade of IFN-I receptor (IFNAR) rescued both memory and synaptic deficits and resulted in reduced microgliosis, inflammation, and neuritic pathology. Microglia-specific Ifnar1 deletion attenuated the loss of post-synaptic terminals by selective engulfment, whereas neural Ifnar1 deletion restored pre-synaptic terminals and decreased plaque accumulation. Overall, IFN-I signaling represents a critical module within the neuroinflammatory network of AD and prompts concerted cellular states that are detrimental to memory and cognition.

Keywords: Alzheimer’s disease; interferon; memory impairment; microglia; neuroinflammation; synapse.


Conflict of interest statement

Declaration of interests W.C. received honorarium as an invited speaker in a symposium sponsored by AstroZeneca. H.Z. is a member of the Scientific Advisory Board of the Tau Consortium, Rainwater Charitable Foundation.

Figures

Figure 1:
Figure 1:. Progressive IFN-I signaling in 5XFAD brain
A, GFP expression in the brains of 5XFAD:MxG mice at different ages. Representative brain sections of 5XFAD and non-transgenic (nTg) control mice at 3 months (n = 3 mice), 5 months (n = 3 mice), and 11 months (n = 2 mice) of age. Scale bar, 250 μm. B, Confocal images of tissues from A co-labelled with Iba1, and quantification of % GFP+ microglia at 3 months (n = 75 cells from 3 mice), 5 months (n = 301 cells from 3 mice), and 11 months (n = 140 cells from 2 mice). Z-stack projections; scale bar, 20 μm. Single color images are shown in Figure S1G. C, High-magnification image of Stat1 expression within Iba1+ microglia surrounding an amyloid plaque (location marked by an asterisk), including GFP+ cells (solid white box) and GFP cells (dashed white box). Images at right: isolated Stat1 channels overlayed on DAPI+ nuclei (outlined) of GFP+ (top) and GFP (bottom) subsets of plaque-associated microglia. Z-stack projection; scale bars, 3.75 μm. Single color images are shown in Figure S1H. Quantification of relative nuclear Stat1 signal in individual GFP+ and GFP microglia in 5-month-old control (nTg;MxG) and 5XFAD;MxG mice (n = 138 total cells). Ordinary one-way ANOVA and Bonferroni’s multiple-comparisons tests were performed. ns, not significant; ***P < 0.001. D, Image of a 5-month-old 5XFAD;MxG brain (representative of n = 3 mice) highlighting Axl expression in GFP+ (solid arrowheads) and GFP (hollow arrowheads) of microglia. Scale bar, 20 μm. E, Images of 5-month-old 5XFAD;MxG brains showing GFP+ and GFP cells (left) and varying Axl expression (middle) among the plaque-associated Clec7a+ subset of microglia. Z-stack projections; scale bars, 15 μm. Quantification of microglial subtypes at 5 months using Iba1, Clec7a, and IFN-I-dependent GFP reporter expression (n = 408 cells from 3 mice). F, High-magnification single-plane confocal images of plaques from 5XFAD:MxG mice (left, n = 3 mice at 5 months of age) as in A-E, or Thy1-eGFP reporter mice (right, n = 3 mice at 6 months of age). Plaques are labelled by methoxy-X04 (gray) and outlined (dashed lines). Insets show single channels overlapping the plaque areas. Scale bars, 10 μm. All: Mice in all groups were analyzed in parallel as part of one experiment, and images are representative. See also Figure S1 for additional analysis relating to this figure.
Figure 2:
Figure 2:. Long-term IFN-I blockade rescues memory and synaptic deficits without altering plaque load
A, Experimental scheme of long-term IFN-I blockade in 5XFAD mice. Mice were randomized, treated and assayed for memory impairment in three separate mixed-gender cohorts. B, Results of behavioral assays. Ctrl + IgG, n = 13 mice; Ctrl + αIFNAR, n = 13 mice; 5XFAD + IgG, n = 12 mice; 5XFAD + αIFNAR, n = 12 mice. Mice were treated and analyzed in three separate cohorts. C, High-magnification images of pre- and post-synaptic markers (synaptophysin and PSD95, respectively) in subicula of treated Ctrl and 5XFAD mice. Z-stack projection of 2 μm thickness; scale bar, 3 μm. Quantification of relative synaptic densities, and the density of functional synapse pairs (⩽200nm between puncta). D, Images of cFos expression in dentate gyrus (DG) neurons of treated mice. Z-stack projections; scale bar, 150 μm. Quantification of relative density of cFos+ nuclei in the DG. E, Histological determination of plaque burden in treated mice using 6E10 antibody to mark Aβ fibrils, and thioflavin S (ThioS) to mark dense core plaques. Epifluorescence images; scale bar, 500 μm. Quantifications of plaque load for both markers in relevant brain regions. Single color images are shown in Figure S2G. All: Data represent means and s.e.m. For C, D, and E: Ctrl + IgG, n = 13 mice; Ctrl + αIFNAR, n = 11 mice; 5XFAD + IgG, n = 11 mice; 5XFAD + αIFNAR, n = 12 mice. Differences between groups were analyzed by ordinary one-way ANOVA and Bonferroni’s multiple-comparisons tests (B, C, and D) or by two-tailed t-tests (E). ns, not significant; **P <0.01; ***P < 0.001. For histology, mice from three separate treatment cohorts were combined and analyzed in parallel as part of one experiment, and images are representative. See also Figure S2 for additional analysis relating to this figure.
Figure 3:
Figure 3:. IFN-I blockade ameliorates microgliosis, inflammation, dystrophic axons, and neuritic tau
A, Representative images of Stat1 signals in different cell types of 5XFAD mice treated with IgG (n = 11 mice) or αIFNAR (n = 12 mice). Insets: isolated Stat1 channels from boxed areas showing microglia (solid boxes) and neuronal nuclei (dashed boxes) in each condition. Z-stack projections; scale bar, 30 μm. B, Iba1 staining in the cortex and hippocampus of treated 5XFAD mice. Epifluorescence images; scale bar, 500 μm. Quantifications of % Iba1 area. C, Images of plaque-associated microglia in treated 5XFAD mice expressing Axl and Clec7a (isolated in insets). Z-stack projections; scale bar, 30 μm. Quantification of microglial occupancy of both markers, and quantification of overall subicular microglia numbers by PU.1+ nuclei density. D, Gene expression alterations with αIFNAR treatment as measured by Nanostring analysis on bulk hippocampal tissues. Ctrl + IgG, n = 9 mice; Ctrl + αIFNAR, n = 8 mice; 5XFAD + IgG, n = 8 mice; 5XFAD + αIFNAR, n = 10 mice. E, Images and quantification of LAMP1+ dystrophic neurites (DNs) and phospho-neurofilament+ (pNF+) dystrophic axons (DAs) surrounding X04+ amyloid plaques in subicula of treated mice. Z-stack projections; scale bar, 20 μm. Single color images are shown in Figure S3F. F, Image of endogenous tau foci inside LAMP1+ DNs in the subiculum of a 5XFAD animal (insets: isolated channels for CP13+ p-tau and total tau) and quantification of CP13+ occupancy in DNs after treatment with IgG or αIFNAR. Z-stack projection; scale bar, 30 μm. 5XFAD + IgG, n = 11 mice; 5XFAD + αIFNAR, n = 11 mice. All: Data represent means and s.e.m. For B, C, and E: Ctrl + IgG, n = 13 mice; Ctrl + αIFNAR, n = 11 mice; 5XFAD + IgG, n = 11 mice; 5XFAD + αIFNAR, n = 12 mice. Differences between groups were analyzed by ordinary one-way ANOVA and Bonferroni’s multiple-comparisons tests (B, C, and D) or by two-tailed t-tests (E and F). ns, not significant; *P < 0.05; **P <0.01; ***P < 0.001. Mice from three separate treatment cohorts were combined and analyzed in parallel as part of one experiment, and images are representative. See also Figure S3 for additional analysis relating to this figure.
Figure 4:
Figure 4:. Selective microglial Ifnar1 ablation decreases microglial reactivity and rescues post-synaptic loss
A, Representative images of Stat1 expression in subicula of 5XFAD;MKO mice (n = 8 mice) compared to Ifnar1-sufficient 5XFAD mice (n = 7 mice). Insets show isolated Stat1 channel of boxed areas. Z-stack projections; scale bar, 30 μm. B, Quantifications of total % Iba1+ area and activation marker occupancy by region. For Iba1, Axl, and Clec7a: Ctrl, n = 9 mice; Ctrl;MKO, n = 6 mice; 5XFAD, n = 7 mice; 5XFAD;MKO, n = 8 mice. For Cd68: n = 4 mice per genotype. C, Relative expression of ISGs and microglial activation markers analyzed by qPCR on bulk hippocampal tissues. Ctrl, n = 13 mice; Ctrl;MKO, n = 4 mice; 5XFAD, n = 12 mice; 5XFAD;MKO, n = 4 mice. D, High-magnification confocal images of pre- and post-synaptic puncta (synaptophysin and PSD95, respectively) in subiculum. Z-stack projections of 2 μm thickness; scale bar, 3 μm. Quantification of relative synaptic puncta densities. Ctrl, n = 9 mice; Ctrl;MKO, n = 6 mice; 5XFAD, n = 7 mice; 5XFAD;MKO, n = 8 mice. All: Data represent means and s.e.m. Differences between groups were analyzed by ordinary one-way ANOVA and Bonferroni’s multiple-comparisons tests. ns, not significant; *P < 0.05; **P <0.01; ***P < 0.001. Brain tissues were collected over time, combined and analyzed in parallel as part of one experiment, and images are representative. See also Figure S4 for additional analysis relating to this figure.
Figure 5:
Figure 5:. Selective neural Ifnar1 ablation decreases plaque load and rescues pre-synaptic loss
A, Representative images of neuronal Stat1 expression in subicula of 5XFAD;NKO mice (n = 7 mice) compared to Ifnar1-sufficient 5XFAD mice (n = 7 mice). Insets show isolated Stat1 channels in outlined NeuN+ neuronal nuclei. Z-stack projections; scale bar, 30 μm. B, Histological determination of plaque burden. Epifluorescence images; scale bar, 500 μm. Quantification (below) of % area of plaque markers by brain region. 5XFAD, n = 9 mice; 5XFAD;MKO, n= 9 mice; 5XFAD;NKO, n= 7 mice. C, Images (top) and quantification (bottom) of Ifitm3 signals localized inside LAMP1+ DNs and GFAP+ astrocytes in subiculum. Z-stack projections; scale bar, 20 μm. 5XFAD, n = 4 mice; 5XFAD;MKO, n = 4 mice; 5XFAD;NKO, n = 5 mice. D, High-magnification confocal images of pre- and post-synaptic puncta (synaptophysin and PSD95, respectively) in subiculum. Z-stack projections of 2 μm thickness; scale bar, 3 μm. Ctrl, n= 9 mice; Ctrl;NKO, n= 3 mice; 5XFAD, n= 7 mice; 5XFAD;NKO, n= 7 mice. E, High-magnification confocal images and quantification (below) of pStat1+ signals co-localized with Syp+ pre-synaptic boutons in subiculum. Z-stack projections of 2 μm thickness; scale bar, 3 μm. Ctrl, n= 4 mice; Ctrl;NKO, n= 3 mice; 5XFAD, n= 6 mice; 5XFAD;NKO, n= 7 mice. All: Data represent means and s.e.m. Differences between groups were analyzed by ordinary one-way ANOVA and Bonferroni’s multiple-comparisons tests (D and E), or by two-tailed t-tests (B and C). ns, not significant; *P < 0.05; **P <0.01; ***P < 0.001. Brain tissues were collected over time, combined and analyzed in parallel as part of one experiment, and images are representative. See also Figure S5 for additional analysis relating to this figure.
Figure 6:
Figure 6:. Post-synapses are preferentially engulfed by IFN-I-stimulated Axl+ microglia
A, 3D renderings of microglia engulfing synaptic markers in subicula of 5XFAD mice subjected to IFN-I blockade from Figure 2. Scale bar, 5 μm. Quantification of microglial engulfment of these markers. Ctrl + IgG, n = 13 mice; Ctrl + αIFNAR, n = 11 mice; 5XFAD + IgG, n = 11 mice; 5XFAD + αIFNAR, n = 11 mice. B, Quantification of microglial engulfment of synaptic markers in subicula of mice with conditional Ifnar1 deletion. Ctrl, n = 9 mice; Ctrl;MKO, n = 6 mice; Ctrl;NKO, n = 3 mice; 5XFAD, n = 7 mice; 5XFAD;MKO, n = 8 mice; and 5XFAD;NKO, n = 7 mice. C, Quantification of relative uptake of PSD95+ synaptic puncta by GFP (n = 19 cells) and GFP+ microglia (n = 21 cells) from 5-month-old 5XFAD;MxG mice (n = 3 mice). D, High-magnification images of PSD95+ synaptic puncta in proximity (⩽200 nm; arrows) to Axl, Mer, and Gas6 in Ctrl and 5XFAD brains. Scale bar, 2 μm. Quantification of co-localization, as relative percent of PSD95+ puncta, of TAM molecules with PSD95 (Axl + PSD95: n = 13 Ctrl images, n = 17 5XFAD images; Mer + PSD95: n = 14 Ctrl images, n = 15 5XFAD images; Gas6 + PSD95: n = 7 Ctrl images, n = 6 5XFAD images). Data is representative of multiple animals in two independent experiments. E, High-magnification confocal image of Axl+ microglial processes contacting dendritic spines (arrow) in a 5XFAD;Thy1-eGFP mouse at 5 months. Scale bar, 2 μm. Quantification of relative frequency of observed contacts between control (n = 42 dendrites >10 μm long from n = 8 mice) and 5XFAD mice (n = 44 dendrites >10 μm long from n = 8 mice). F, (left) Confocal image of Clec7a+ microglia with varying degrees of Axl expression in relation to PSD95 in a 5-month-old 5XFAD animal. Scale bar, 20 μm. (right) Histological analysis of single microglia in both control and 5XFAD brains stratified by Clec7a and Axl expression. Ctrl Iba1+Clec7a, n = 17 cells; 5XFAD Iba1+Clec7a, n = 19 cells; 5XFAD Clec7a+Axl, n = 37 cells; 5XFAD Clec7a+Axllow, n = 35 cells; 5XFAD Clec7a+Axlhigh, n = 32 cells; all cells combined from n = 2 Ctrl mice and n = 3 5XFAD mice at 5 months. Pearson r was calculated by correlation analysis of Axl expression and PSD95+ uptake in all Clec7a+ cells. G, Quantified co-localization of Axl and Gas6 with PSD95, as relative percent of PSD95, in 5XFAD mice treated with IgG (n = 11 mice) or αIFNAR (n = 11 mice), and in microglial Ifnar1 conditional deletion lines (5XFAD, n = 7 mice; 5XFAD;MKO, n = 8 mice). H, AXL expression in human AD correlated with IRF7 expression (left), and plotted by Clinical Dementia Rating (CDR) classification (right). Both plots: n = 195 total subjects. For IRF7: Pearson correlation (r) was calculated, and simple linear regression line (solid) with 95% CI intervals (dashed) were plotted. For CDR: ‘NCI’=no cognitive impairment, CDR=0, n = 30 subjects; ‘MCI’=mild cognitive impairment, CDR=0.5, n = 30 subjects; ‘Dementia’, CDR>0.5, n = 135 subjects. All: Data represent means and s.e.m. (A, B, D, E, and G) or presented as violin plots with medians (dashed lines) and quartiles (dotted lines) (C, F, and H). Differences between groups were analyzed by ordinary one-way ANOVA and Bonferroni’s multiple-comparisons tests (A, B, F, and H), or by two-tailed t-tests (C-E, and G). ns, not significant; **P <0.01; ***P < 0.001. For mouse data, brain tissues were collected over time, combined and analyzed in parallel as part of one experiment, and images are representative. See also Figure S6 for additional analysis relating to this figure.

Comment in

References

    1. Altman JB, Taft J, Wedeking T, Gruber CN, Holtmannspotter M, Piehler J & Bogunovic D 2020. Type I IFN is siloed in endosomes. Proc Natl Acad Sci U S A, 117, 17510–17512. - PMC - PubMed
    1. Asnis GM & De La Garza R, 2nd 2005. Interferon-induced depression: strategies in treatment. Prog Neuropsychopharmacol Biol Psychiatry, 29, 808–18. - PubMed
    1. Baik SH, Kang S, Son SM & Mook-Jung I 2016. Microglia contributes to plaque growth by cell death due to uptake of amyloid beta in the brain of Alzheimer’s disease mouse model. Glia, 64, 2274–2290. - PubMed
    1. Breuer K, Foroushani AK, Laird MR, Chen C, Sribnaia A, Lo R, Winsor GL, Hancock RE, Brinkman FS & Lynn DJ 2013. InnateDB: systems biology of innate immunity and beyond--recent updates and continuing curation. Nucleic Acids Res, 41, D1228–33. - PMC - PubMed
    1. Cheadle L, Rivera SA, Phelps JS, Ennis KA, Stevens B, Burkly LC, Lee WA & Greenberg ME 2020. Sensory Experience Engages Microglia to Shape Neural Connectivity through a Non-Phagocytic Mechanism. Neuron, 108, 451–468 e9. - PMC - PubMed

Publication types

Substances