. 2022 Apr 19;39(3):110695.
doi: 10.1016/j.celrep.2022.110695.

Oncogenic Vav1-Myo1f induces therapeutically targetable macrophage-rich tumor microenvironment in peripheral T cell lymphoma

Affiliations

Oncogenic Vav1-Myo1f induces therapeutically targetable macrophage-rich tumor microenvironment in peripheral T cell lymphoma

Jose R Cortes et al. Cell Rep. .

Abstract

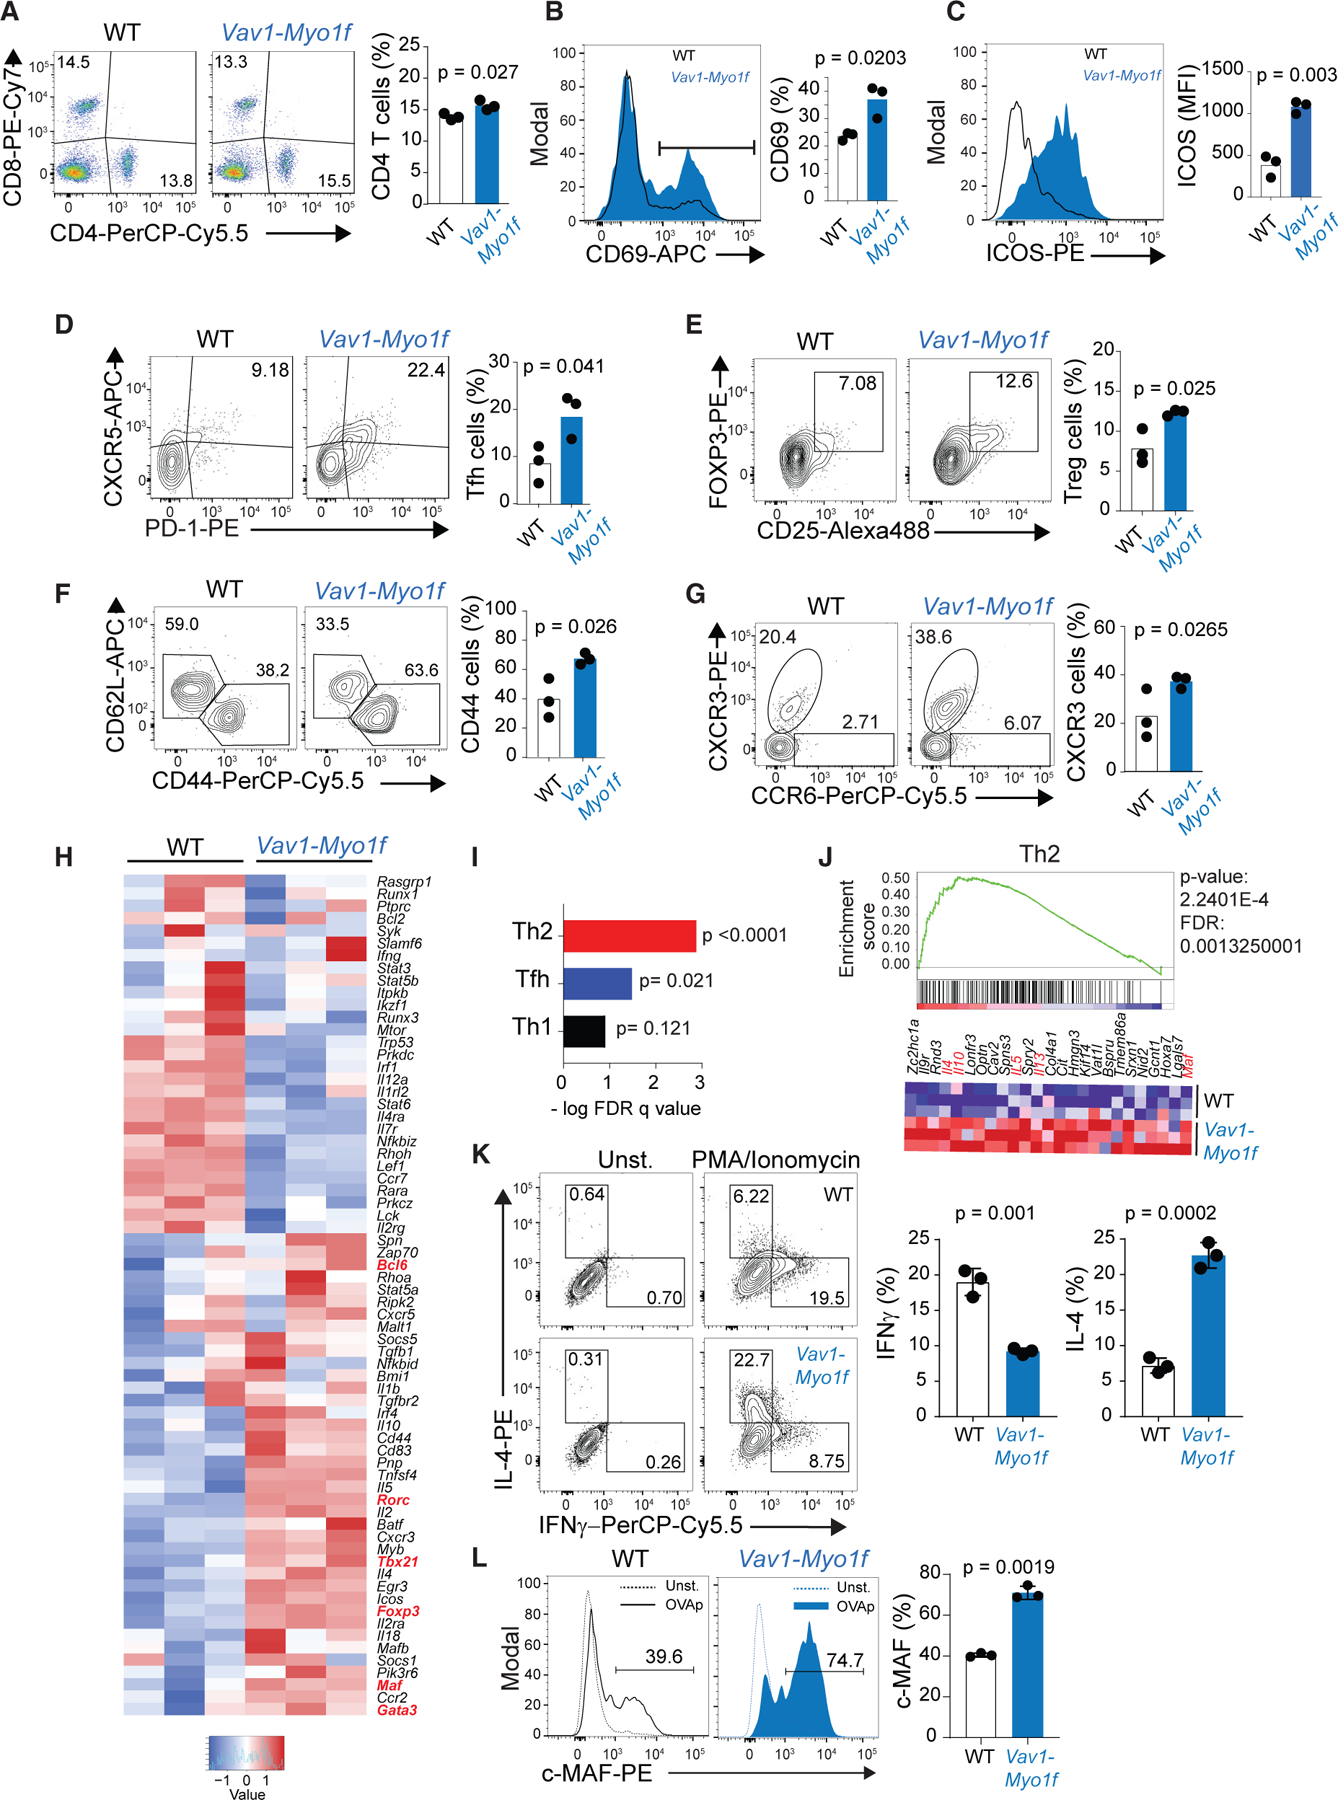
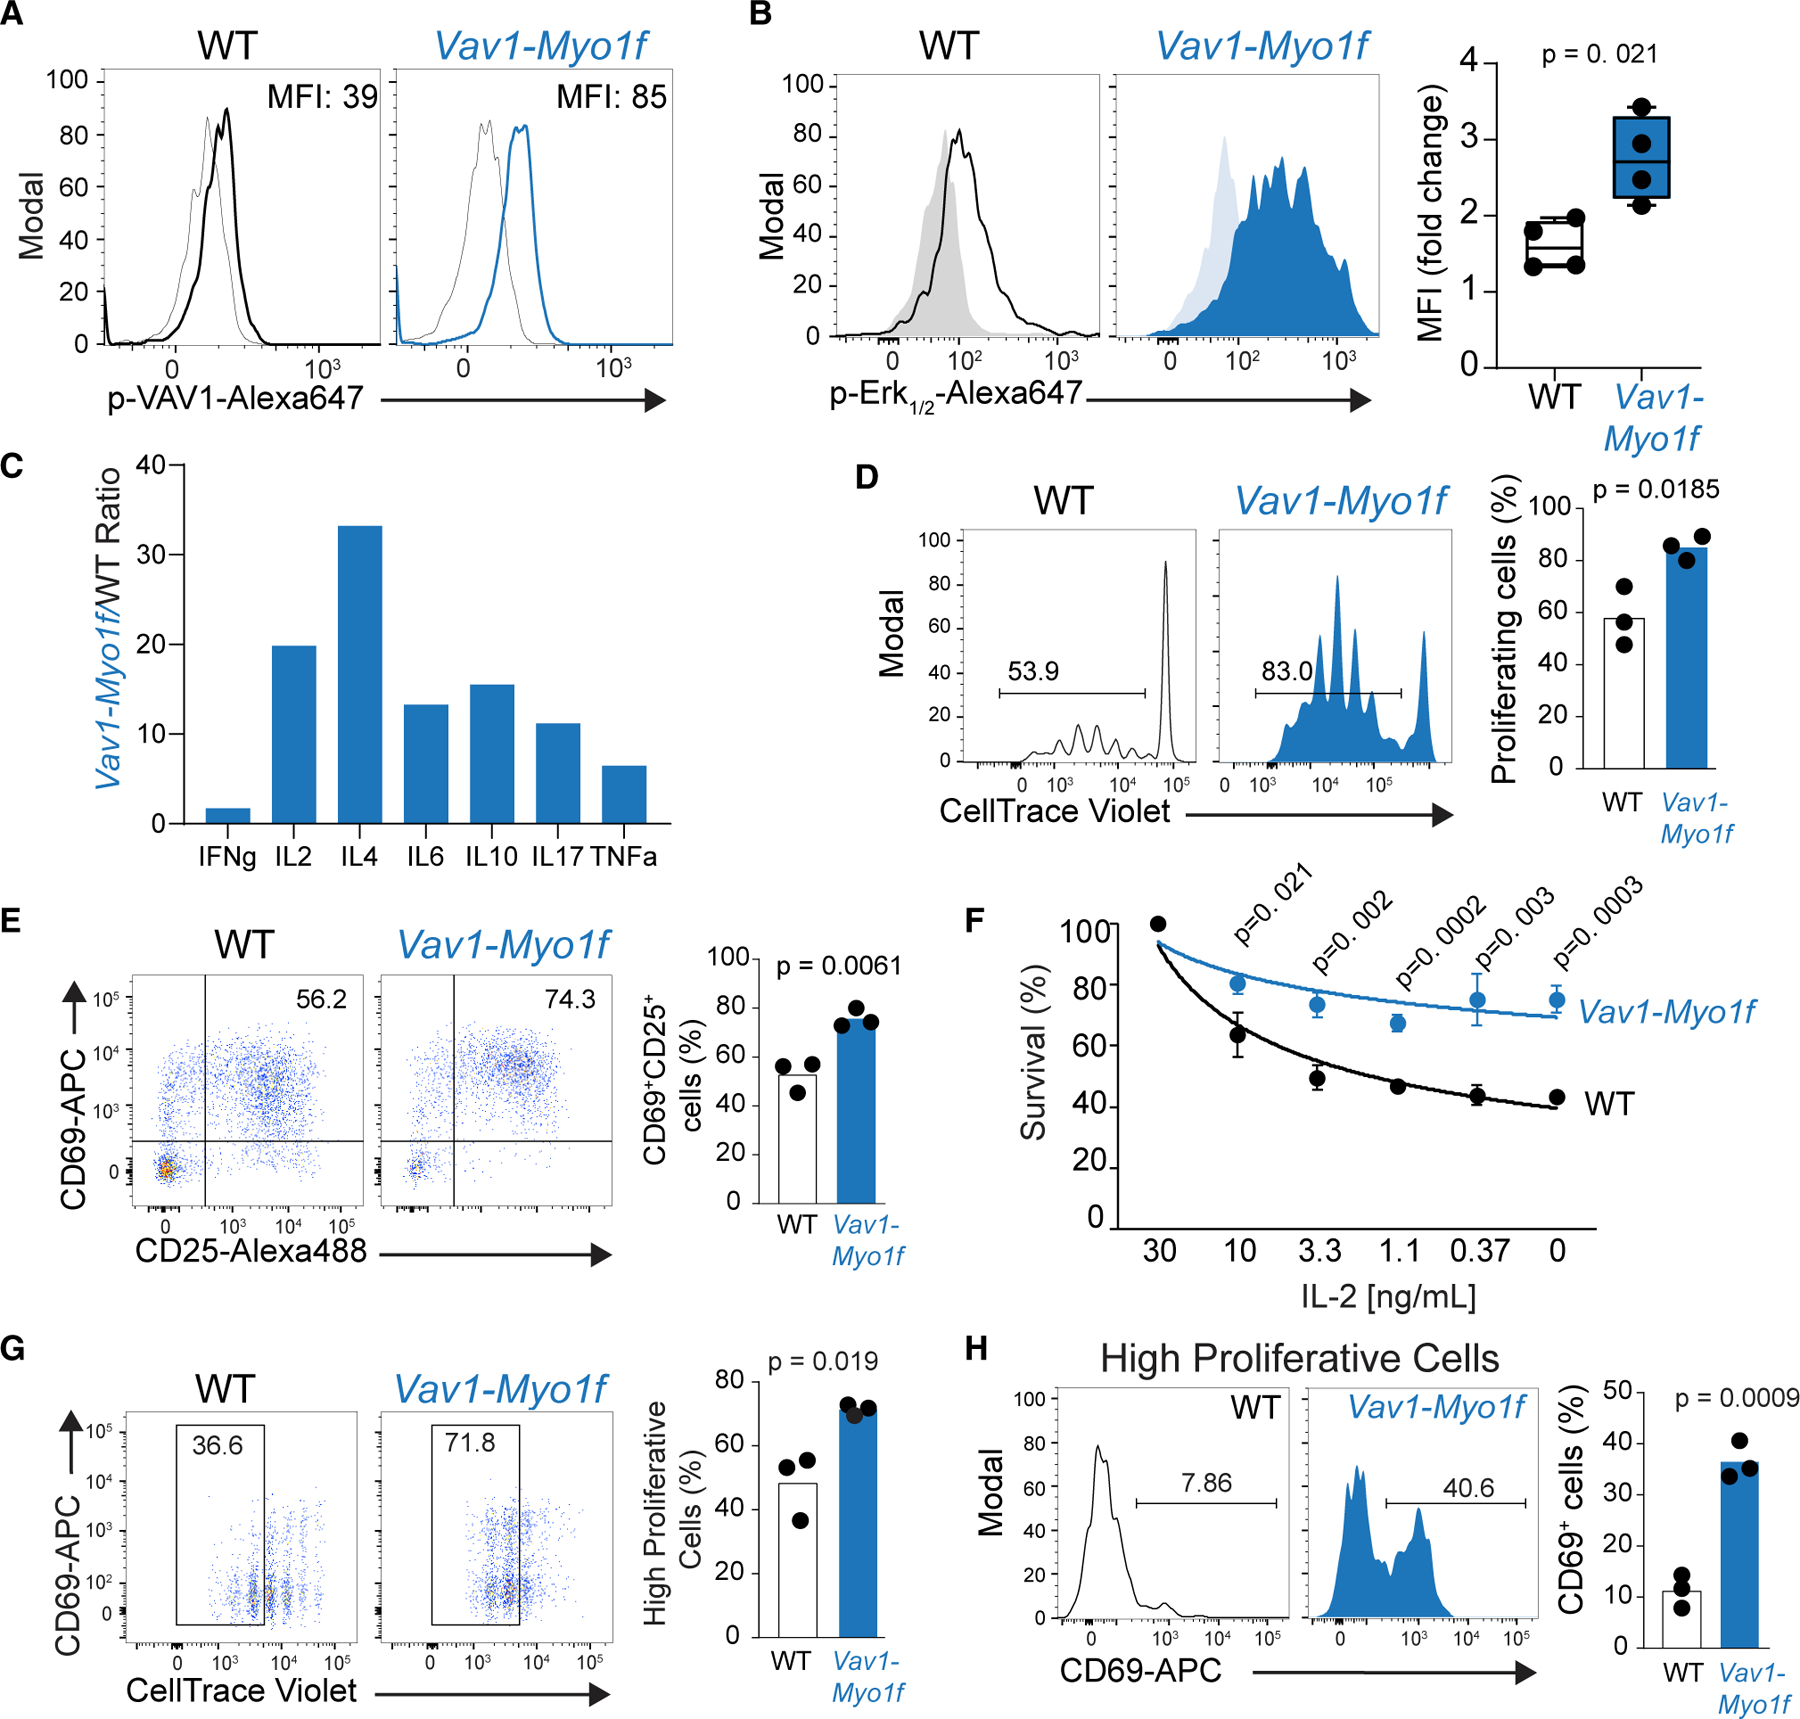
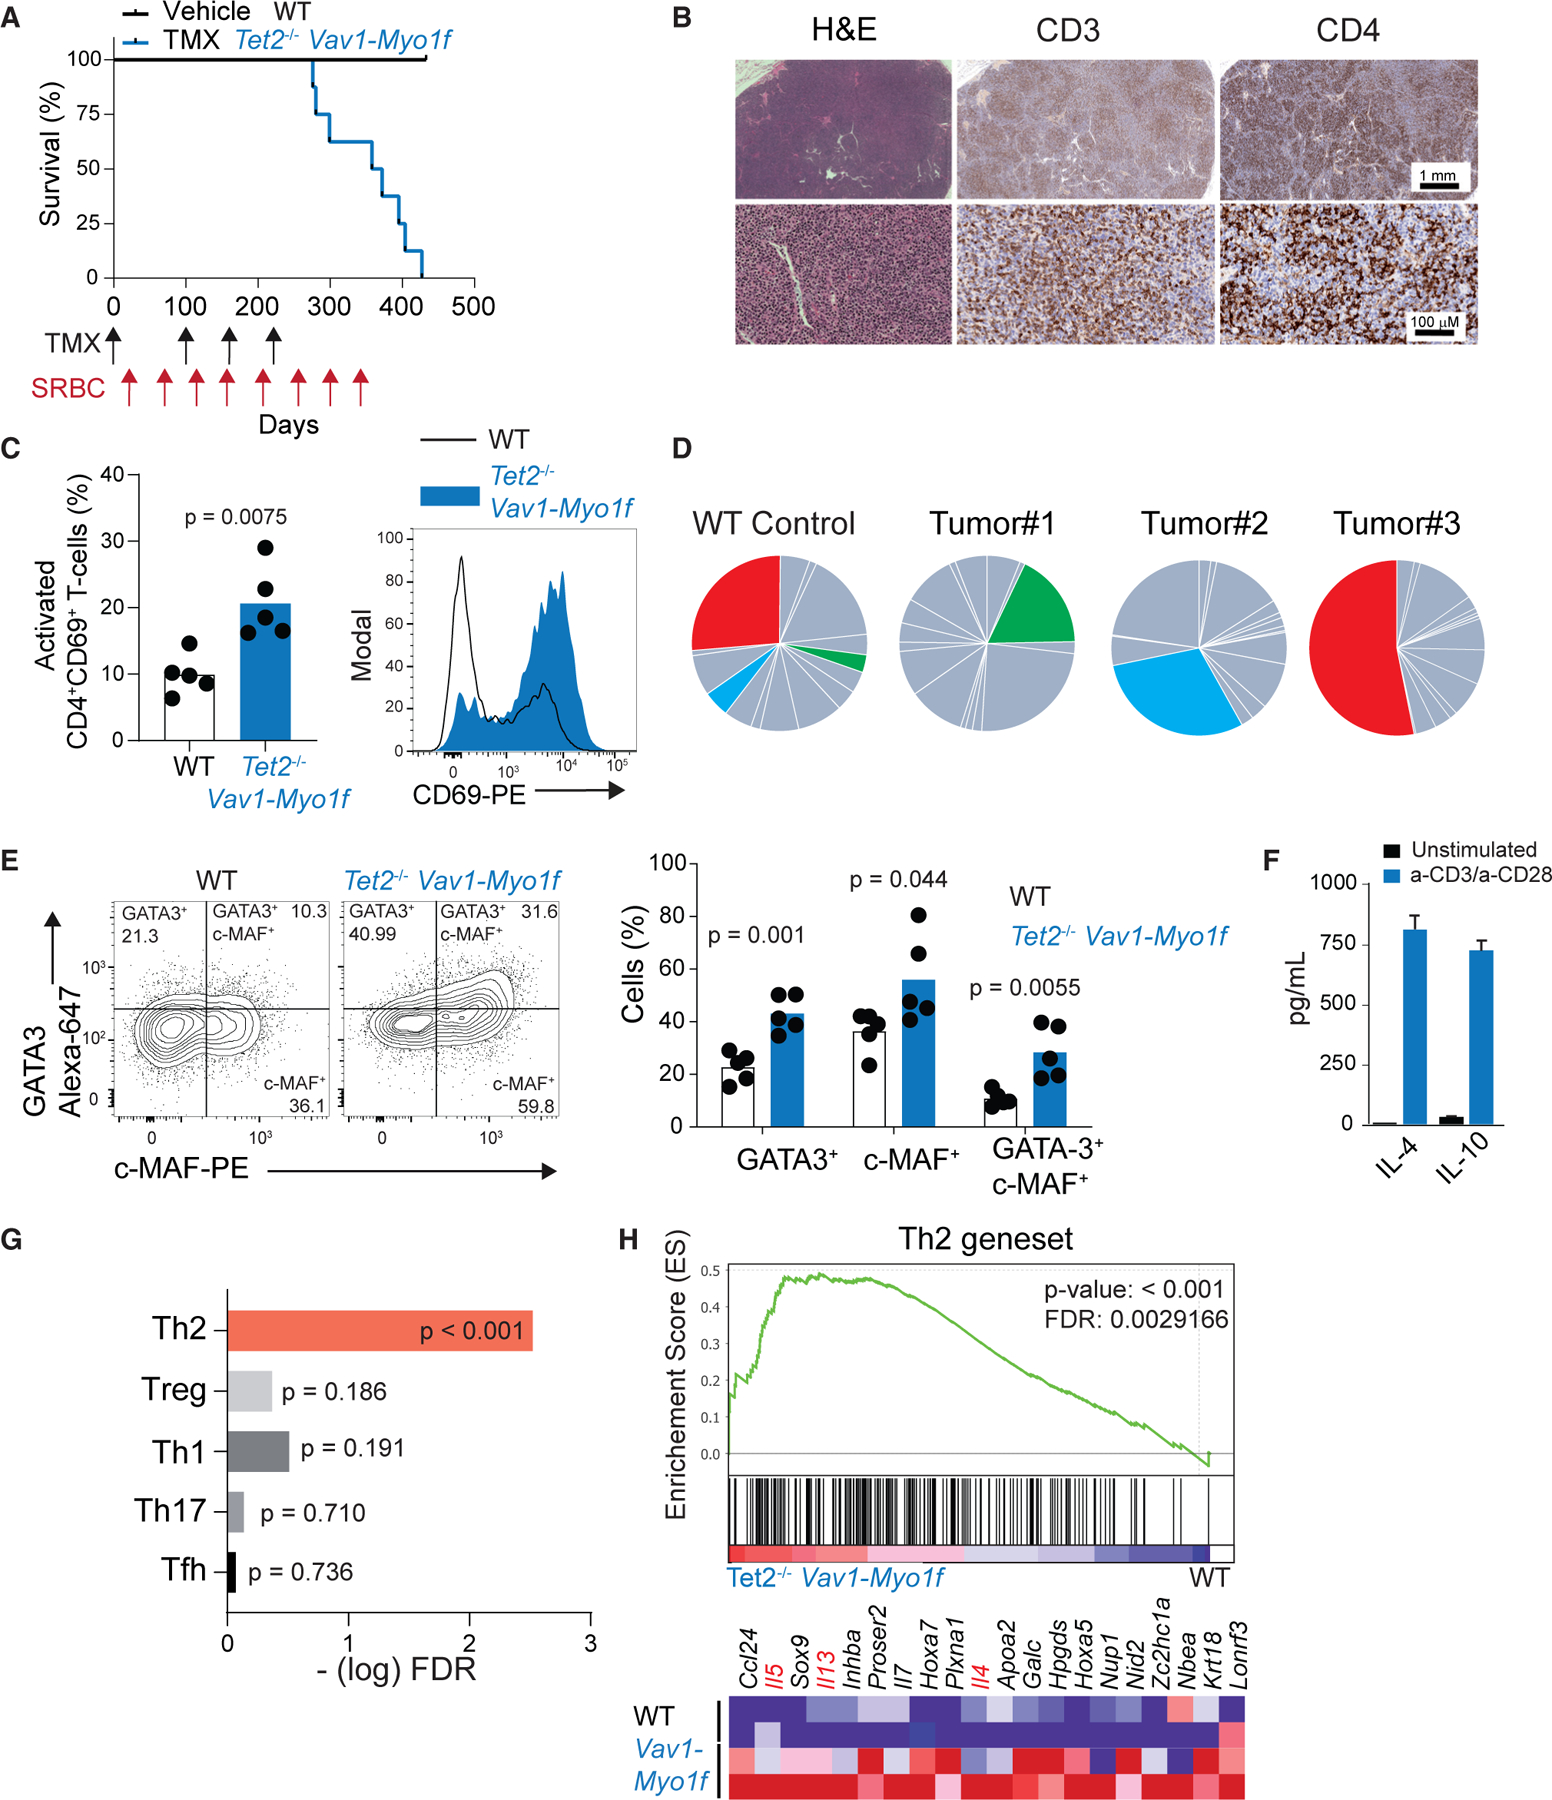
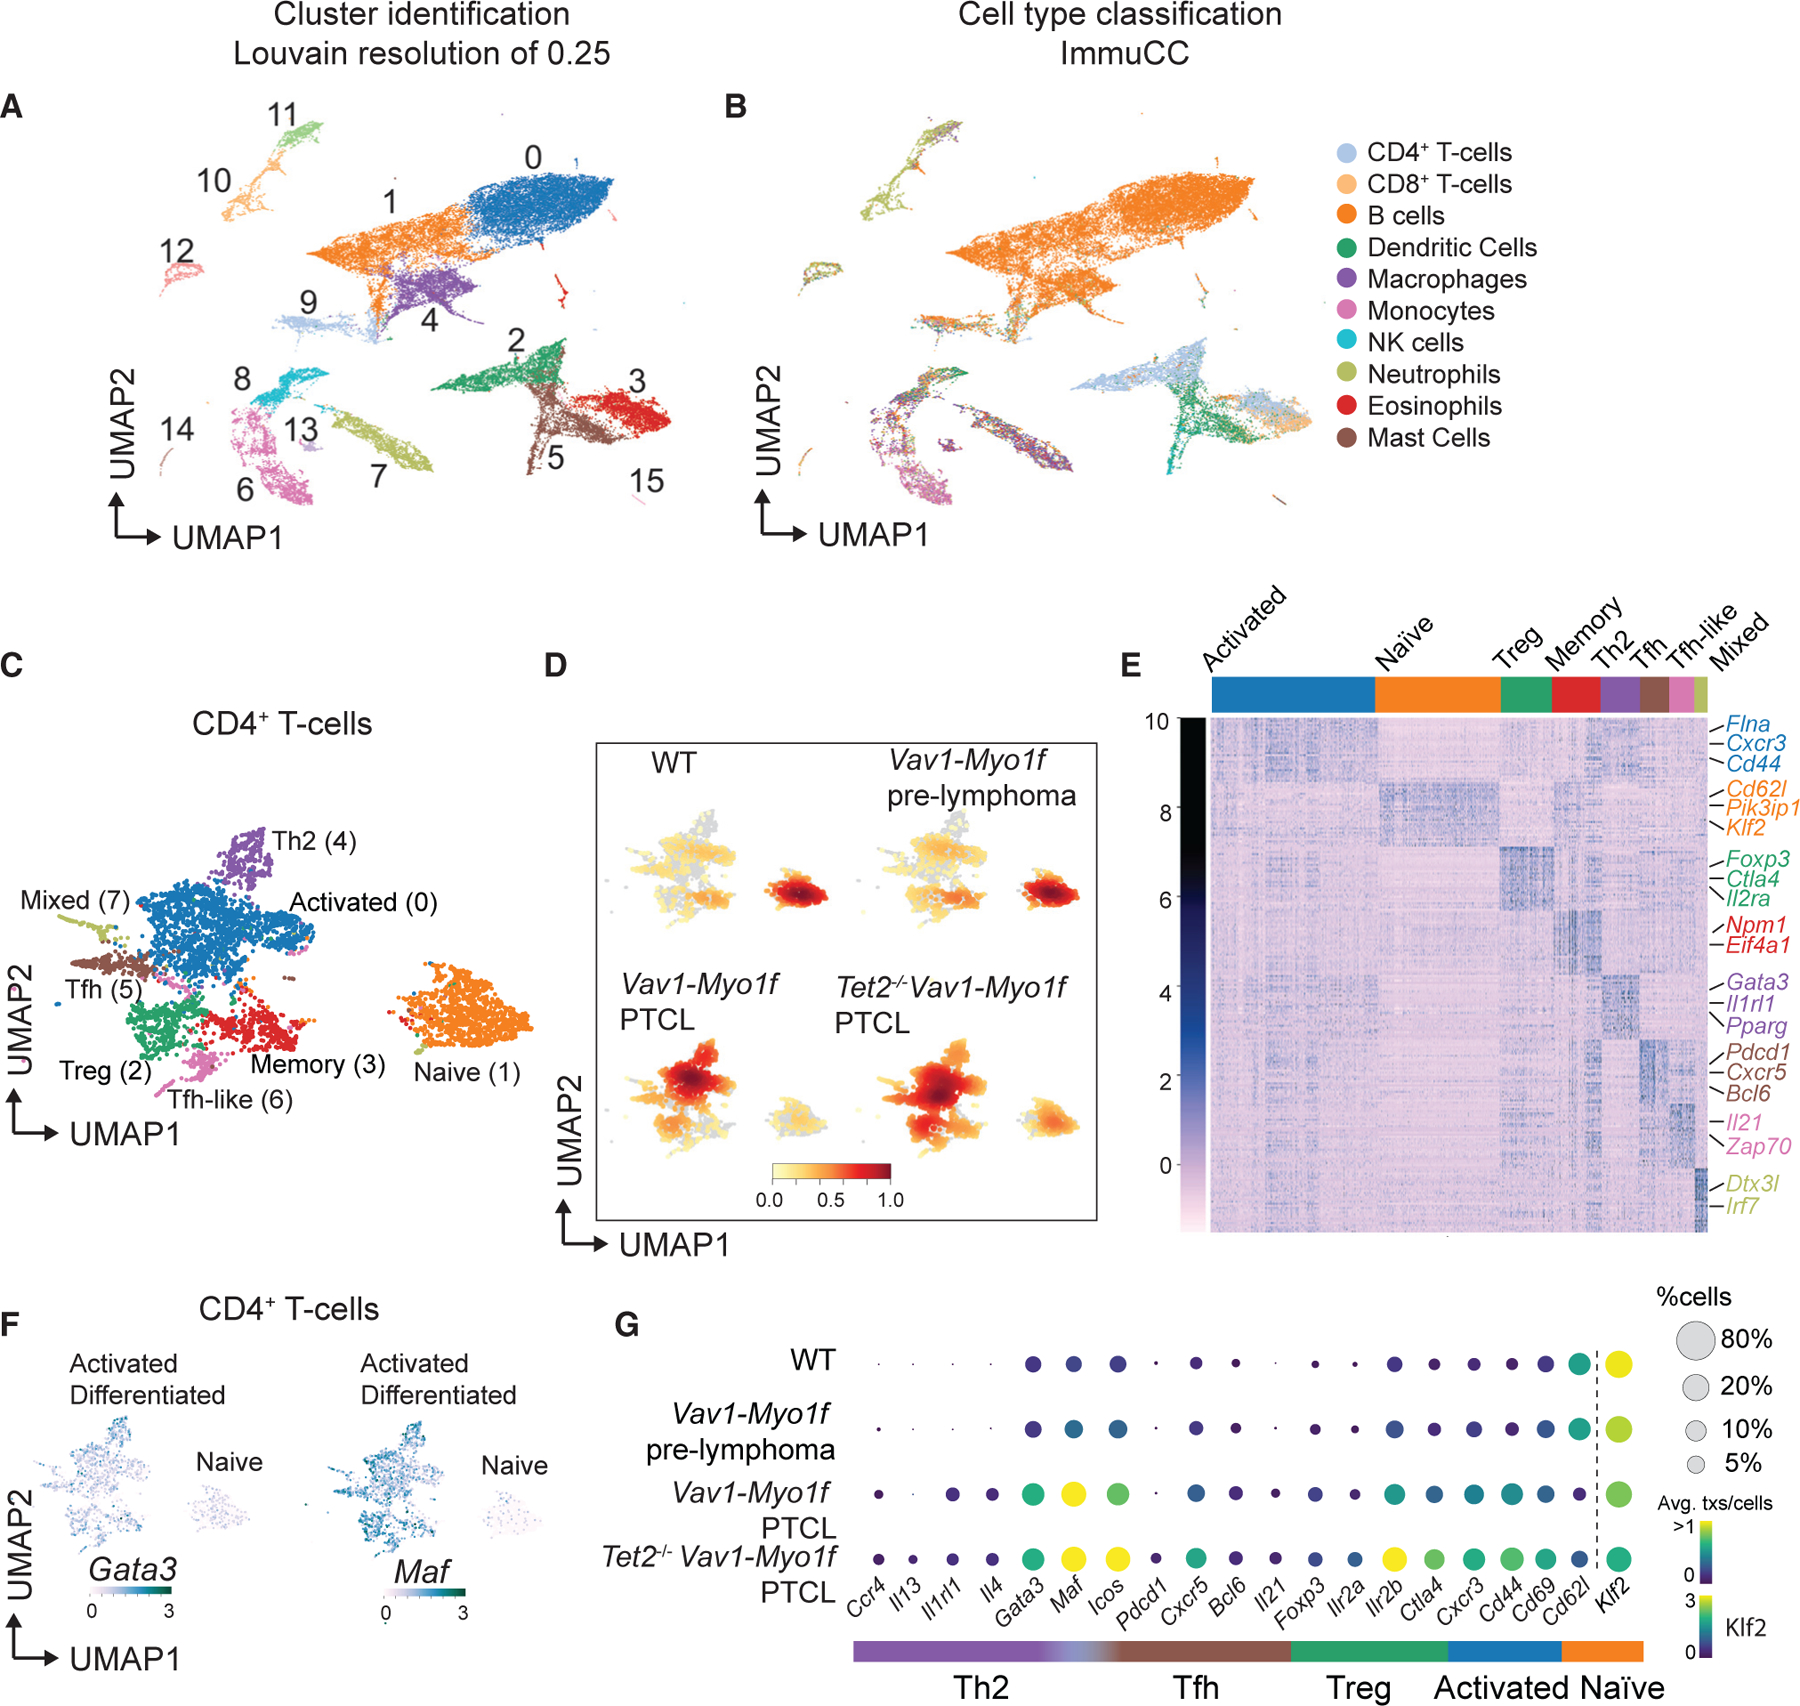
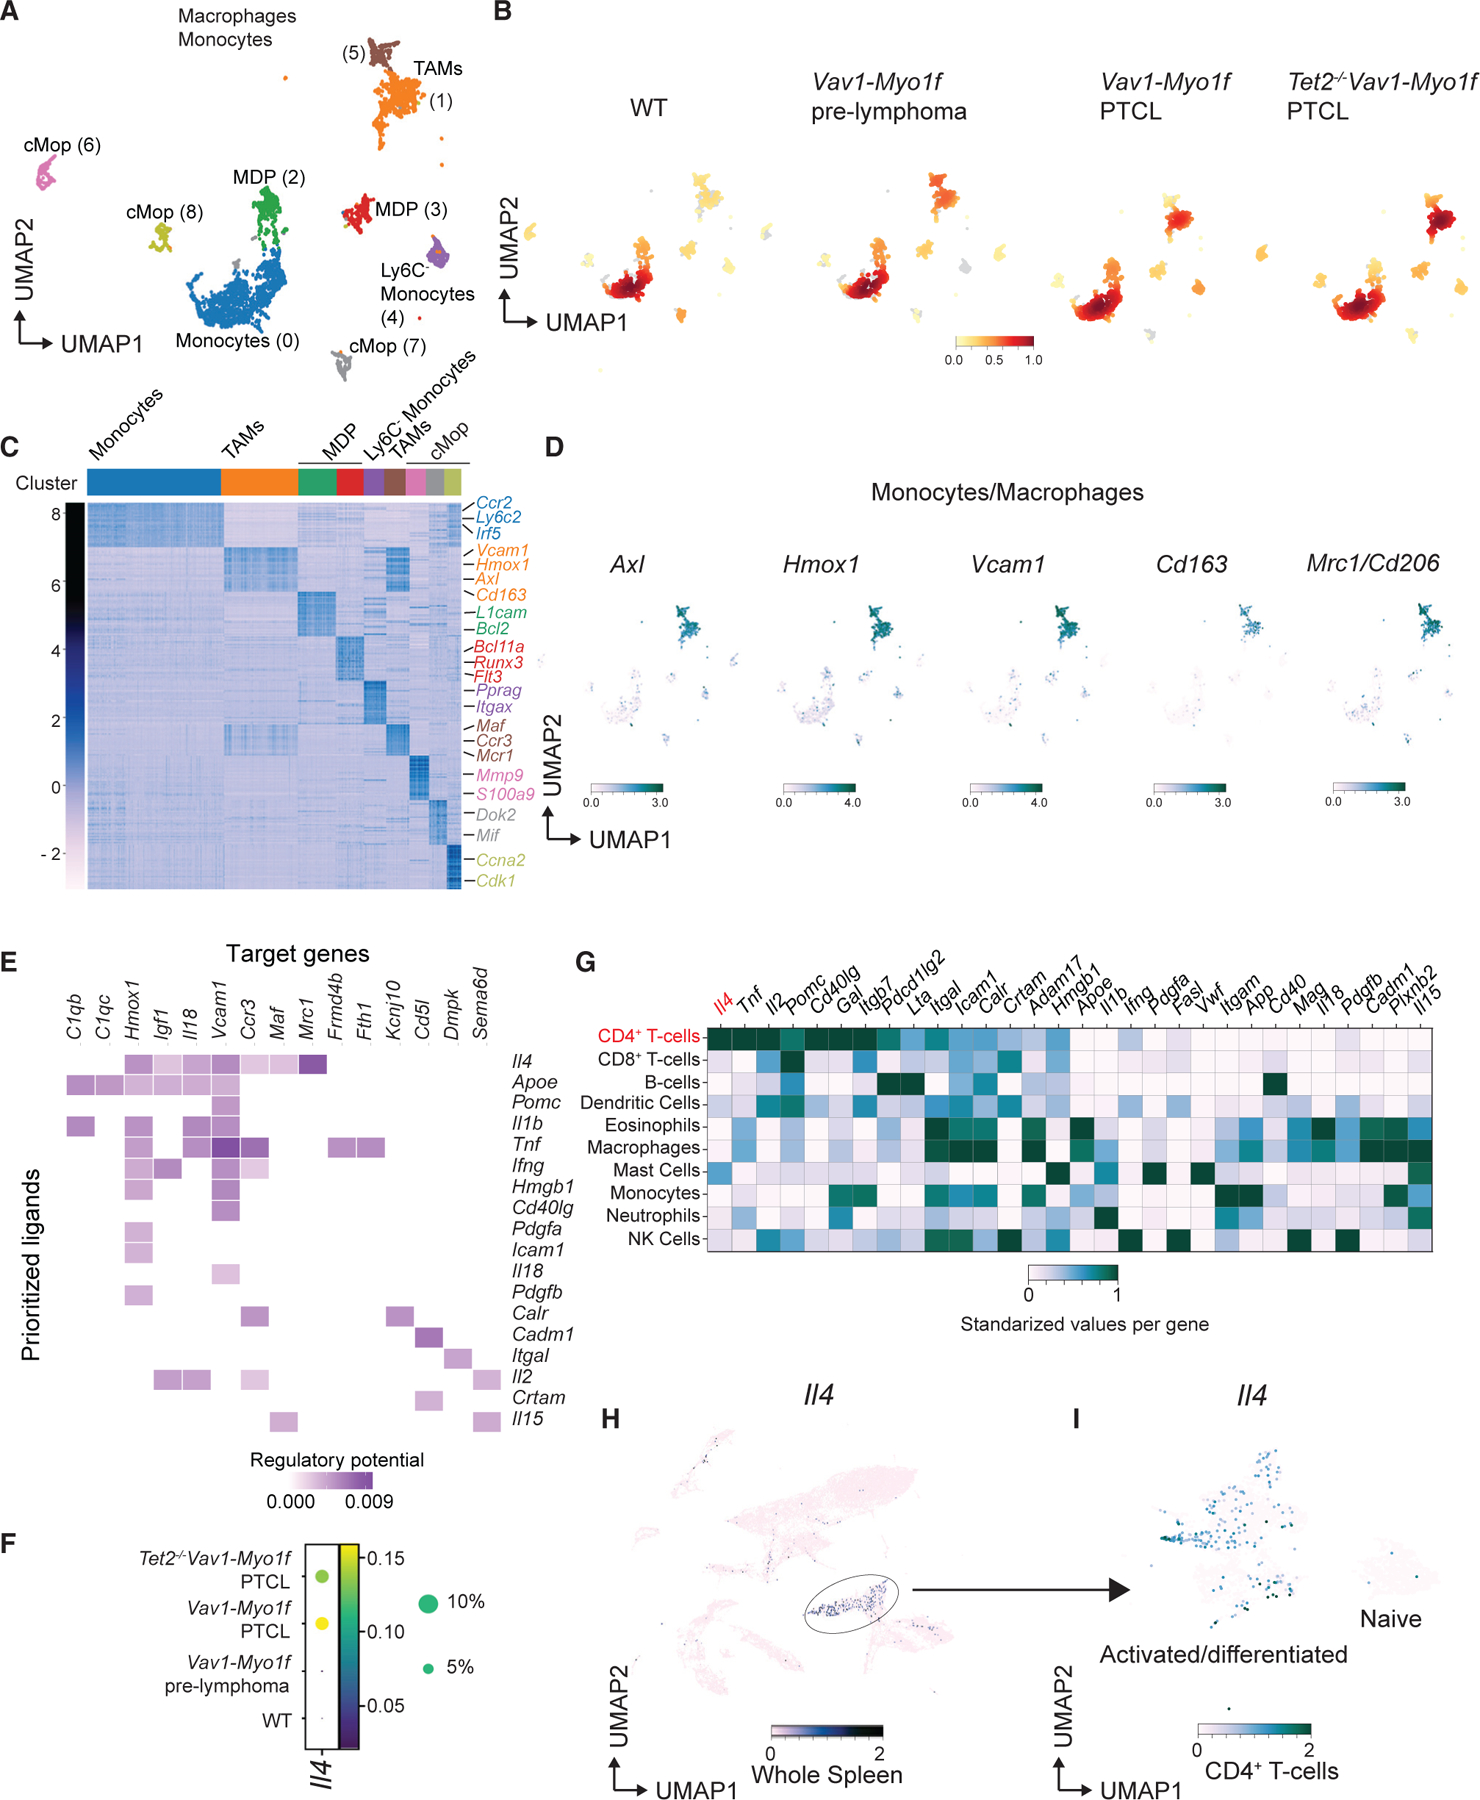
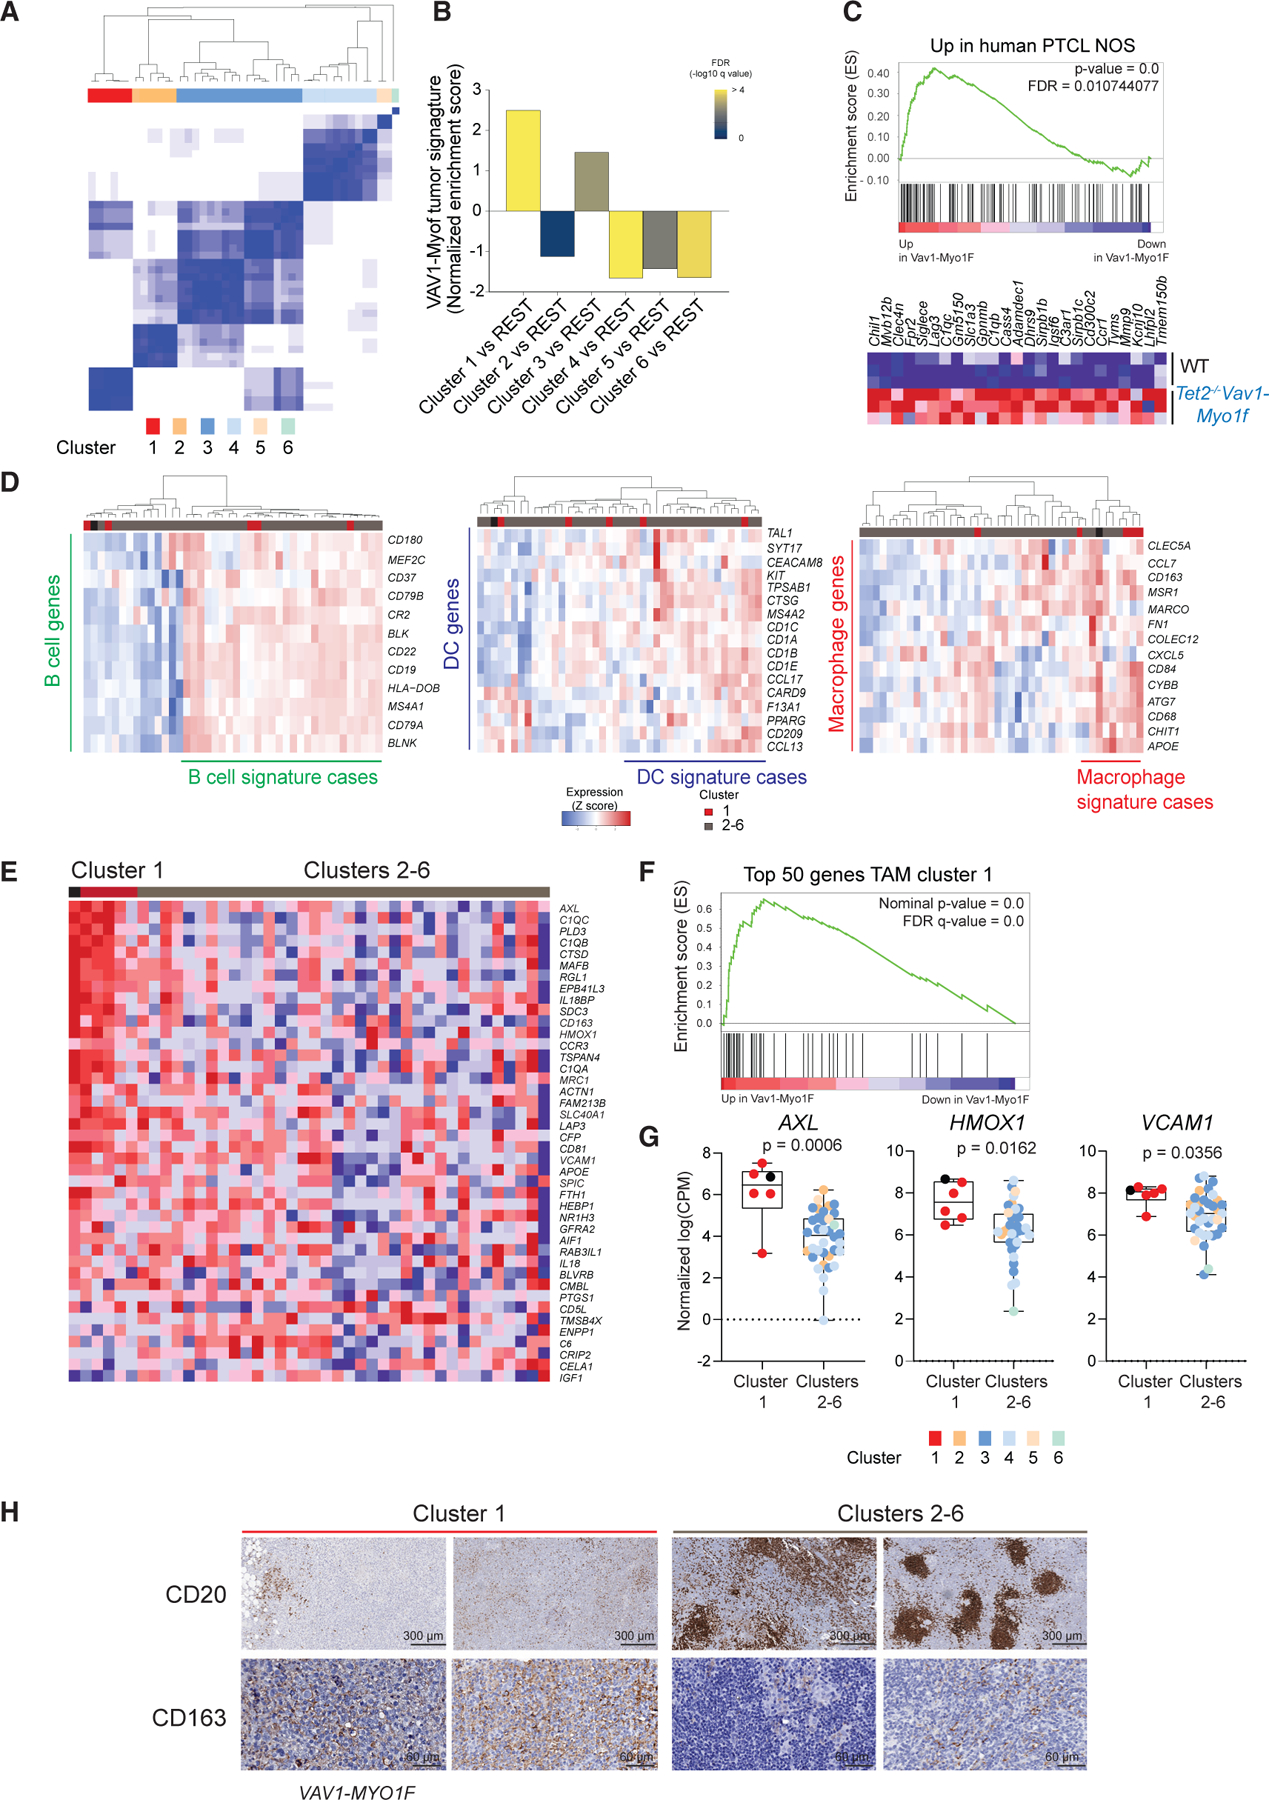
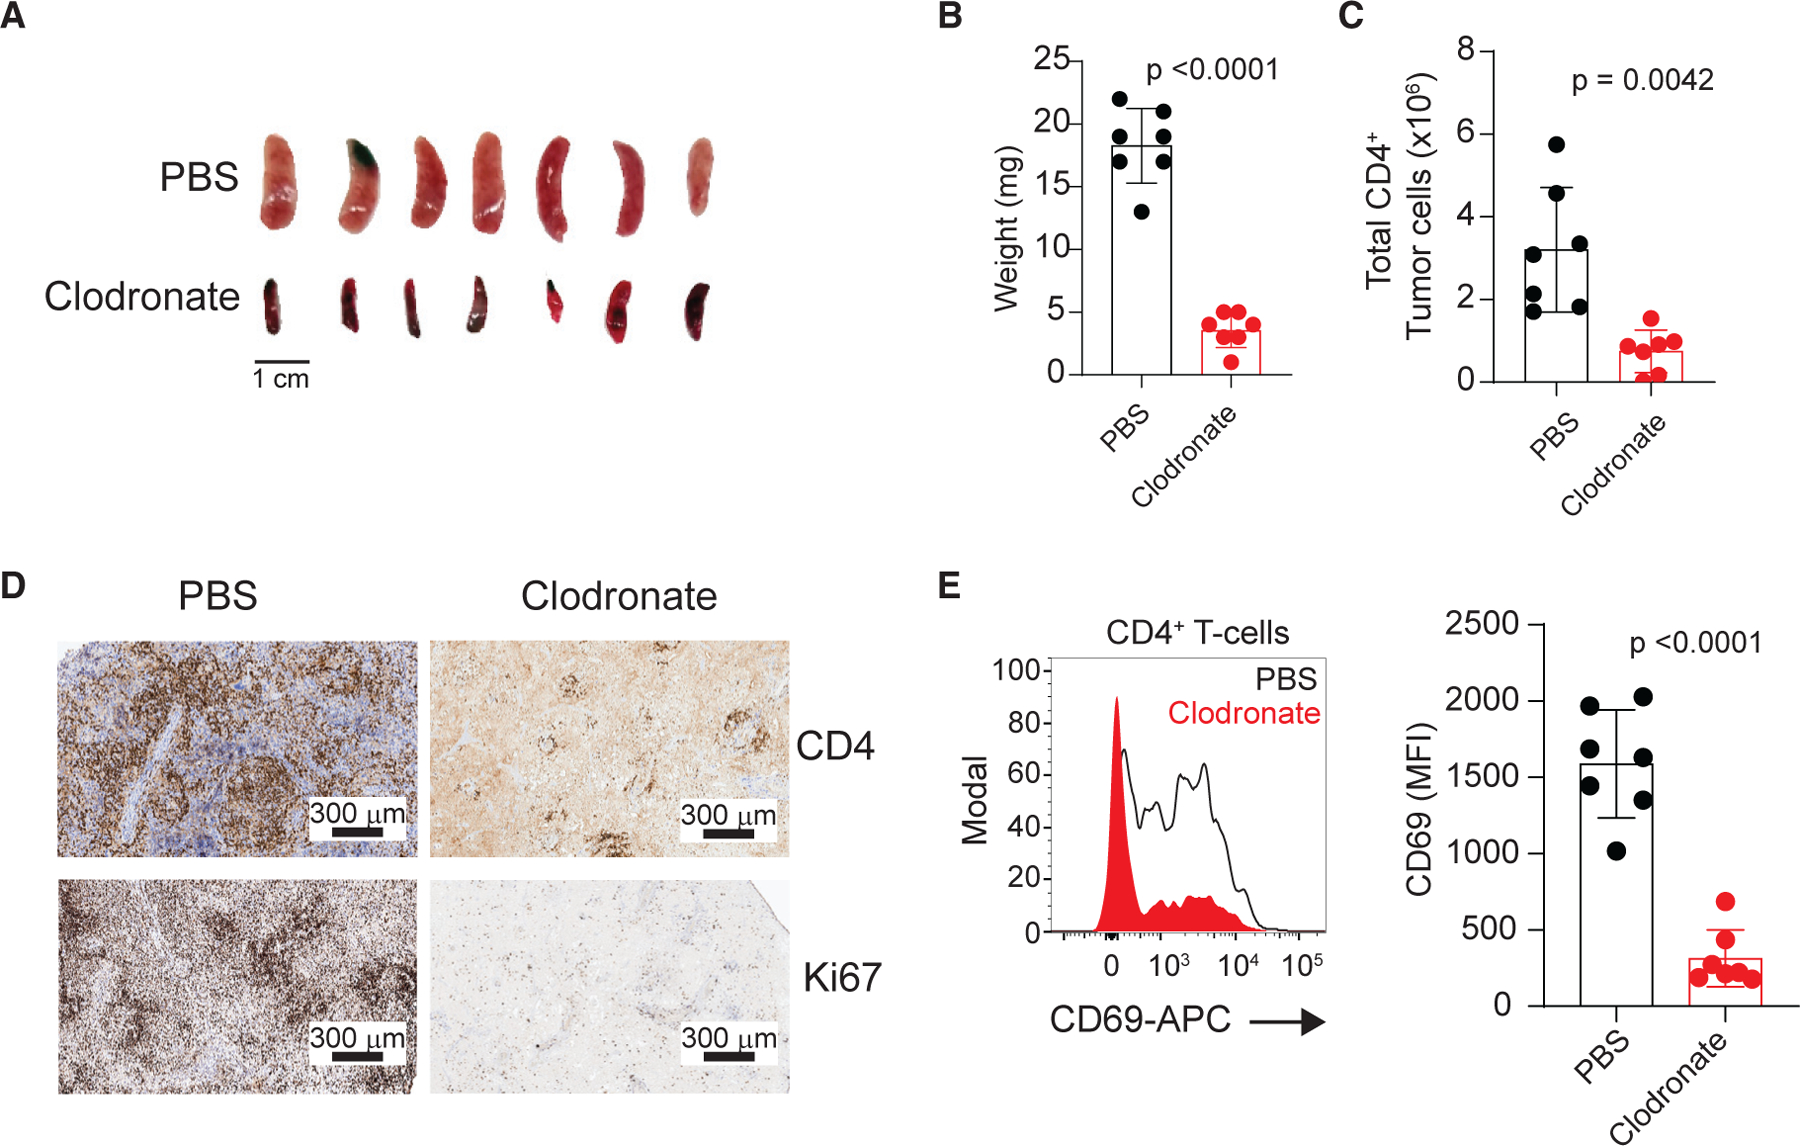
Peripheral T cell lymphoma not otherwise specified (PTCL-NOS) comprises heterogeneous lymphoid malignancies characterized by pleomorphic lymphocytes and variable inflammatory cell-rich tumor microenvironment. Genetic drivers in PTCL-NOS include genomic alterations affecting the VAV1 oncogene; however, their specific role and mechanisms in PTCL-NOS remain incompletely understood. Here we show that expression of Vav1-Myo1f, a recurrent PTCL-associated VAV1 fusion, induces oncogenic transformation of CD4+ T cells. Notably, mouse Vav1-Myo1f lymphomas show T helper type 2 features analogous to high-risk GATA3+ human PTCL. Single-cell transcriptome analysis reveals that Vav1-Myo1f alters T cell differentiation and leads to accumulation of tumor-associated macrophages (TAMs) in the tumor microenvironment, a feature linked with aggressiveness in human PTCL. Importantly, therapeutic targeting of TAMs induces strong anti-lymphoma effects, highlighting the lymphoma cells' dependency on the microenvironment. These results demonstrate an oncogenic role for Vav1-Myo1f in the pathogenesis of PTCL, involving deregulation in T cell polarization, and identify the lymphoma-associated macrophage-tumor microenvironment as a therapeutic target in PTCL.

Keywords: CP: Cancer; GATA3; T cell differentiation; VAV1; VAV1-MYO1F; peripheral T cell lymphoma; tumor microenvironment; tumor-associated macrophages.


Conflict of interest statement

Declaration of interests T.P. is the recipient of a research grant from Kura Oncology, Inc. R.R. is a member of the Scientific Advisory Board of AimenBio and founder of Genotwin. None of these activities are related to the work presented in this paper.

Figures

Figure 1.
Figure 1.. Vav1-Myo1f expression alters immune homeostasis and preferentially induces Th2 differentiation upon MAF upregulation
(A) Representative fluorescence-activated cell sorting (FACS) plot showing CD4/CD8 staining and associated quantification of CD4+ T cells in spleen samples from Vav1WT/co-Vav1-Myo1f;CD4CreERT2 mice treated with vehicle (WT) or tamoxifen (TMX) (Vav1-Myo1f). (B and C) Representative histograms and associated quantification of CD69 (B) and ICOS (C) in splenic CD4+ T cells from Vav1WT/co-Vav1-Myo1f;CD4CreERT2 mice treated in vivo with vehicle (WT) or TMX (Vav1-Myo1f). (D–G) Representative FACS plots of lineage marker staining and associated quantification of PD1+CXCR5+ Tfh cells (D), CD25+FOXP3 Treg cells (E), CD44 and CD62L (F), and CXCR3 and CCR6 T helper markers (G) in splenic CD4+ T cells isolated from Vav1WT/co-Vav1-Myo1f;CD4CreERT2 mice treated in vivo with vehicle (WT) or TMX (Vav1-Myo1f). (H) Heatmap representation showing differential expression of genes associated with T helper cell differentiation in CD4+ T cells from Vav1WT/co-Vav1-Myo1f;CD4-T2 CreER mice treated in vivo with vehicle (WT) or TMX (Vav-Myo1f). Transcription factors implicated in T helper cell fate are marked in red. Gene list was curated from public transcriptome and gene ontology datasets. (I) Graph representation of GSEA –log FDR q values for Th2, Tfh, and Th1 signatures. (J) GSEA showing the enrichment of a Th2 signature associated with the presence of the Vav1-Myo1f fusion, and heatmap representation of the top-ranking genes in the leading edge. (K) Analysis of IL-4 and IFNG secretion by wild-type (WT) or Vav1-Myo1f-expressing CD4+ T cells isolated from Vav1WT/co-Vav1-Myo1f;CD4CreERT2 mice and treated in vitro with vehicle (WT) or 4-hydroxytamoxifen (Vav1-Myo1f). (L) Representative histograms and associated quantification of the transcription factor MAF in CD4+ T cells isolated from Vav1WT/co-Vav1-Myo1f;CD4CreERT2 mice and treated as described in (K). For gene expression analysis, three independent replicates per genotype were analyzed. For in vivo experiments (A–G), the data correspond to two independent experiments (n = 3 animals/group). p values were calculated using a two-tailed Student’s t test. Error bars denote mean ± SD. See also Figure S1.
Figure 2.
Figure 2.. Vav1-Myo1f expression enhances TCR signaling and proliferation of CD4+ T cells
(A) Flow-cytometry analysis of VAV1 phosphorylation in Vav1WT/co-Vav1-Myo1f;CD4CreERT2 CD4+ T cells treated in vitro with vehicle (WT) or 4-hydroxytamoxifen (Vav1-Myo1f) upon TCR stimulation. (B) Representative FACS plot and associated quantification of phosphorylation of ERK1/2 in CD4+ T cells obtained and treated as in (A). (C) Quantification of Th1, Th2, and Th17 cytokines from media collected from cells obtained and stimulated as in (A). Cytokine quantification is represented as expression ratio in Vav1-Myo1f-expressing versus control WT cells. (D) In vitro cell trace violet (CTV) proliferation assay of CD4+ T cells isolated from Vav1WT/co-Vav1-Myo1f;CD4CreERT2 mice, treated with vehicle (WT) or TMX (Vav1-Myo1f) and stimulated with anti-CD3/anti-CD28. (E) Representative FACS plot and associated quantification of the upregulation of the activation markers CD69 and CD25 in WT or Vav1-Myo1f CD4+ T cells after in vitro stimulation with anti-CD3/anti-CD28. (F) Analysis of cell viability in CD4+ T cells isolated from Vav1WT/co-Vav1-Myo1f;CD4CreERT2 and treated with vehicle (WT) or 4-hydroxytamoxifen in absence or decreasing concentrations of IL-2. Mean fluorescence intensity values in (B) were calculated as fold change in activated versus non-activated cells from four independent experiments. p values in (C)–(F) were calculated using a two-tailed Student’s test in triplicate samples. (G) In vivo CTV proliferation assay of WT and Vav1-Myo1f-expressing CD4+ T cells obtained from OT-II;Vav1WT/co-Vav1-Myo1f;CD4CreERT2 mice, treated with vehicle (WT) or 4-hydroxytamoxifen (Vav1-Myo1f) and transferred to Ly5.1+ C57BL/6 mice. Data were obtained 3 days after immunization of recipients with OVA/Alum. (H) Analysis of the activation marker CD69 in highly proliferative cells obtained from (G). p values in (G) and (H) were calculated using a two-tailed Student’s t test with n = 3 animals/group. Error bars denote mean ± SD.
Figure 3.
Figure 3.. Expression of Vav1-Myo1f and loss of Tet2 in CD4+ T cells induces lymphoma with GATA3+ PTCL-NOS features
(A) Kaplan-Meier survival curve of Vav1WT/co-Vav1-Myo1f;Tet2fl/fl;CD4CreERT2 animals treated with vehicle (WT) or tamoxifen (TMX) (Tet2−/−Vav1-Myo1f) (n = 10 mice/group). TMX administration and sheep red blood cells (SRBC) immunizations are indicated by arrows in the timeline (black, TMX; red, SRBC). (B) Histological hematoxylin-eosin (H&E) staining and immunohistochemical analysis of the expression of CD3 and CD4 in representative lymph node tissues obtained from Vav1-Myo1f lymphoma-bearing mice. Image magnifications are indicated by scale bars. (C) Flow-cytometry analysis and quantification of activated CD4+CD69+ T cells in the spleen of Tet2−/−Vav1-Myo1f lymphoma-bearing mice and WT control littermates. (D) Pie-chart representation of TCRB Vβ clonality analysis by flow cytometry on spleen samples from diseased animals. Colored segments indicate specific TCRB rearrangements that show significant expansion in each of the lymphoma samples compared with the reference TCR repertoire in WT mice. Data from three representative tumors are shown. (E) Flow-cytometry analysis of GATA3 and MAF expression in Tet2−/−Vav1-Myo1f CD4+ lymphoma cells and WT controls. (F) Quantification of IL-4 and IL-10 from media collected from Tet2−/−Vav1-Myo1f tumor cells upon stimulation with anti-CD3/anti-CD28. (G) GSEA —log FDR q values of Th1, Th2, Th17, Treg, and Tfh signatures in sorted CD4+ T cells from Tet2−/−Vav1-Myo1f-induced lymphoma. (H) GSEA plot showing enrichment in a Th2 signature in sorted CD4+ T cells isolated from Tet2−/−Vav1-Myo1f lymphoma-bearing mice and control WT CD4+ T cells. The heatmap represents the top-ranking 20 genes in the leading edge. Lineage marker genes associated with Th2 cell differentiation are shown in red. p value in (C) and (E) was calculated with two-tailed Student’s t test using n = 5 animals/group. Error bars denote mean ± SD. See also Figures S2–S5.
Figure 4.
Figure 4.. Immune cell analysis of Vav1-Myo1f-driven lymphomas at single-cell resolution identifies Th2-like tumor cells
(A) Uniform manifold approximation and projection (UMAP) representation of 44,262 single-cell transcriptional profiles corresponding to 12 whole-spleen samples. Cluster identification was performed using an optimal Louvain resolution of 0.25. (B) Cell type classification using the ImmuCC algorithm. (C) UMAP representation of the 4,808 cells classified as CD4+ T cells and belonging to clusters 2 and 3 from (A). T cell lineages are indicated. (D) Density plots of CD4+ T cell clusters across the different experimental conditions: WT, Vav1-Myo1f pre-lymphoma, Vav1-Myo1f lymphoma, and Tet2−/−Vav1-Myo1f lymphoma. Color intensity is augmented with increasing cell number. (E) Heatmap (Z scores) of top 30 differentially expressed genes in each cluster obtained in (C). (F) UMAP feature plots, indicating expression (log scale) of the Th2-associated transcription factors Gata3 and Maf. Color intensity is augmented with increasing expression. (G) Bubble plot representation of the expression of selected CD4+ T cell lineage marker genes in WT, Vav1-Myo1f pre-lymphoma, Vav1-Myo1f lymphoma, and Tet2−/−Vav1-Myo1f lymphoma samples. Bubble radius shows the percentage of cells within each condition, and color scale represents mean expression. Expression of Klf2 uses a different color legend for visualization purposes. See also Figure S6; Tables S1, S2, and S3.
Figure 5.
Figure 5.. Immune cell analysis of Vav1-Myo1f-driven lymphomas at single-cell resolution reveals involvement of TAMs during lymphomagenesis
(A) UMAP representation of 4,417 cells classified as monocytes and macrophages included in clusters 6, 7, 8, 11, and 13 from Figure 4A. Macrophage/monocyte lineages are indicated. (B) Density plots of monocyte/macrophage populations across the different experimental conditions: WT, Vav1-Myo1f pre-lymphoma, Vav1-Myo1f lymphoma, and Tet2−/−Vav1-Myo1f lymphoma. Color intensity is augmented with increasing cell number. (C) Heatmap (Z scores) of top 30 differentially expressed genes in each cluster obtained in (A). (D) UMAP feature plots, indicating expression (log scale) of representative TAM genes. (E) Receptors of prioritized ligands expressed by TAMs. Color intensity is augmented with increasing regulatory potential. (F) Bubble plot representation of the expression of Il4 in WT, Vav1-Myo1f pre-lymphoma, Vav1-Myo1f lymphoma, and Tet2−/−Vav1-Myo1f lymphoma samples. Bubble radius shows the percentage of cells within each condition, and color scale represents mean expression. (G) Standardized gene expression of the prioritized ligands by the different immune cell types present in lymphoma samples. (H and I) UMAP feature plots, indicating expression (log scale) of Il4 in the whole spleen (H) or restricted to CD4+ T cells (I). Color intensity in (D), (H), and (I) is augmented with increasing expression. See also Figures S7 and S8; Tables S4, S5, and S6.
Figure 6.
Figure 6.. Vav1-Myo1f mouse lymphomas resemble a human PTCL-NOS subgroup characterized by a macrophage signature
(A) Unsupervised consensus clustering of 42 cases of PTCL-NOS (K = 6). (B) Normalized enrichment scores by GSEA of murine Tet2−/−Vav1-Myo1f signature comparing the different clusters of human PTCL-NOS in (A). (C) GSEA analysis revealed an enrichment of the PTCL-NOS cluster 1 upregulated genes in Tet2−/−Vav1-Myo1f mouse tumors versus normal spleen samples (NES = 1.81, FDR = 0.01). The heatmap represents the top-ranking genes in the leading edge. (D) Hierarchical clustering of 42 PTCL-NOS according to specific microenvironment signatures (from left to right: B cell, dendritic cell [DC], and macrophage signatures). (E) Hierarchical clustering of PTCL-NOS samples according to TAM signature containing the top 50 upregulated genes identified by single-cell analysis as mouse TAMs enriched in Vav1-Myo1f-induced lymphomas. Cluster 1 samples shown in red; clusters 2–6 samples shown in gray. The sample with the VAV1-MYO1F fusion is represented by a black square. (F) GSEA analysis of top 50 upregulated genes in TAMs in human PTCL-NOS cluster 1. (G) Comparison of gene expression levels (normalized log(CPM)) of characteristic TAM markers in human PTCL-NOS unsupervised clusters from (A). Cluster 1 samples are shown by red circles. The human index case containing the VAV1-MYO1F gene fusion is indicated by a black circle. Clusters 2–6 are color coded as indicated. (H) Representative immunohistochemical micrographs of formalin-fixed sections from human PTCL-NOS biopsies stained with the B cell marker CD20 and CD163 M2 macrophage marker. Cluster 1 samples are shown in red; clusters 2–6 samples in gray. The index sample harboring the VAV1-MYO1F oncogenic fusion is labeled as VAV1-MYO1F. Scale bar values are indicated. p values were calculated using a two-tailed Student’s t test. Error bars denote mean ± SD.
Figure 7.
Figure 7.. Effect of macrophage depletion on Vav1-Myof-induced lymphoma cell proliferation
(A) Spleens from mice bearing Tet2−/−Vav1-Myo1f-induced lymphoma treated with control PBS- or clodronate-containing liposomes. Scale bar values are indicated. (B and C) Quantification of spleen weight (B) and CD4+ tumor load (C) at endpoint in a cohort of mice transplanted with Tet2−/−Vav1-Myo1f-expressing tumors and treated with control PBS or clodronate-containing liposomes (n = 7). (D) Representative micrographs showing expression of CD4 and Ki67 markers by immunohistochemistry staining of spleen sections from Tet2−/−Vav1-Myo1f-expressing tumor-bearing mice treated with PBS- or clodronate-containing liposomes. Scale bar values are indicated. (E) Representative histogram and associated quantification of CD69 expression in Tet2−/−Vav1-Myo1f lymphoma cells isolated from lymphoma-bearing mice treated with clodronate (red) or control (black line) liposomes. In (B), (C), and (E), circles represent individual mice and bar height indicates mean values. p values were calculated using a two-tailed Student’s t test. Error bars denote mean ± SD. See also Figure S9.

References

    1. Abate F, da Silva-Almeida AC, Zairis S, Robles-Valero J, Couronne L, Khiabanian H, Quinn SA, Kim MY, Laginestra MA, Kim C, et al. (2017). Activating mutations and translocations in the guanine exchange factor VAV1 in peripheral T-cell lymphomas. Proc. Natl. Acad. Sci. U S A 114, 764–769. - PMC - PubMed
    1. Aghajani K, Keerthivasan S, Yu Y, and Gounari F (2012). Generation of CD4CreER(T(2)) transgenic mice to study development of peripheral CD4-T-cells. Genesis 50, 908–913. - PMC - PubMed
    1. Allavena P, Anfray C, Ummarino A, and Andon FT (2021). Therapeutic manipulation of tumor-associated macrophages: facts and hopes from a clinical and translational perspective. Clin. Cancer Res 27, 3291–3297. - PubMed
    1. Amador C, Greiner TC, Heavican TB, Smith LM, Galvis KT, Lone W, Bouska A, D’Amore F, Pedersen MB, Pileri S, et al. (2019). Reproducing the molecular subclassification of peripheral T-cell lymphoma-NOS by immunohistochemistry. Blood 134, 2159–2170. - PMC - PubMed
    1. Boddicker RL, Razidlo GL, Dasari S, Zeng Y, Hu G, Knudson RA, Greipp PT, Davila JI, Johnson SH, Porcher JC, et al. (2016). Integrated mate-pair and RNA sequencing identifies novel, targetable gene fusions in peripheral T-cell lymphoma. Blood 128, 1234–1245. - PMC - PubMed

Publication types

MeSH terms