. 2022 Apr 19;39(3):110692.
doi: 10.1016/j.celrep.2022.110692.

Mitotic Spindle Positioning (MISP) is an actin bundler that selectively stabilizes the rootlets of epithelial microvilli

Affiliations

Mitotic Spindle Positioning (MISP) is an actin bundler that selectively stabilizes the rootlets of epithelial microvilli

E Angelo Morales et al. Cell Rep. .

Abstract

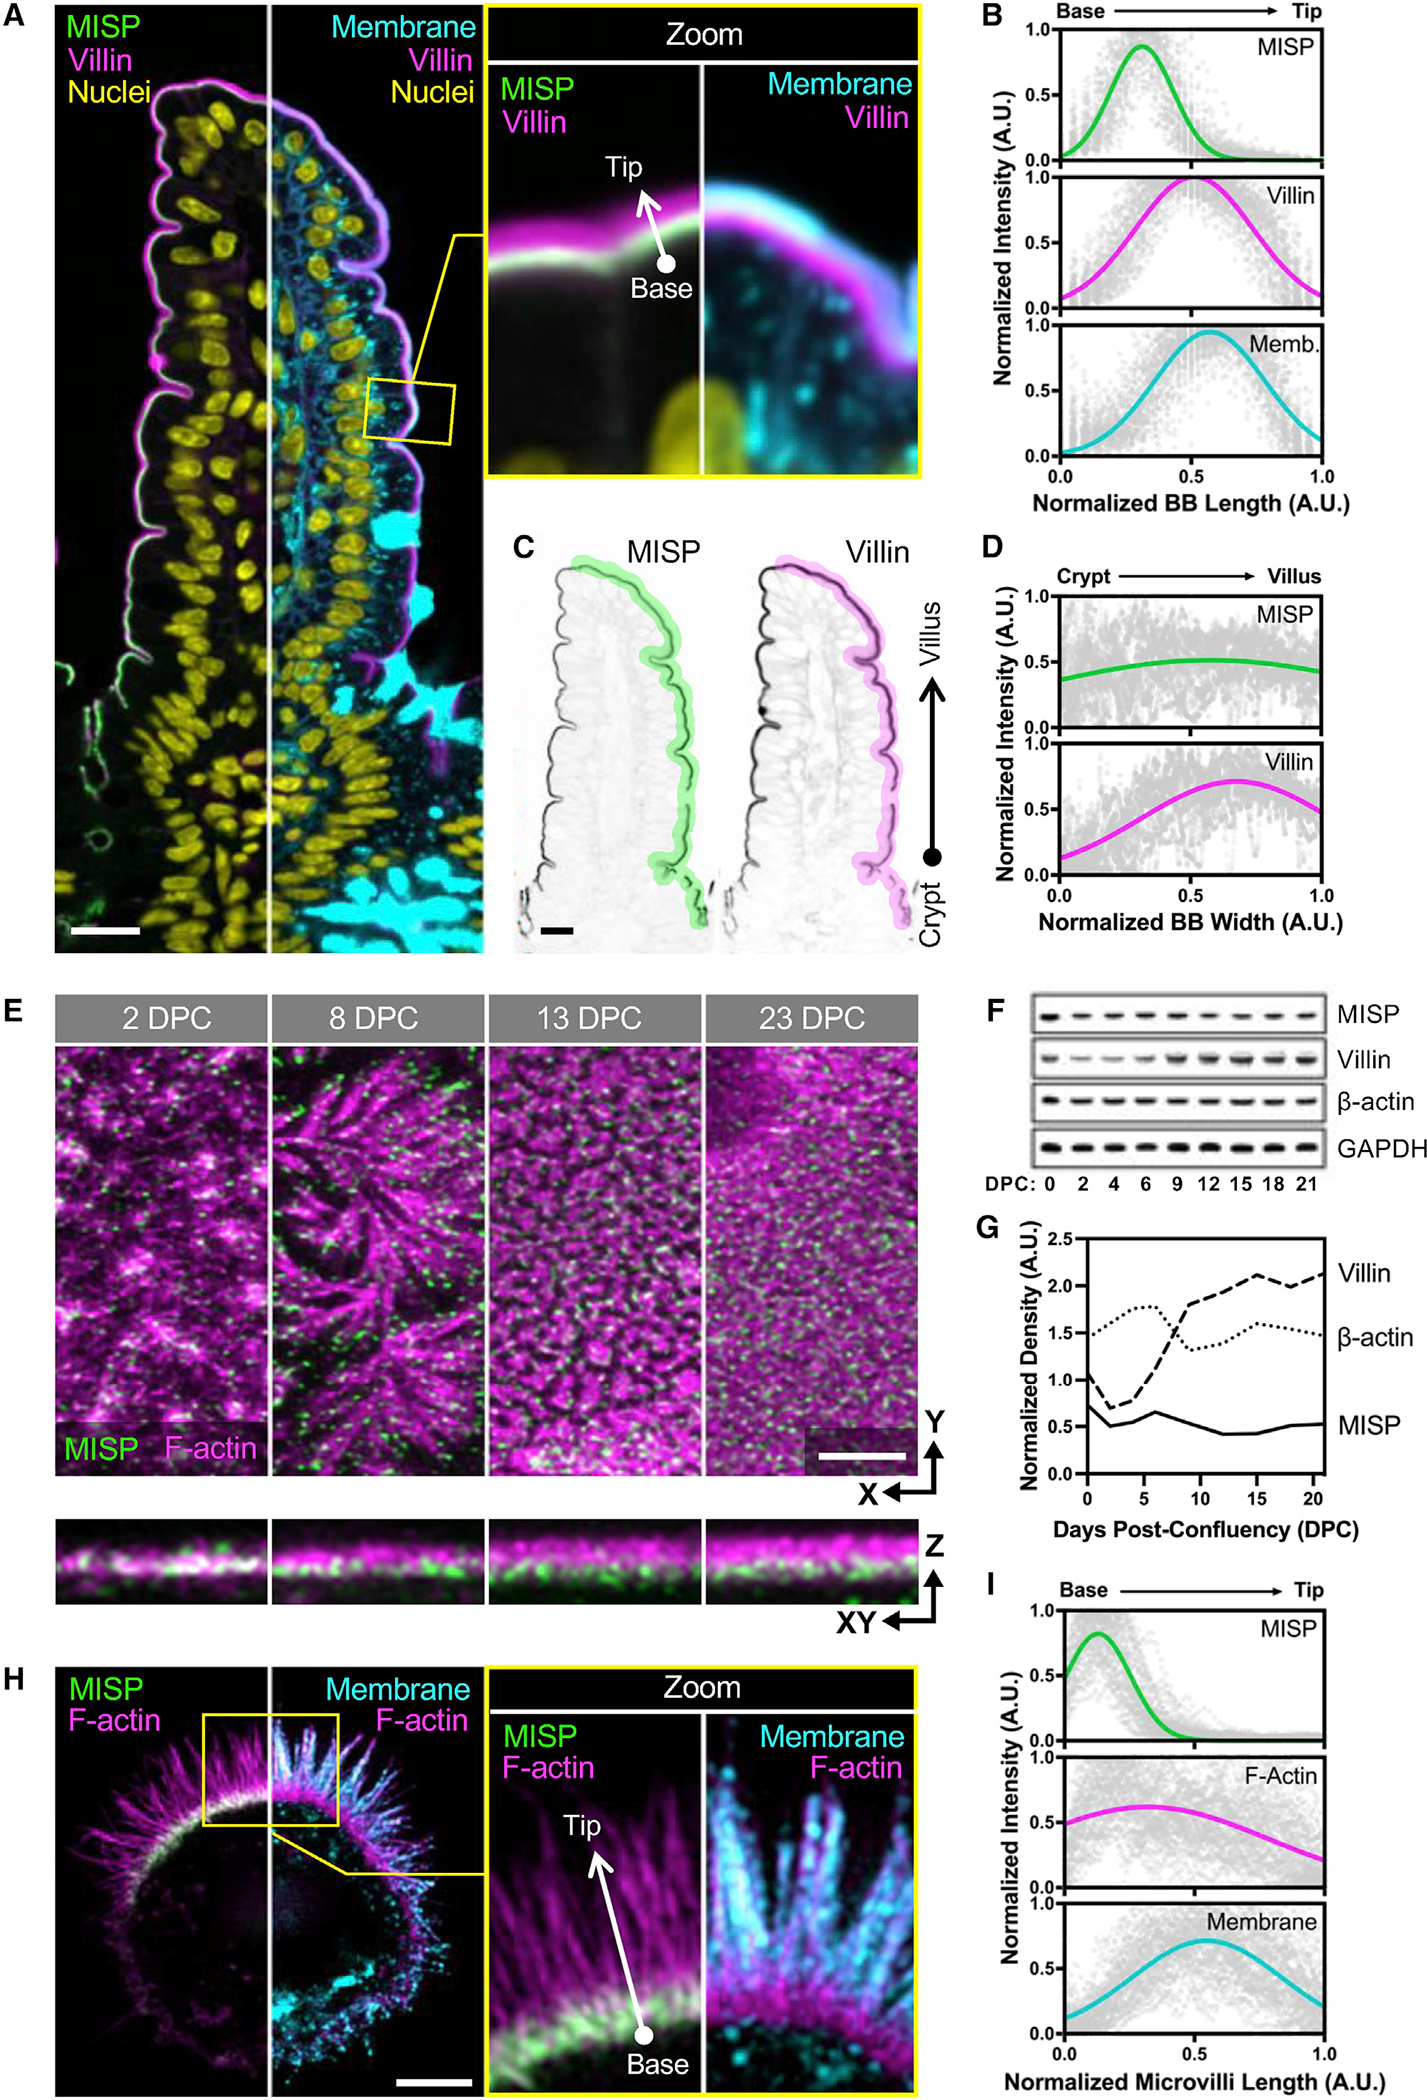
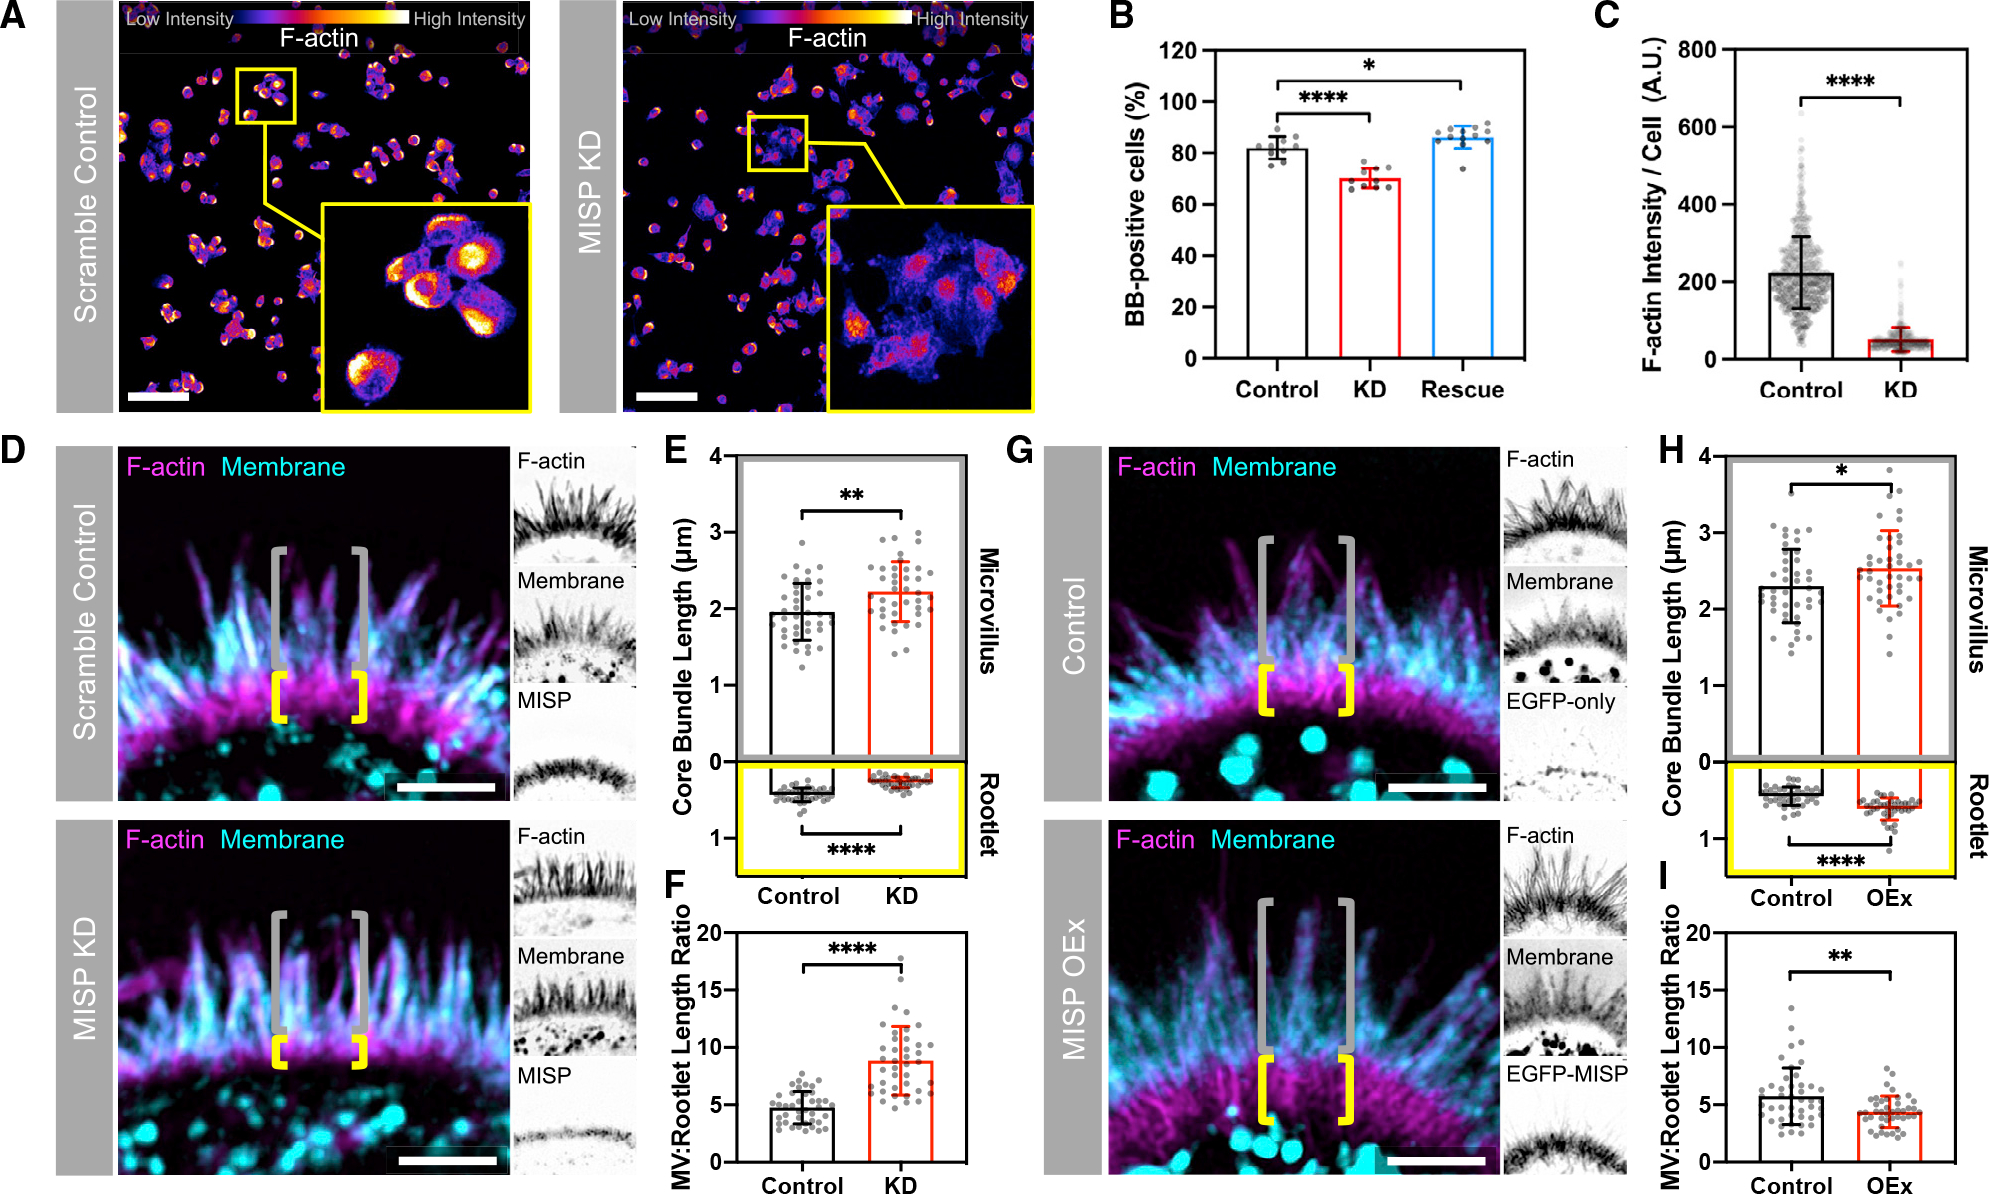
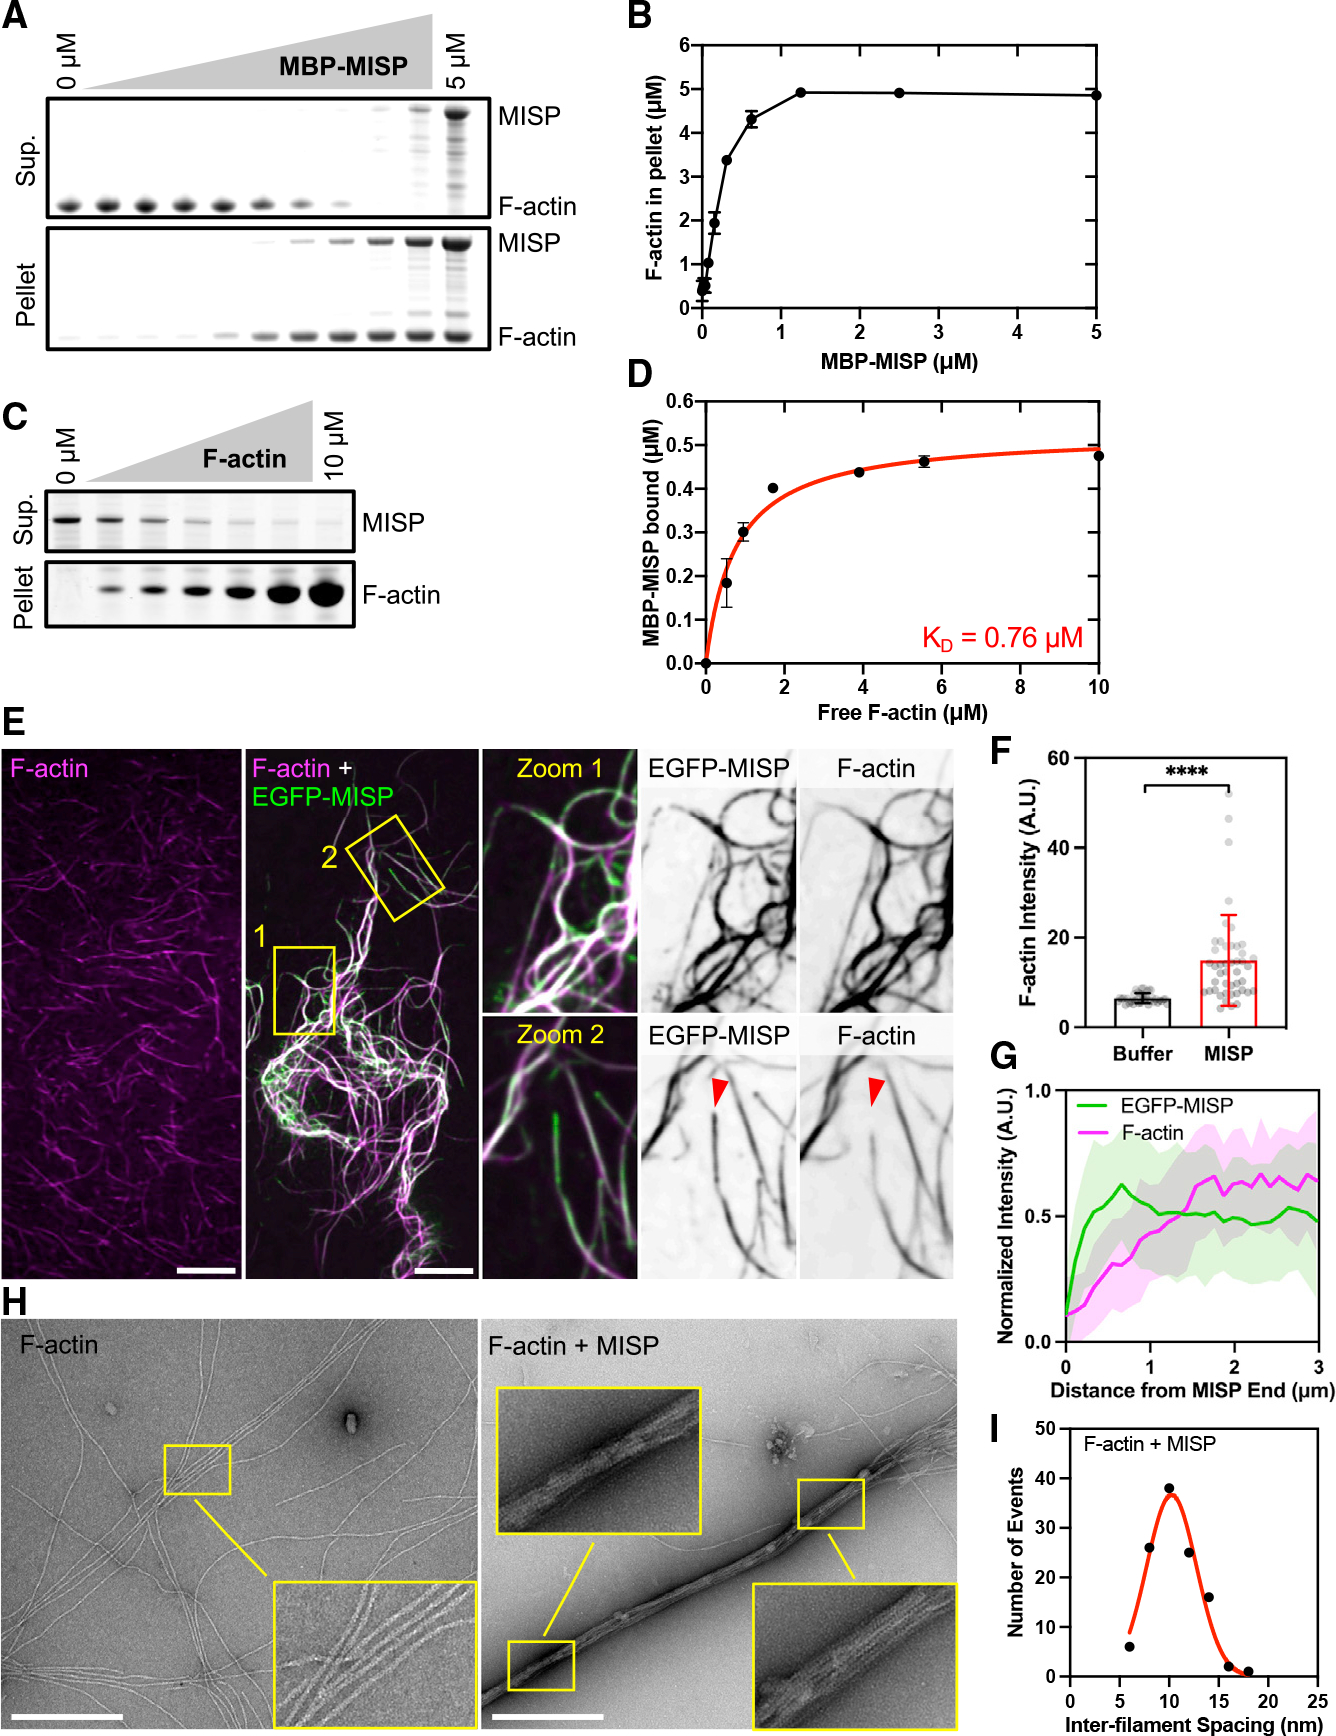
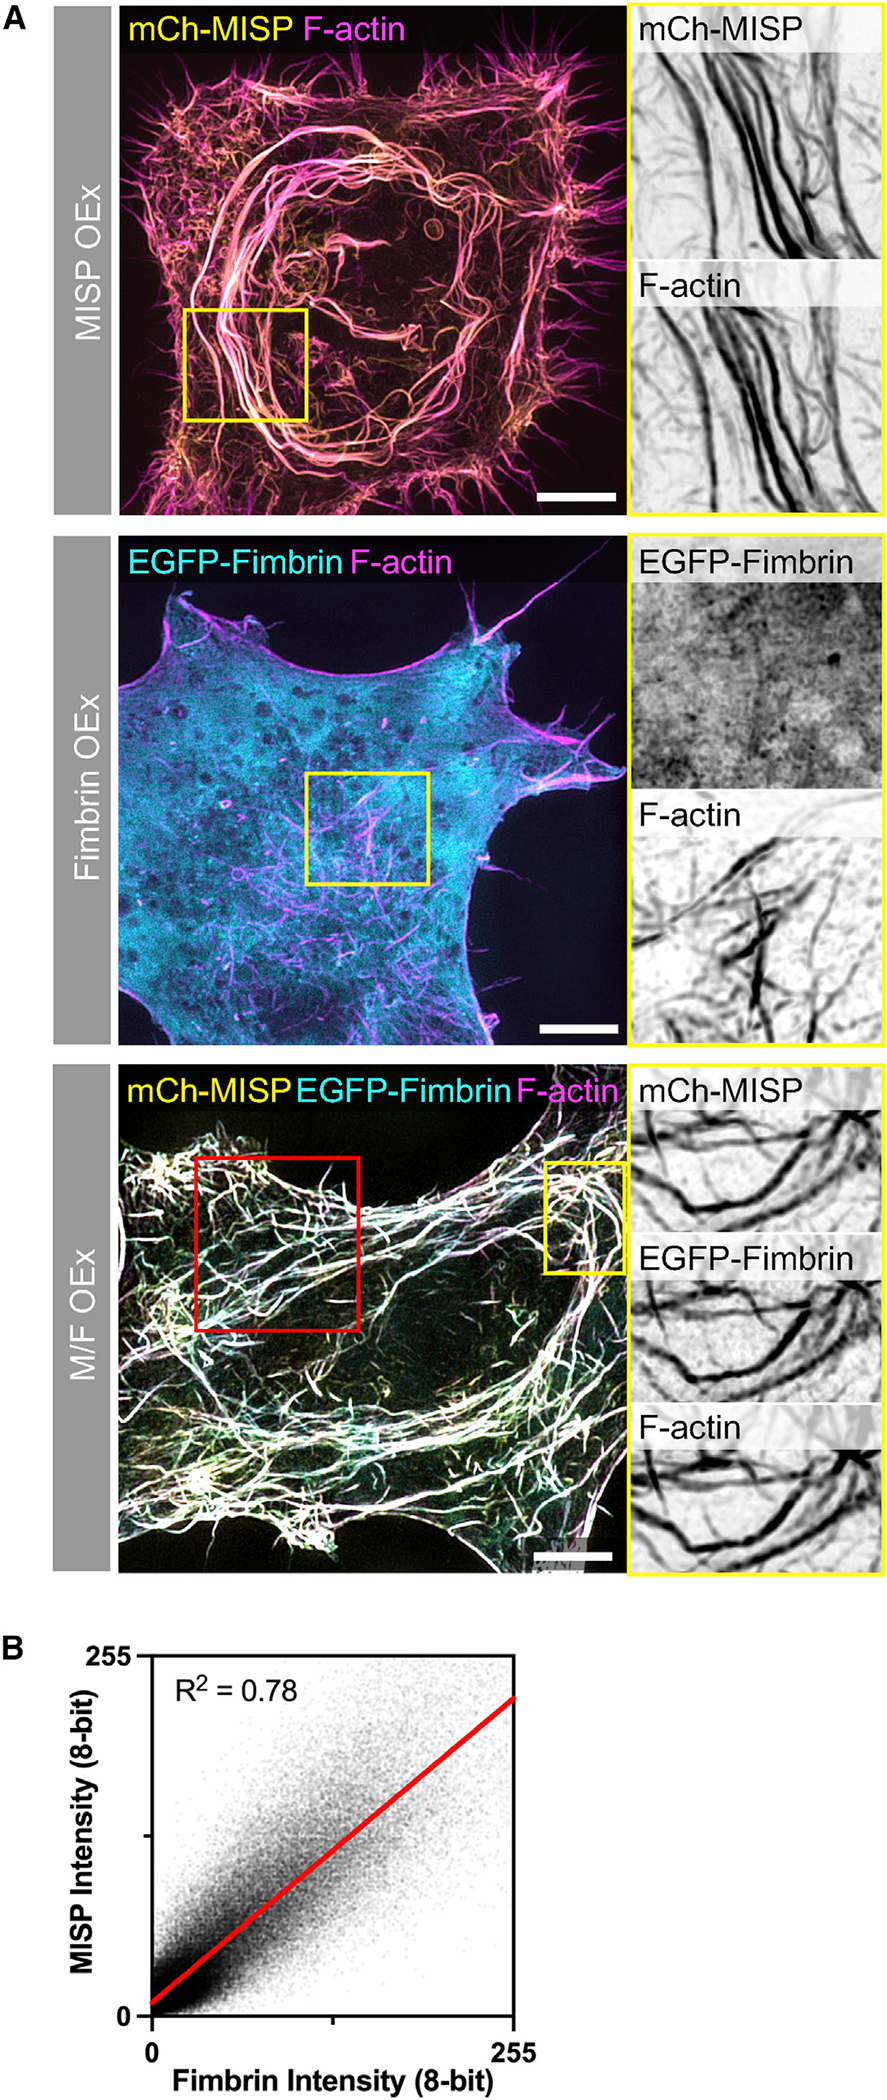
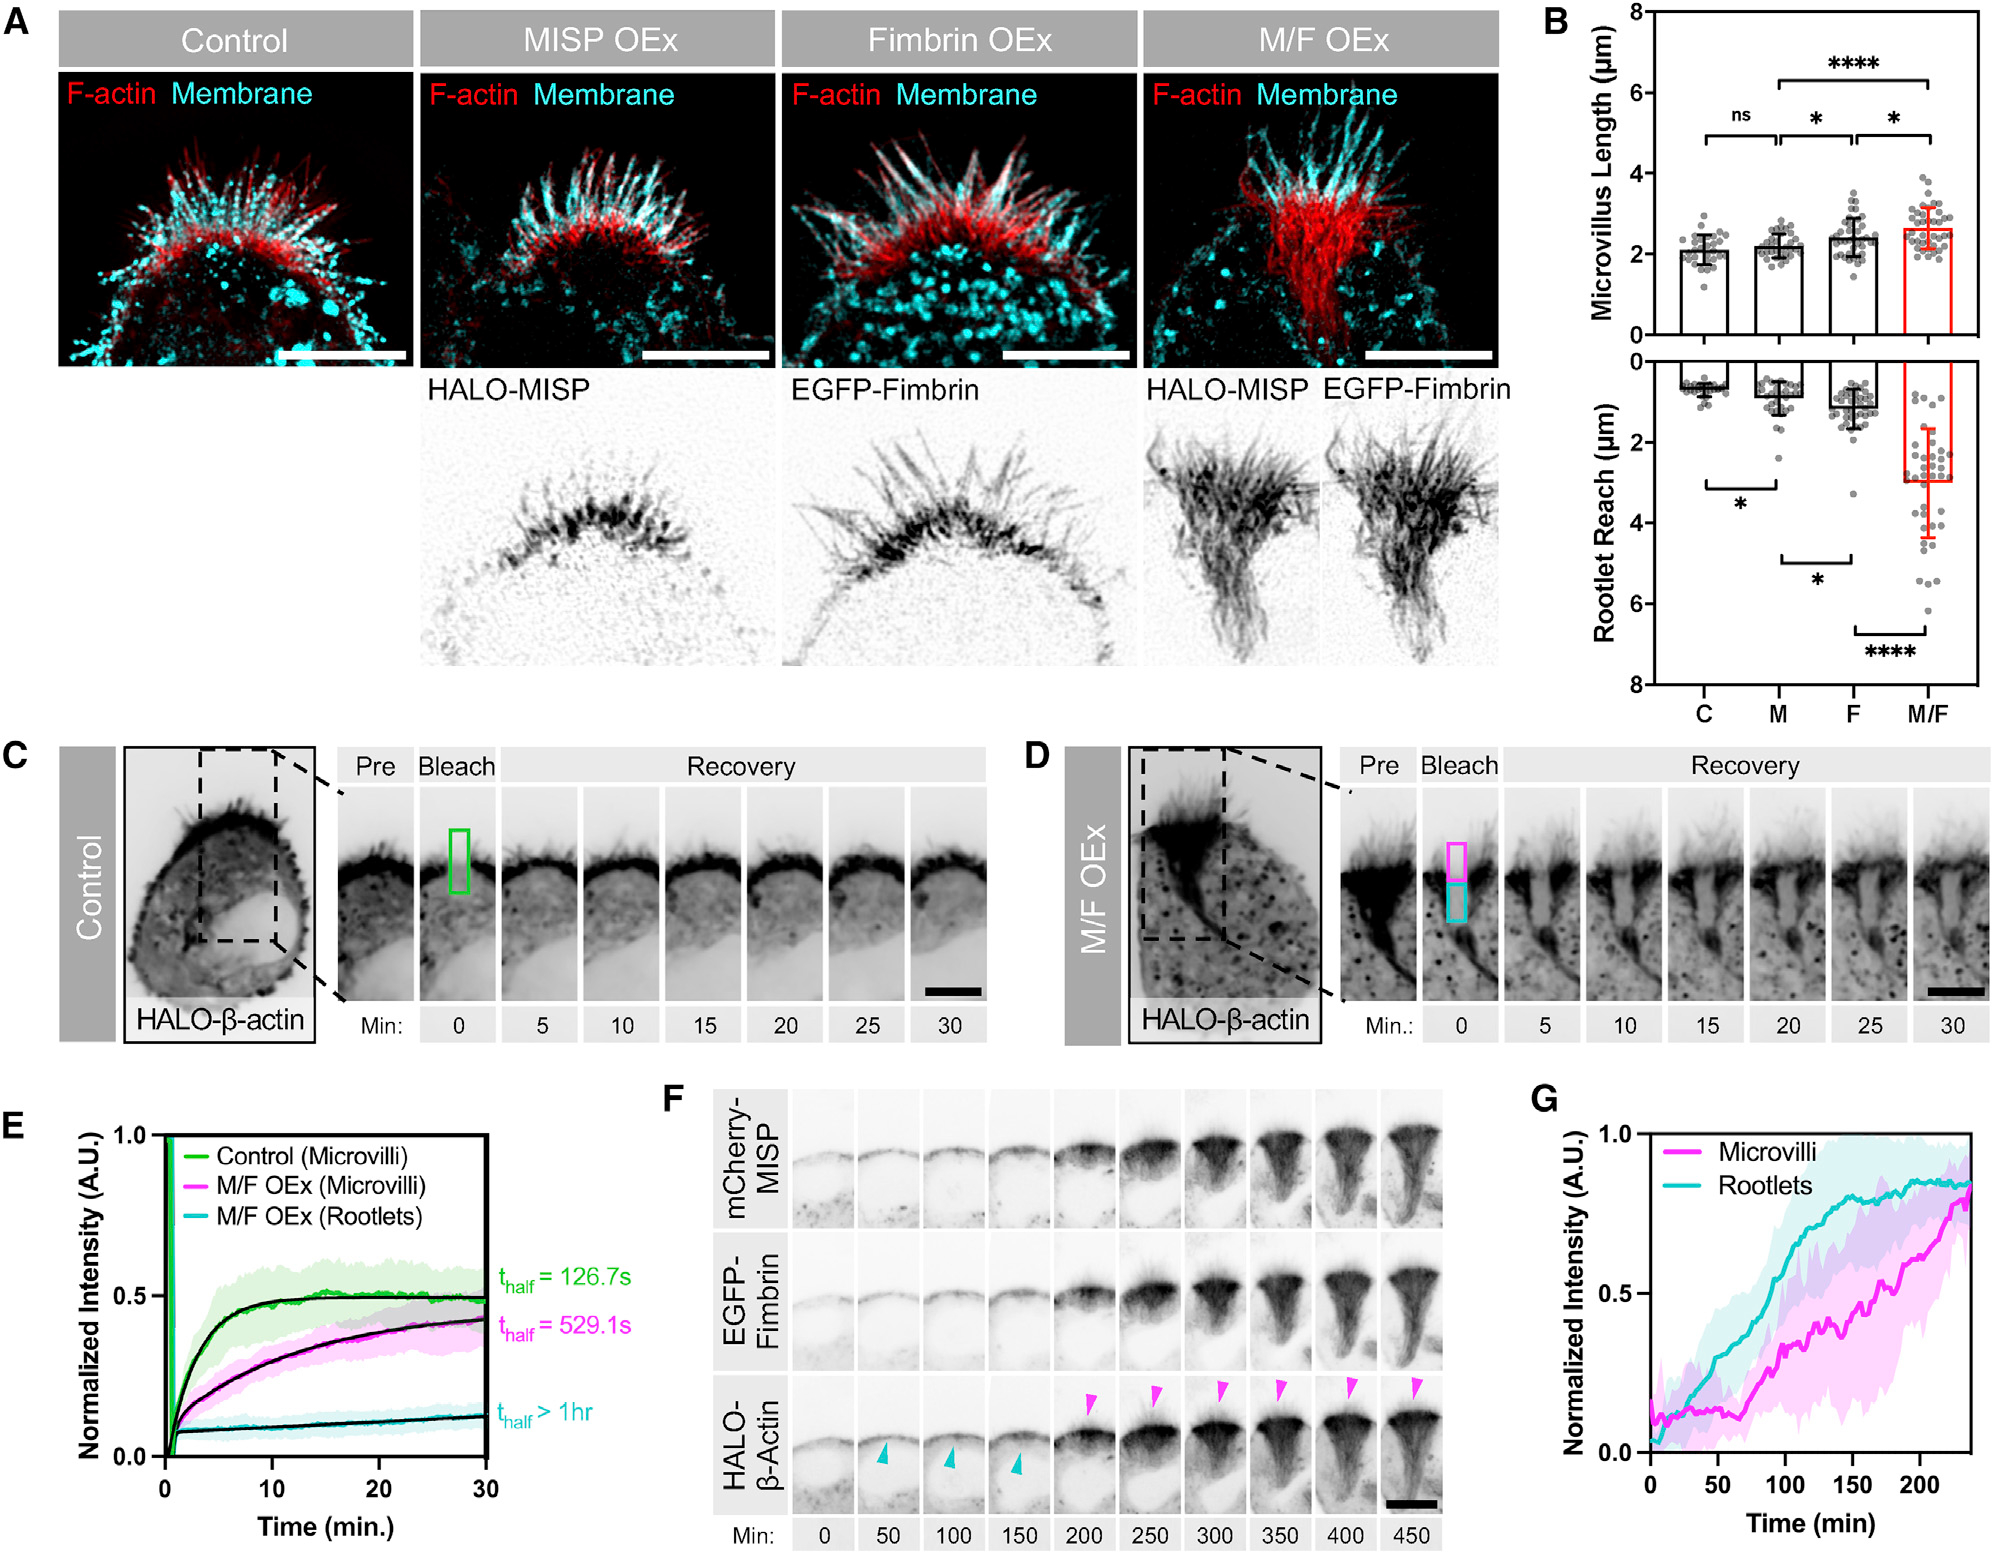
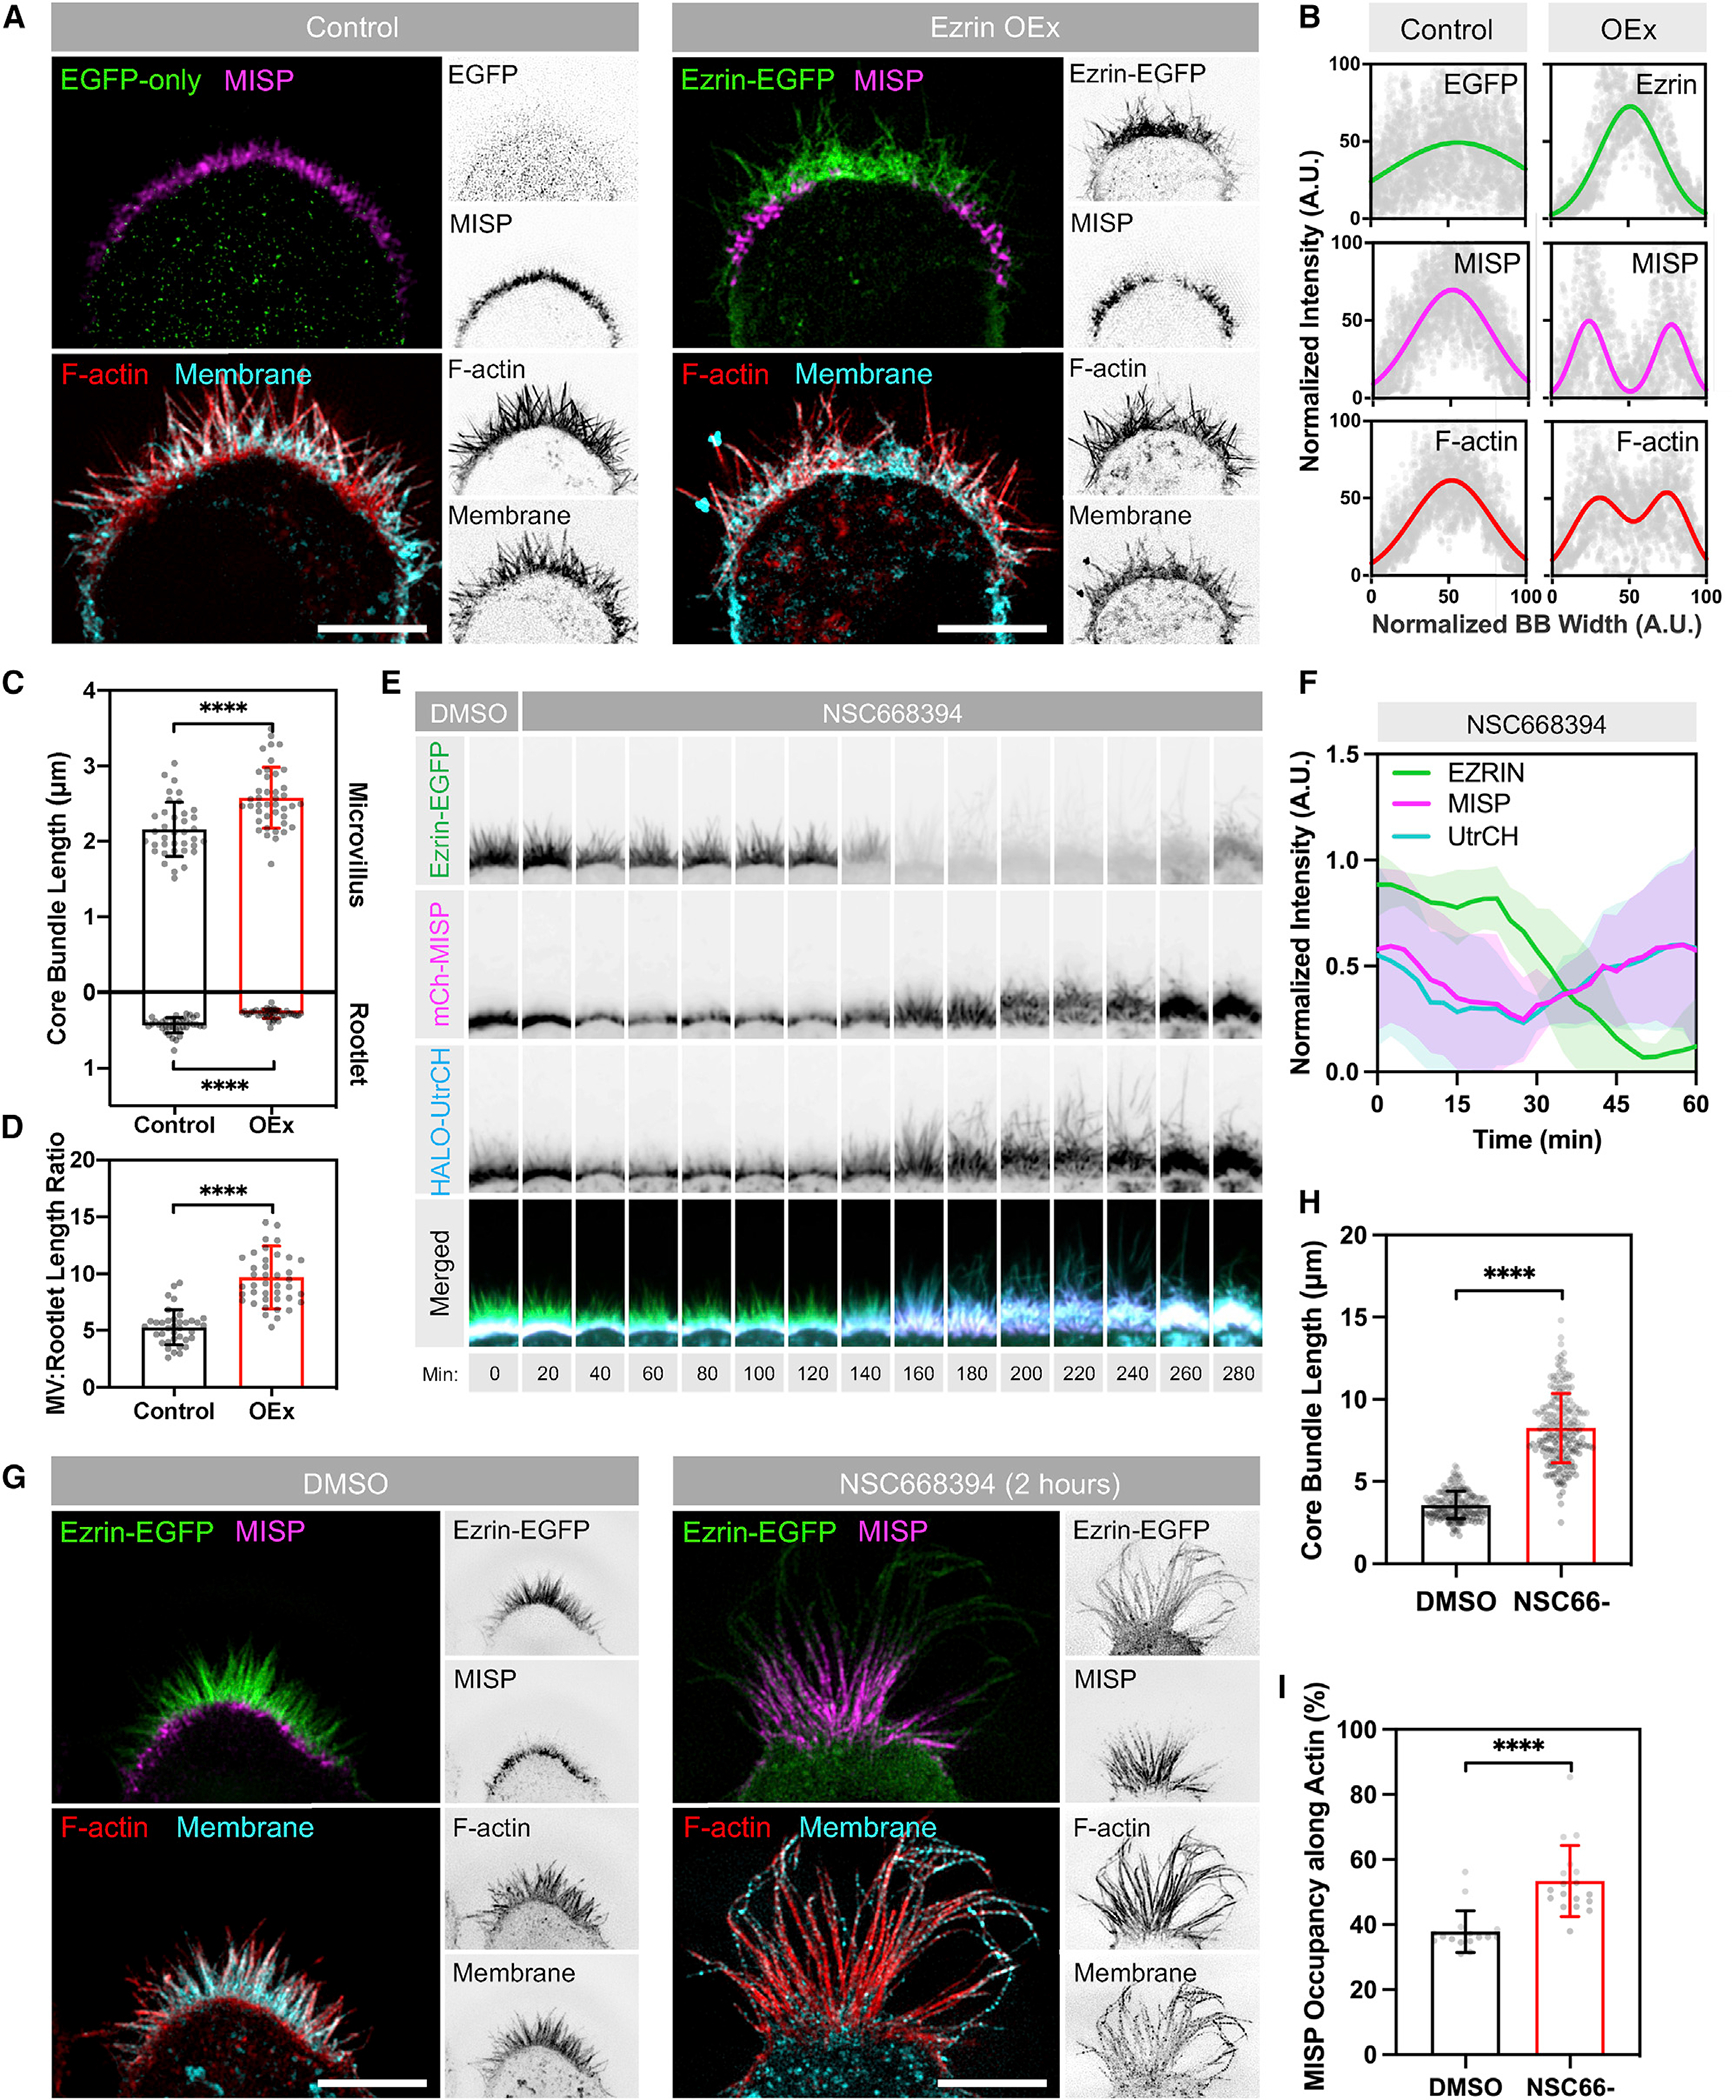
Microvilli are conserved actin-based surface protrusions that have been repurposed throughout evolution to fulfill diverse cell functions. In the case of transporting epithelia, microvilli are supported by a core of actin filaments bundled in parallel by villin, fimbrin, and espin. Remarkably, microvilli biogenesis persists in mice lacking all three of these factors, suggesting the existence of unknown bundlers. We identified Mitotic Spindle Positioning (MISP) as an actin-binding factor that localizes specifically to the rootlet end of the microvillus. MISP promotes rootlet elongation in cells, and purified MISP exhibits potent filament bundling activity in vitro. MISP-bundled filaments also recruit fimbrin, which further elongates and stabilizes bundles. MISP confinement to the rootlet is enforced by ezrin, which prevents decoration of the membrane-wrapped distal end of the core bundle. These discoveries reveal how epithelial cells optimize apical membrane surface area and offer insight on the remarkable robustness of microvilli biogenesis.

Keywords: CP: Cell biology; brush border; cytoskeleton; ezrin; fimbrin; membrane; protrusion; rootlet.


Conflict of interest statement

Declaration of interests The authors declare no competing interests.

Figures

Figure 1.
Figure 1.. MISP localizes to microvillar rootlets
(A) Confocal images of small intestinal sections stained for MISP (green), villin (magenta), DNA with DRAQ5 (yellow), and membrane with WGA (cyan). Panel shows a split three-color merge. Scale bar: 15 μm. (B) Fluorescence intensity distributions of MISP, villin, and apical membrane measured parallel to the microvillar axis as indicated by the white arrow in (A); n = 200 line scans measured on five villi. (C) Inverted MISP and villin channels from (A). Scale bar: 15 μm. (D) Fluorescence intensity distribution of MISP and villin measured relative to the crypt-villus axis as indicated by the highlighted area in (C); black arrow shows line scan orientation; n = 11 scans of six villi. (E) Confocal maximum intensity projection (Max IP) of CACO-2BBE cells at different stages of differentiation stained for MISP (green) and F-actin with phalloidin (magenta). Upper panels show xy en face views at the indicated days post-confluency (DPC); bottom panels show resliced xz views. Scale bar: 3 μm. (F) Western blot time series of CACO-2BBE cell lysates probed for MISP, villin, β-actin, and GAPDH at the indicated DPC. (G) Density values of MISP, villin, and β-actin bands from F normalized to GAPDH and plotted as a function of DPC. (H) SIM Max IP of a W4 cell stained for MISP (green), F-actin with phalloidin (magenta), and membrane with WGA (cyan). Panel shows a split two-color merge. Scale bar: 3 μm. (I) Fluorescence intensity distributions of MISP, F-actin, and apical membrane from line scans measured parallel to the microvillar axis as indicated by the white arrow in (H); n = 58 line scans of single core bundles from 10 cells. All plots in (B), (D), and (I) show Gaussian curve fits of the raw data for each channel.
Figure 2.
Figure 2.. MISP is required for maintaining rootlets
(A) Confocal Max IPs of scramble control and MISP knockdown (KD) W4 cells stained for F-actin; intensity color-coded so warmer colors denote higher intensities. Zooms show representative cells for each condition. Scale bar: 100 μm. (B) Percentage of W4 cells forming BBs (BB-positive cells) from (A) comparing scramble control, MISP KD, and EGFP-MISP rescue conditions. Each dot represents the percentage of BB-positive cells in a single field of 620 μm2; n ≥ 10 fields per condition. (C) F-actin intensity values of W4 cells from (A). Each dot represents the average F-actin intensity of a single cell; n > 600 cells per condition. (D) SIM Max IPs of the BB of W4 cells in scramble control (top) and MISP KD (bottom) conditions stained for F-actin (magenta) and membrane (cyan); each panel shows the merge with their inverted single channels. Yellow brackets indicate the extension of actin rootlets; gray brackets show the extension of microvilli. Scale bars = 2 μm. (E) Lengths of microvilli (gray, top plot) and rootlets (yellow, bottom plot) from scramble control and KD cells. Each dot represents the average of >10 length values per cell; n ≥ 40 cells per condition. All data represent three independent experiments. (F) Microvillus/rootlet length ratios measured on a per-cell basis from (E). (G) SIM Max IPs of the BB of W4 cells in control (top) and MISP-overexpressing (bottom) cells stained for F-actin (magenta) and membrane (cyan); each panel shows the merge with their inverted single channels. Yellow brackets indicate the extension of actin rootlets; gray brackets show the extension of microvilli. Scale bars = 2 μm. (H) Lengths of microvilli (gray, top) and rootlets (yellow, bottom) from control and MISP OEx cells. Each dot represents the average of >10 length values per cell; n ≥ 40 cells per condition. All data represent three independent experiments. (I) Microvillus/rootlet length ratios measured on a per-cell basis from (H). All bar plots and error bars denote mean ± SD. p values were calculated using the unpaired t test (*p < 0.05; **p < 0.01; ****p < 0.0001).
Figure 3.
Figure 3.. Purified MISP assembles tightly packed linear actin bundles in vitro
(A) Low-speed sedimentation assay of phalloidin-stabilized F-actin (5 μM) and increasing concentrations of MBP-MISP (0–5 μM). Coomassie-stained SDS-PAGE shows the supernatant and pellet fractions recovered after centrifugation. (B) Density quantification of bands shown in (A). All data represent three independent experiments. Error bars denote mean ± SD. (C) High-speed sedimentation assay of MBP-MISP (0.5 mM) and increasing concentrations of non-stabilized F-actin (0–10 μM). Coomassie-stained SDS-PAGE shows the supernatant and pellet fractions recovered after centrifugation. (D) Density quantification of bands shown in (C). All data represent three independent experiments that were fit using a hyperbolic saturation binding model yielding a KD = 0.76 μM. Error bars denote mean ± SD. (E) Confocal images of phalloidin-stabilized F-actin (0.5 μM; magenta) alone or pre-mixed with MBP-EGFP-MISP (0.1 μM; green). Zooms correspond to the yellow boxes shown in merge; single channels are shown as inverted images. Red arrowheads indicate the end of MISP-bundled F-actin. Scale bar: 10 μm. (F) Fluorescence intensities of F-actin in buffer alone or with MISP from (E). Each dot represents the integrated intensity value of a 250-μm2 field; n ≥ 39. Bar plots and error bars denote mean ± SD. p values were calculated using the unpaired t test (****p < 0.0001). (G) Line scan analysis of EGFP-MISP (green) and F-actin (magenta) intensities measured at bundles ends shown in (E). Data are shown as mean ± SD. (H) Transmission electron microscopy images of negatively stained phalloidin-stabilized F-actin (0.2 μM) in buffer alone or pre-mixed with purified MISP (0.04 μM). Scale bar: 400 nm. (I) Histogram of inter-filament spacing measurements from bundles shown in (H). Each dot represents the average of ≥ 110 values; bin size = 2. Average values were fit using a Gaussian curve.
Figure 4.
Figure 4.. MISP recruits fimbrin to actin bundles
(A) SIM Max IPs of HeLa cells overexpressing mCherry-MISP (top panel), EGFP-fimbrin (middle panel), and mCherry-MISP and EGFP-fimbrin (bottom panel). All cells were stained for F-actin with phalloidin (magenta). Each panel shows the merge with their zooms as inverted single channels. Scale bars: 5 μm. (B) Colocalization analysis of mCherry-MISP and EGFP-fimbrin intensities along actin bundles shown in the red box in (A); data were fit using linear regression.
Figure 5.
Figure 5.. MISP and fimbrin cooperate to elongate rootlets
(A) SIM Max IPs of W4 cells non-transfected (control) and overexpressing HALO-MISP (MISP OEx), EGFP-fimbrin (Fimbrin OEx), or HALO-MISP and EGFP-fimbrin together (M/F OEx). All cells were stained for F-actin with phalloidin (red) and membrane with WGA (cyan). Each panel shows merges on top with inverted single channels along the bottom. Scale bars: 5 μm. (B) Lengths of microvilli (“Microvillus Length,” top plot) versus distance that rootlets extend into the cytoplasm (“Rootlet Reach,” bottom plot) in W4 cells expressing the constructs described in (A). Each dot represents the average of >10 length values per cell; n ≥ 34 cells per condition. All data represent three independent experiments. Bar plots and error bars are mean ± SD. p values were calculated using the unpaired t test (*p < 0.05; ****p < 0.0001; ns, not significant.). (C and D) Photobleaching analysis of W4 cells expressing HALO-β-actin alone (C) or HALO-β-actin with EGFP-fimbrin and mCherry-MISP (D). Although a single ROI was positioned on the BB and bleached in both conditions, the ROI in (D) was subdivided into two sub-ROIs to quantify differences in the recovery of the apical microvilli (magenta box) versus subapical rootlets (cyan box). Scale bar: 5 μm. (E) Fluorescence intensity recovery of HALO-β-actin from the color-coded ROIs described in (C) and (D); n > 14 cells per condition. All intensity values for each condition are shown as mean ± SD. Average values for each condition were fit using two-phase association curves. (F) Time-series montages of W4 cells expressing HALO-β-actin, EGFP-fimbrin, and mCherry-MISP after adding doxycycline to induce BB assembly. Cyan arrowheads denote initiation of terminal web actin network assembly. Magenta arrowheads denote microvilli assembly. Scale bar: 10 μm. (G) Fluorescence intensity of HALO-β-actin during BB assembly from microvilli and terminal web actin network in (F); n = 10 cells. Data are shown as mean ± SD.
Figure 6.
Figure 6.. MISP and ezrin exhibit mutually exclusive targeting at opposite ends of core actin bundles
(A) SIM Max IPs of W4 cells overexpressing EGFP alone (green, left panel) or ezrin-EGFP (green, right panel) and stained for endogenous MISP (magenta), F-actin with phalloidin (red), and membrane with WGA (cyan). Each panel shows two-color merges with their inverted single channels. Scale bar: 5 μm. (B) Intensity distributions across the BB from left to right, measured for each marker described in (A). Distributions were fit using single- or double-Gaussian curves. Number of cells per condition was ≥8. (C) Lengths of microvilli (top plot) and rootlets (bottom plot) from W4 cells shown in (A). Each dot represents the average of >10 length values per cell; n ≥ 37. All data represent three independent experiments. (D) Microvillus/rootlet length ratios measured on a per-cell basis from (C). (E) Confocal Max IP time-series montages of a W4 cell expressing ezrin-EGFP (green), mCherry-MISP (magenta), and HALO-UtrCH (blue) before and after adding NSC668394 (ezrin inhibitor). The width of each box in the montage is 7 μm. (F) Fluorescence intensity values of markers described in (E). Data are shown as mean ± SD. (G) SIM Max IPs of W4 cells expressing ezrin-EGFP in DMSO (left panel) or NSC668394 (right panel) conditions after 2 h of exposure. Cells were stained for endogenous MISP (magenta), F-actin with phalloidin (red), and membrane with WGA (cyan). Each panel shows two-color merges with their inverted single channels. Scale bar: 5 μm. (H) Lengths of core bundles from conditions described in (G). Each dot represents the length of a single core bundle; n > 190 length values. (I) Percentages of MISP occupancy along core bundles from the conditions in (G). Each dot represents the percentage of the average MISP coverage along core bundles per cell; n > 16 cells per condition; length values per cell >10. All bar plots and error bars denote mean ± SD. p values were calculated using the unpaired t test (****p < 0.0001).

References

    1. Atilgan E, Wirtz D, and Sun SX (2006). Mechanics and dynamics of actin-driven thin membrane protrusions. Biophys. J. 90, 65–76. - PMC - PubMed
    1. Baas AF, Kuipers J, van der Wel NN, Batlle E, Koerten HK, Peters PJ, and Clevers HC (2004). Complete polarization of single intestinal epithelial cells upon activation of LKB1 by STRAD. Cell 116, 457–466. - PubMed
    1. Bao J, Bielski E, Bachhawat A, Taha D, Gunther LK, Thirumurugan K, Kitajiri S, and Sakamoto T (2013). R1 motif is the major actin-binding domain of TRIOBP-4. Biochemistry 52, 5256–5264. - PubMed
    1. Bartles JR, Zheng L, Li A, Wierda A, and Chen B (1998). Small espin: a third actin-bundling protein and potential forked protein ortholog in brush border microvilli. J. Cell Biol. 143, 107–119. - PMC - PubMed
    1. Belyy A, Merino F, Sitsel O, and Raunser S (2020). Structure of the Lifeact–F-actin complex. PLoS Biol. 18, e3000925. - PMC - PubMed

Publication types

LinkOut - more resources