. 2022 Apr 19;39(3):110716.
doi: 10.1016/j.celrep.2022.110716.

Inhibitory co-transmission from midbrain dopamine neurons relies on presynaptic GABA uptake

Affiliations

Inhibitory co-transmission from midbrain dopamine neurons relies on presynaptic GABA uptake

Riccardo Melani et al. Cell Rep. .

Abstract

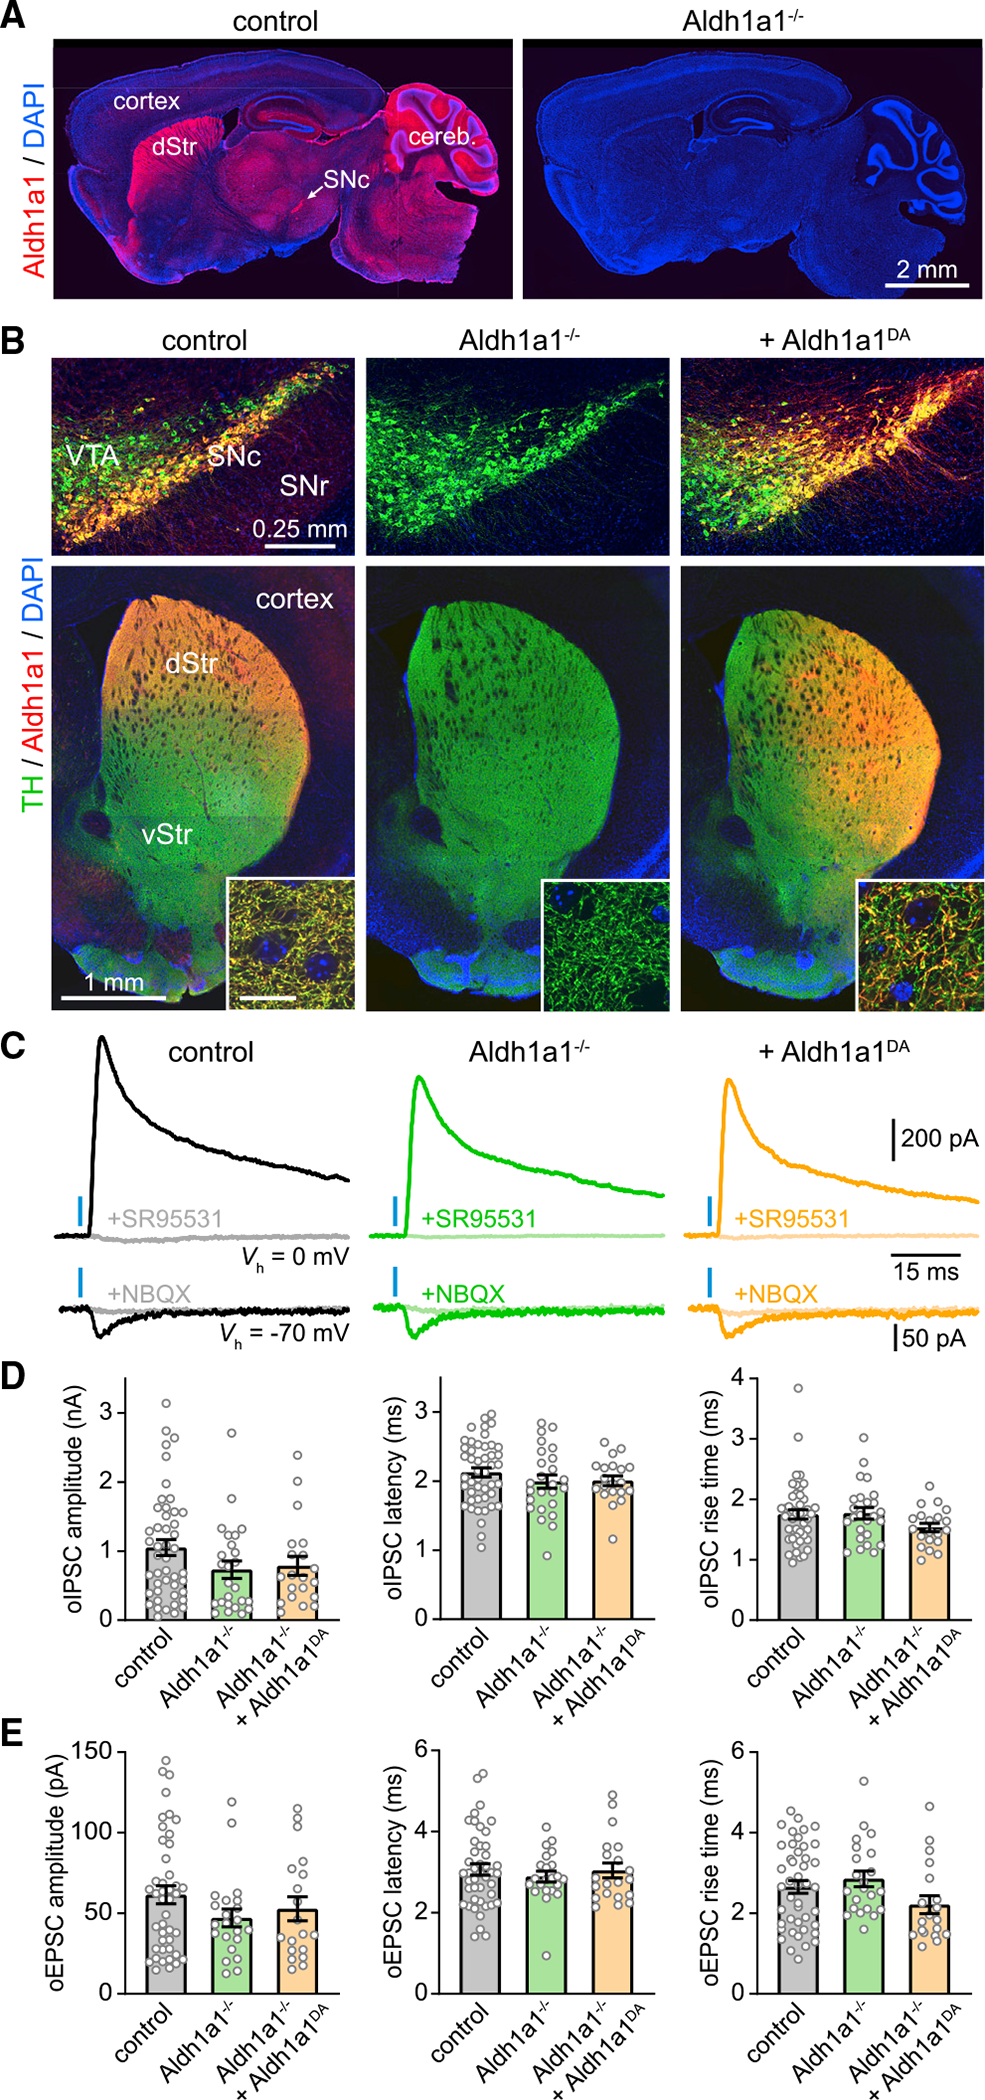
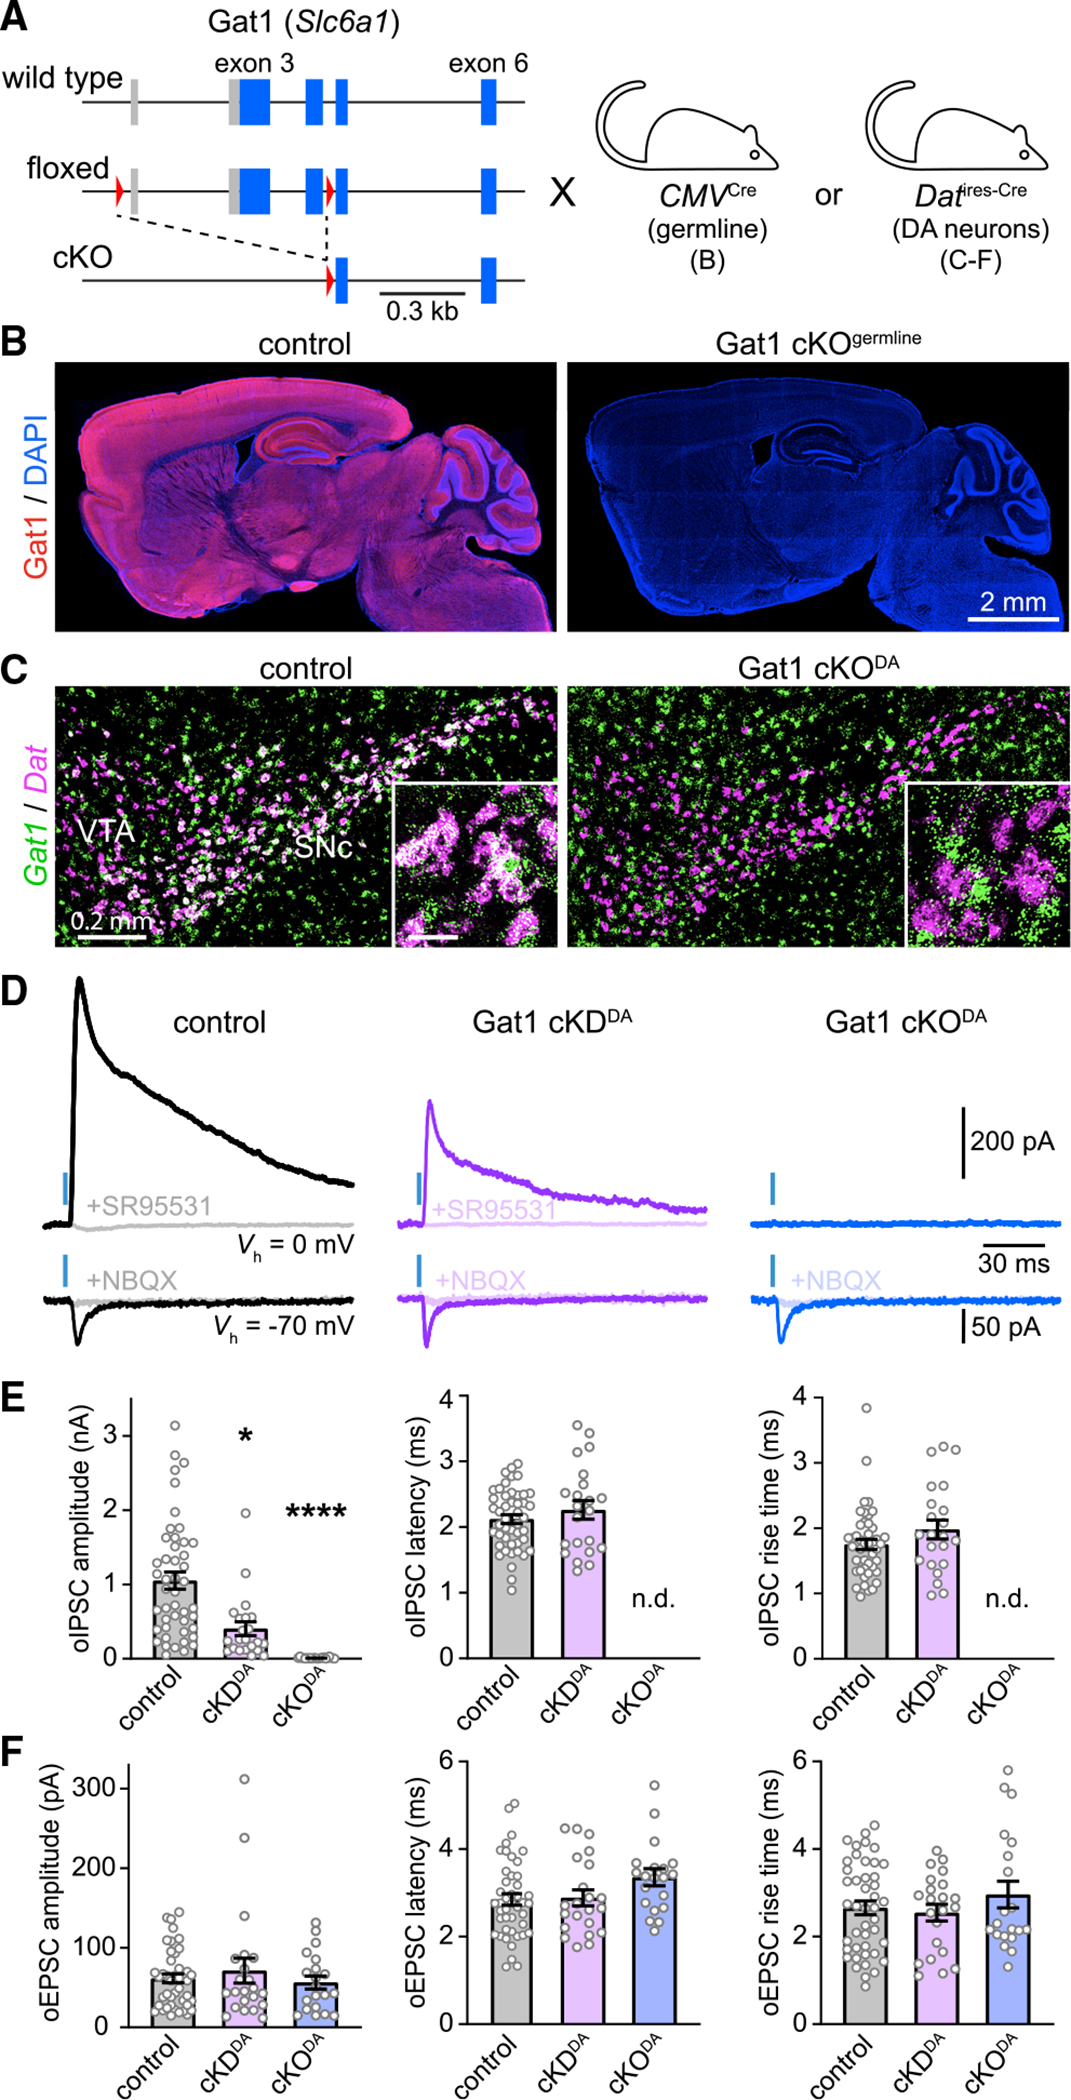
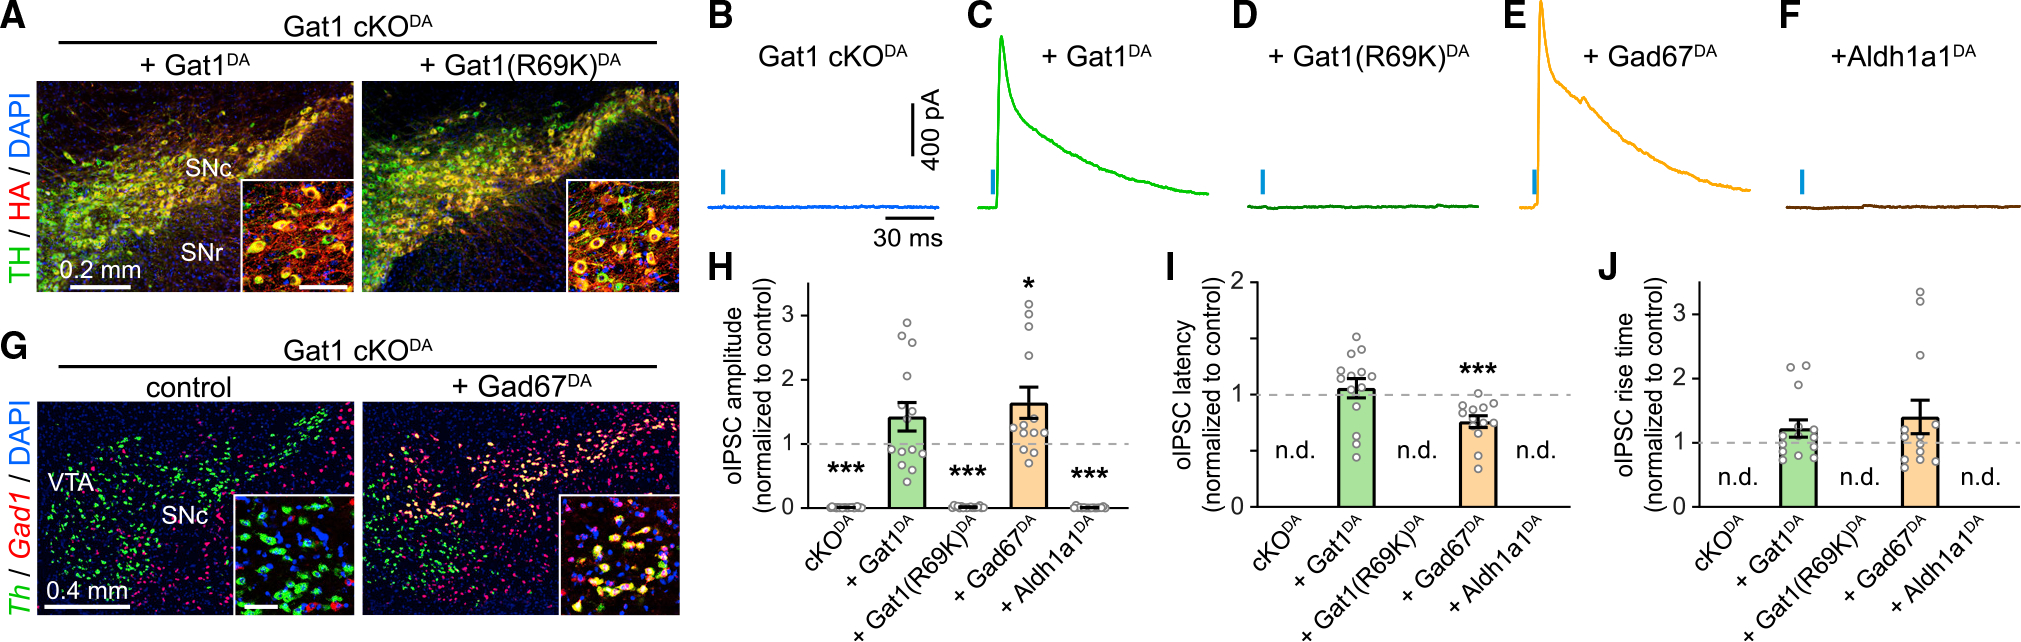
Dopamine (DA)-releasing neurons in the substantia nigra pars compacta (SNcDA) inhibit target cells in the striatum through postsynaptic activation of γ-aminobutyric acid (GABA) receptors. However, the molecular mechanisms responsible for GABAergic signaling remain unclear, as SNcDA neurons lack enzymes typically required to produce GABA or package it into synaptic vesicles. Here, we show that aldehyde dehydrogenase 1a1 (Aldh1a1), an enzyme proposed to function as a GABA synthetic enzyme in SNcDA neurons, does not produce GABA for synaptic transmission. Instead, we demonstrate that SNcDA axons obtain GABA exclusively through presynaptic uptake using the membrane GABA transporter Gat1 (encoded by Slc6a1). GABA is then packaged for vesicular release using the vesicular monoamine transporter Vmat2. Our data therefore show that presynaptic transmitter recycling can substitute for de novo GABA synthesis and that Vmat2 contributes to vesicular GABA transport, expanding the range of molecular mechanisms available to neurons to support inhibitory synaptic communication.

Keywords: Aldh1a1; CP; GABA; Gat1; Neuroscience; SLC18A2; Slc6a1; VMAT2; basal ganglia; dopamine; striatum; synaptic transmission.


Conflict of interest statement

Declaration of interests The authors declare no competing interests.

Figures

Figure 1.
Figure 1.. Aldh1a1 does not contribute to GABA co-release from DA neurons
(A) Sagittal sections from control (left) and Aldh1a1−/− (right) mice immunolabeled for Aldh1a1 (red) and DAPI nuclear stain (blue). dStr, dorsal striatum; Cereb, cerebellum. (B) Coronal brain sections from a control DatIRES-Cre/+ mouse (left), a DatIRES-Cre/+;Aldh1a1−/− mouse (middle), and a DatIRES-Cre/+;Aldh1a1−/− mouse in which Aldh1a1 is selectively restored in DA neurons (right) immunolabeled for TH (green), Aldh1a1 (red), and DAPI (blue). Top: confocal image of SNc, ventral tegmental area (VTA), and substantia nigra pars reticulata (SNr). Bottom: epifluorescence image of striatum. vStr, ventral striatum. Inset: confocal detail in dorsal striatum (scale, 10 μm). (C) Postsynaptic responses recorded from SPNs voltage-clamped (Vh) at 0 (top) or −70 mV (bottom) upon stimulation of SNcDA axons (blue bar) before and after application of the GABAAR antagonist SR95531 (10 μM) or the ionotropic glutamate receptor blockers NBQX (10 μM). (D) Mean amplitude (left), synaptic latency (middle), and 10% to 90% rise time (right) of oIPSCs recorded from SPNs in slices from control (n = 46), Aldh1a1−/− (n = 25), and Aldh1a1−/− mice expressing Aldh1a1 in SNcDA neurons (n = 20; amplitude: p = 0.16; latency: p = 0.41; rise time: p = 0.17; Kruskal-Wallis). Individual values shown along with population mean ± SEM. (E) Same as (D) for oEPSCs (amplitude: p = 0.338; latency: p = 0.94; rise time: p = 0.07; Kruskal-Wallis).
Figure 2.
Figure 2.. GABAergic co-transmission from SNcDA neurons is abolished in Gat1 cKODA mice
(A) Schematic of Gat1 locus (top), floxed allele before (middle) and after (bottom) Cre-mediated excision in CMVCre or DatIRES-Cre mice. Boxes: exons with protein-coding regions in blue; red triangles: LoxP sites. (B) Sagittal brain sections from control (left) and Gat1 cKOgermline mice (right) immunolabeled for Gat1 (red) and DAPI (blue). (C) Fluorescence in situ hybridization for Gat1 (green) and Dat (magenta; labels DA neurons) in coronal brain sections from control (DatIRES-Cre/+;Gat1+/+; left) and Gat1 cKODA (DatIRES-Cre/+;Gat1fl/fl; right) mice. Colocalization appears white. Inset: detail (scale, 50 μm). (D) Example oIPSCs (top) and oEPSCs (bottom) in SPNs held at 0 and −70 mV, respectively, in DatIRES-Cre/+ mice with no (control; black), one (cKDDA; purple), or both (cKODA; blue) alleles of Gat1 conditionally deleted from SNcDA neurons before and after application of SR95531 (10 μM) or NBQX (10 μM). (E) Meanamplitude(left), synaptic latency (middle), and 10% to 90% rise time (right) of oIPSCs recorded from SPNs in control (n = 46), cKDDA (n = 22), and cKODA (n = 22) slices (amplitude: p = 2.94 × 10⁻¹³; Kruskal-Wallis; *p = 0.012, ***p = 1.01 × 10⁻¹³ versus control, Dunn’s multiple comparison; latency: p = 0.65; rise time: p = 0.18 between control and Gat1 cKDDA; Mann-Whitney). nd, not detected. Individual values shown along with population mean ± SEM. (F) Same as (E) for oEPSCs (amplitude: p = 0.85; latency: p = 0.18; rise time: p = 0.76; Kruskal-Wallis).
Figure 3.
Figure 3.. GABA co-release from SNcDA axons requires Gat1-mediated GABA uptake
(A) Confocal images of SNc in Gat1 cKODA mice expressing Cre-dependent HA-tagged Gat1 (left) and Gat1(R69K) (right) immunolabeled for TH (green), HA (red), and DAPI (blue). Inset: detailed view (scale, 50 μm). (B–F) oIPSCs recorded from SPNs (Vh = 0 mV) upon stimulation of SNcDA axons (blue bar) in Gat1 cKODA mice (B) exogenously expressing Gat1 (C), Gat1(R69K) (D), Gad67 (E), or Aldh1a1 (F). (G) Fluorescence in situ hybridization for Gad67 (red) and TH (green) in Gat1 cKODA mice with (right) or without (left) Gad67 in DA neurons. Inset: detail (scale, 50 μm). (H) oIPSC amplitude in SPNs of Gat1 cKODA mice virally expressing ChR2 in SNcDA neurons (n = 22, p = 1 × 10⁻¹⁵), or ChR2 + Gat1 (n = 14; p = 0.07), ChR2 + Gat1(R69K) (n = 18; p = 1 × 10⁻¹⁵), ChR2 + Gad67 (n = 13; p = 0.018), or ChR2 + Aldh1a1 (n = 17; p = 2 × 10⁻¹⁵) normalized to control. All p values versus control, Mann-Whitney. nd, not detected. Individual values shown along with population mean ± SEM. (I) Same as (H) for latency (Gat1DA: p = 0.32; Gad67DA: p = 0.0007 versus control, Mann-Whitney). (J) Same as (I) for rise time (Gat1DA: p = 0.18; Gad67DA: p = 0.39 versus control, Mann-Whitney).
Figure 4.
Figure 4.. Vmat2 is required for vesicular transport of GABA
(A) Strategy to generate mice in which the expression of ChR2 and Vmat2 in DA neurons is controlled genetically. cKDDA mice have one allele of Vmat2 conditionally deleted. (B) Example oIPSCs (top) and oEPSCs (bottom) recorded from SPNs at 0 and −70 mV, respectively, in DatIRES-Cre/+;Rosa26Ai32/−;Vmat2+/+ (control; black) and in DatIRES-Cre/+: Rosa26Ai32/−; Vmat2fl/+ (Vmat2 cKDDA; red) mice before and after bath application of SR95531 (10 μM) or NBQX (10 μM). (C) Mean amplitude of oIPSCs (left) and oEPSCs (right) recorded from SPNs in control (n = 29) Vmat2 cKDDA (n = 18) mice (p = 0.008, Mann-Whitney). Individual values shown along with population mean ± SEM. (D) Strategy to conditionally knock out Vmat2 from SNcDA neurons unilaterally in the adult nervous system. (E) Confocal image of SNc in a DatIRES-Flpo/+;Vmat2fl/fl mouse transduced with AAVs encoding Flp-dependent Cre and immunolabeled for TH (green) and Cre (red) showing specific expression of Cre in SNcDA neurons. (F) Example oIPSCs (top) and oEPSCs (bottom) recorded from SPNs in DatIRES-Flpo/+;Vmat2+/+ (black) and Vmat2 cKODA (purple) mice before and after application of SR95531 (10 μM) or NBQX (10 μM). (G) Same as (C) for control (n = 6) and Vmat2 cKODA (n = 7) SPNs (oIPSCs: p = 0.0012; oEPSCs: p = 0.53, Mann-Whitney). (H) oIPSCs recorded from SPNs upon stimulation of Gad67-expressing SNcDA axons (blue bar) in Gat1 cKODA mice with (red) or without (yellow) reserpine. (I) Amplitude of oIPSCs in Gat1 cKODA mice expressing Gad67 in SNcDA neurons without (n = 13) or with reserpine (n = 9; p = 4.02 × 10⁻⁶, Mann-Whitney). Individual values shown along with population mean ± SEM.

References

    1. Adam SA, Schnell O, Pöschl J, Eigenbrod S, Kretzschmar HA, Tonn J-C, and Schüller U (2012). ALDH1A1 is a marker of astrocytic differentiation during brain development and correlates with better survival in glioblastoma patients. Brain Pathol. 22, 788–797. - PMC - PubMed
    1. Anderson DW, Schray RC, Duester G, and Schneider JS (2011). Functional significance of aldehyde dehydrogenase ALDH1A1 to the nigrostriatal dopamine system. Brain Res. 1408, 81–87. - PMC - PubMed
    1. Asada H, Kawamura Y, Maruyama K, Kume H, Ding R, Ji FY, Kanbara N, Kuzume H, Sanbo M, Yagi T, et al. (1996). Mice lacking the 65 kDa isoform of glutamic acid decarboxylase (GAD65) maintain normal levels of GAD67 and GABA in their brains but are susceptible to seizures. Biochem. Biophys. Res. Commun. 229, 891–895. - PubMed
    1. Asada H, Kawamura Y, Maruyama K, Kume H, Ding RG, Kanbara N, Kuzume H, Sanbo M, Yagi T, and Obata K (1997). Cleft palate and decreased brain gamma-aminobutyric acid in mice lacking the 67-kDa isoform of glutamic acid decarboxylase. Proc. Natl. Acad. Sci. U S A 94, 6496–6499. - PMC - PubMed
    1. Bäckman CM, Malik N, Zhang Y, Shan L, Grinberg A, Hoffer BJ, Westphal H, and Tomac AC (2006). Characterization of a mouse strain expressing Cre recombinase from the 3’ untranslated region of the dopamine transporter locus. Genesis 44, 383–390. - PubMed

Publication types