

Identification of a pyroptosis-related prognostic signature in breast cancer
- PMID: 35443644
- PMCID: PMC9019977
- DOI: 10.1186/s12885-022-09526-z
Identification of a pyroptosis-related prognostic signature in breast cancer
Abstract
Background: The relationship between pyroptosis and cancer is complex. It is controversial that whether pyroptosis represses or promotes tumor development. This study aimed to explore prognostic molecular characteristics to predict the prognosis of breast cancer (BRCA) based on a comprehensive analysis of pyroptosis-related gene expression data.
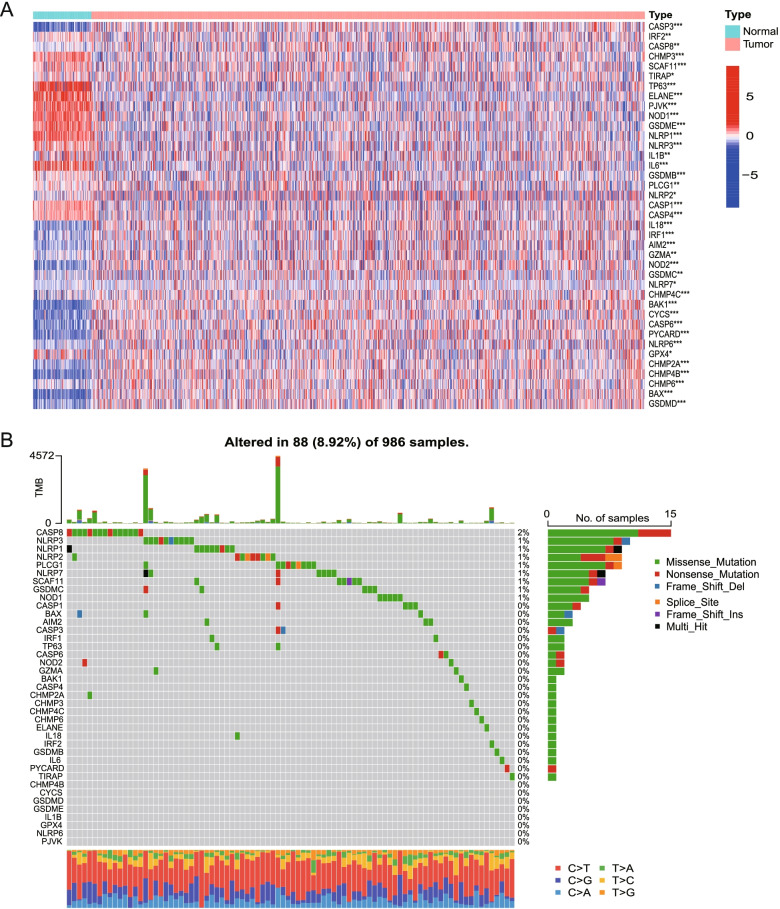
Methods: RNA-sequcing data of BRCA were collected from The Cancer Genome Atlas (TCGA) and Gene Expression Ominibus (GEO) datasets. First, pyroptosis-related differentially expressed genes (DEGs) between normal and tumor tissues were identified from the TCGA database. Based on the DEGs, 1053 BRCA patients were divided into two clusters. Second, DEGs between the two clusters were used to construct a signature by a least absolute shrinkage and selection operator (LASSO) Cox regression model, and the GEO cohort was used to validate the signature. Various statistical methods were applied to assess this gene signature. Finally, Single-sample gene set enrichment analysis (ssGSEA) was employed to compare the enrichment scores of 16 types of immune cells and 13 immune-related pathways between the low- and high-risk groups. We calculated the tumor mutational burden (TMB) of TCGA cohort and evaluated the correlations between the TMB and riskscores of the TCGA cohort. We also compared the TMB between the low- and high-risk groups.
Results: A total of 39 pyroptosis-related DEGs were identified from the TCGA-breast cancer dataset. A prognostic signature comprising 16 genes in the two clusters of DEGs was developed to divide patients into high-risk and low-risk groups, and its prognostic performance was excellent in two independent patient cohorts. The high-risk group generally had lower levels of immune cell infiltration and lower activity of immune pathway activity than did the low-risk group, and different risk groups revealed different proportions of immune subtypes. The TMB is higher in high-risk group compared with low-risk group. OS of low-TMB group is better than that of high-TMB group.
Conclusion: A 16-gene signature comprising pyroptosis-related genes was constructed to assess the prognosis of breast cancer patients and its prognostic performance was excellent in two independent patient cohorts. The signature was found closely associated with the tumor immune microenvironment and the potential correlation could provide some clues for further studies. The signature was also correlated with TMB and the mechanisms are still warranted.
Keywords: Breast Cancer; Prognosis; Pyroptosis; Tumor immune microenvironment; Tumor mutational burden.
© 2022. The Author(s).
Conflict of interest statement
The authors declare that they have no competing interests.
Figures


Similar articles
-
A pyroptosis-related gene signature predicting survival and tumor immune microenvironment in breast cancer and validation.BMC Cancer. 2022 Sep 22;22(1):1005. doi: 10.1186/s12885-022-09856-y. BMC Cancer. 2022. PMID: 36138348 Free PMC article.
-
Construction and Validation of a Novel Pyroptosis-Related Four-lncRNA Prognostic Signature Related to Gastric Cancer and Immune Infiltration.Front Immunol. 2022 Mar 22;13:854785. doi: 10.3389/fimmu.2022.854785. eCollection 2022. Front Immunol. 2022. PMID: 35392086 Free PMC article.
-
A novel pyroptosis-related gene signature predicts the prognosis of glioma through immune infiltration.BMC Cancer. 2021 Dec 7;21(1):1311. doi: 10.1186/s12885-021-09046-2. BMC Cancer. 2021. PMID: 34876094 Free PMC article.
-
A novel necroptosis-related gene index for predicting prognosis and a cold tumor immune microenvironment in stomach adenocarcinoma.Front Immunol. 2022 Oct 27;13:968165. doi: 10.3389/fimmu.2022.968165. eCollection 2022. Front Immunol. 2022. PMID: 36389725 Free PMC article. Review.
-
The role of pyroptosis in modulating the tumor immune microenvironment.Biomark Res. 2022 Jun 23;10(1):45. doi: 10.1186/s40364-022-00391-3. Biomark Res. 2022. PMID: 35739593 Free PMC article. Review.
Cited by
-
Identification of disulfidptosis-related subtypes, characterization of tumor microenvironment infiltration, and development of a prognosis model in breast cancer.Front Immunol. 2023 Nov 15;14:1198826. doi: 10.3389/fimmu.2023.1198826. eCollection 2023. Front Immunol. 2023. PMID: 38035071 Free PMC article.
-
Pyroptosis-Related Gene Signatures Enable Robustly Diagnosis, Prognosis and Immune Responses Prediction in Uterine Corpus Endometrial Carcinoma.J Cancer. 2025 May 8;16(8):2516-2536. doi: 10.7150/jca.104826. eCollection 2025. J Cancer. 2025. PMID: 40535818 Free PMC article.
-
Comprehensive analysis of pyroptosis-related gene signatures in renal fibrosis.Clin Exp Nephrol. 2025 Jul 3. doi: 10.1007/s10157-025-02726-4. Online ahead of print. Clin Exp Nephrol. 2025. PMID: 40608262
-
Identification of differentially expressed genes at the single-cell level and prognosis prediction through bulk RNA sequencing data in breast cancer.Front Genet. 2022 Sep 16;13:979829. doi: 10.3389/fgene.2022.979829. eCollection 2022. Front Genet. 2022. PMID: 36186437 Free PMC article.
-
Developing a prognosis and chemotherapy evaluating model for colon adenocarcinoma based on mitotic catastrophe-related genes.Sci Rep. 2024 Jan 18;14(1):1655. doi: 10.1038/s41598-024-51918-7. Sci Rep. 2024. PMID: 38238555 Free PMC article.
References
-
- Poorvu PD, Gelber SI, Rosenberg SM, Ruddy KJ, Tamimi RM, Collins LC, Peppercorn J, Schapira L, Borges VF, Come SE, et al. Prognostic impact of the 21-gene recurrence score assay among young women with node-negative and node-positive ER-positive/HER2-negative breast Cancer. J Clin Oncol. 2020;38(7):725–733. doi: 10.1200/JCO.19.01959. - DOI - PMC - PubMed
MeSH terms
Substances
LinkOut - more resources
Full Text Sources
Medical
