. 2022 Apr 20;12(1):23.
doi: 10.1038/s41387-022-00202-6.

Obesity-induced elevated palmitic acid promotes inflammation and glucose metabolism disorders through GPRs/NF-κB/KLF7 pathway

Affiliations

Obesity-induced elevated palmitic acid promotes inflammation and glucose metabolism disorders through GPRs/NF-κB/KLF7 pathway

Tongtong Qiu et al. Nutr Diabetes. .

Abstract

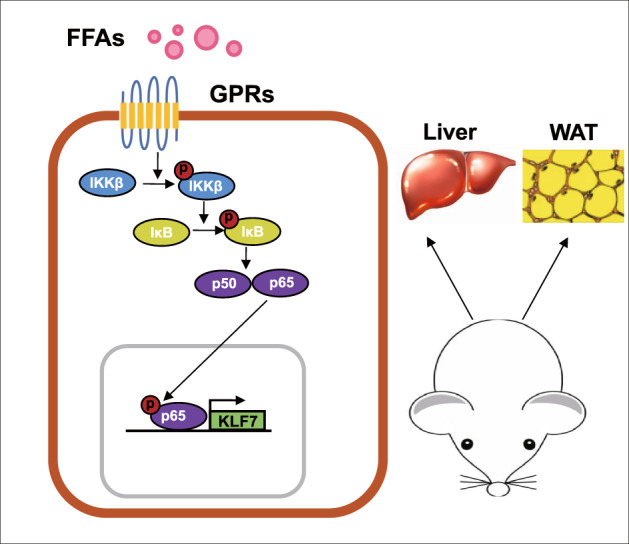
Objective: Our previous results have shown that obesity-induced excessive palmitic acid (PA) can promote the expression of KLF7, which plays a vital role in regulation of inflammation, glucose metabolism. But the exact mechanism of PA up-regulating the expression of KLF7 is not clear yet. This study is intend to explore whether PA promoting KLF7 expression through GPRs/NF-κB signaling pathway, causing inflammation and glucose metabolism disorders.

Methods: Cells were blocked GPRs/NF-κB under PA stimulation in vitro to demonstrate the molecular mechanism of PA up-regulates KLF7 expression. The regulatory effect of p65 on KLF7 was detected by luciferase reporter gene assay. Blocking GPRs/NF-κB in diet-induced obesity mice to detect the expression of KLF7, inflammatory cytokines and glucose metabolism related factors, clarifying the effects of GPRs/NF-κB on KLF7 in vivo.

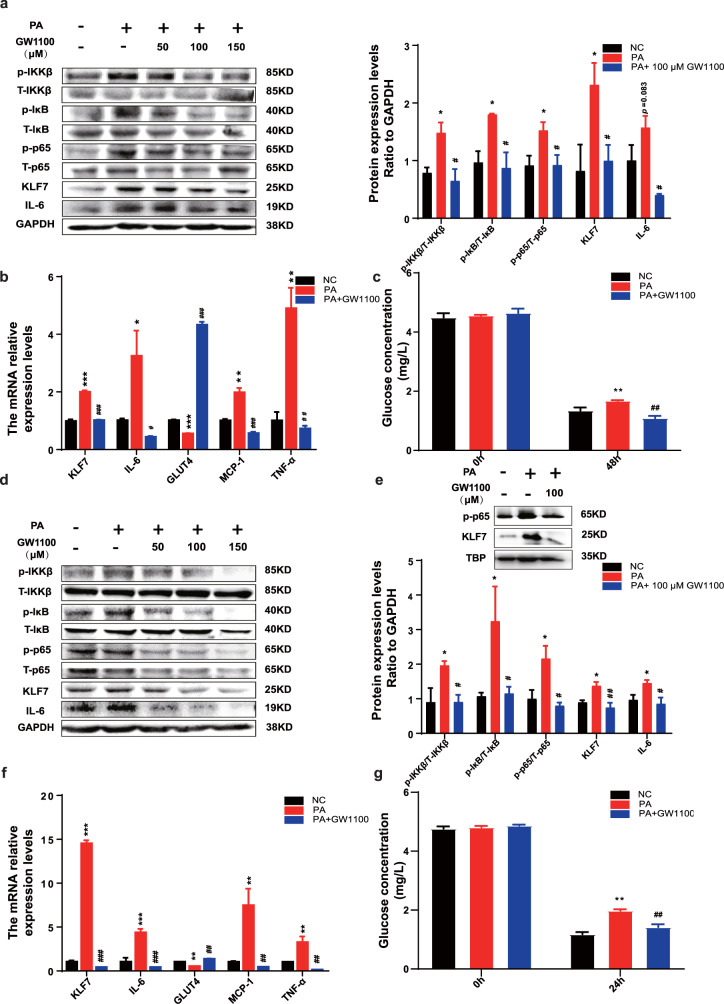
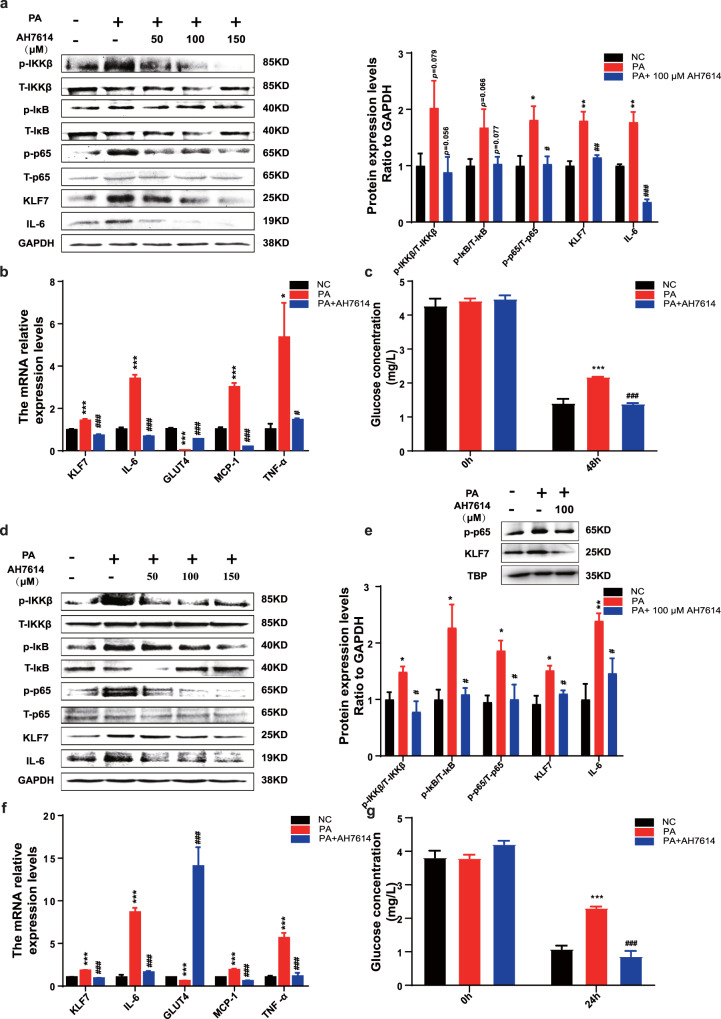
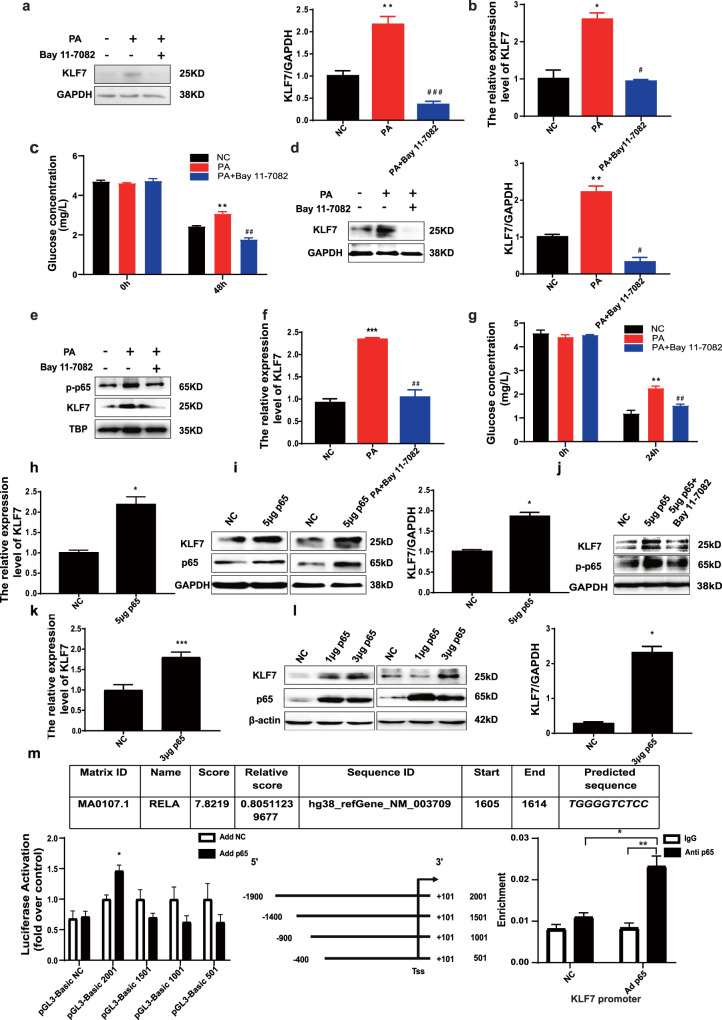
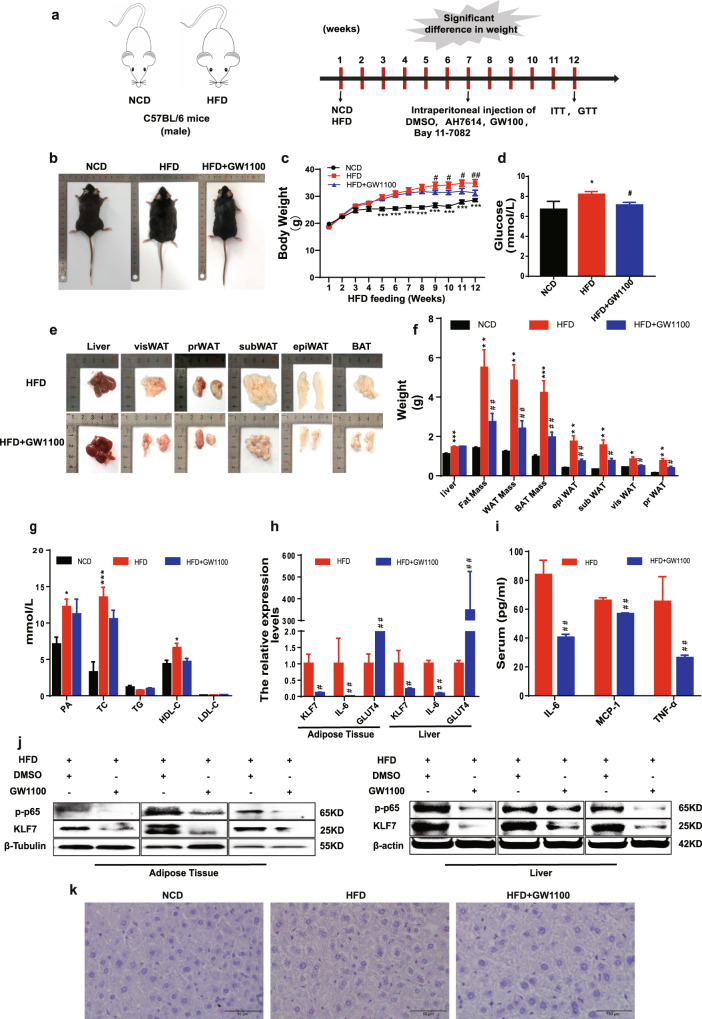
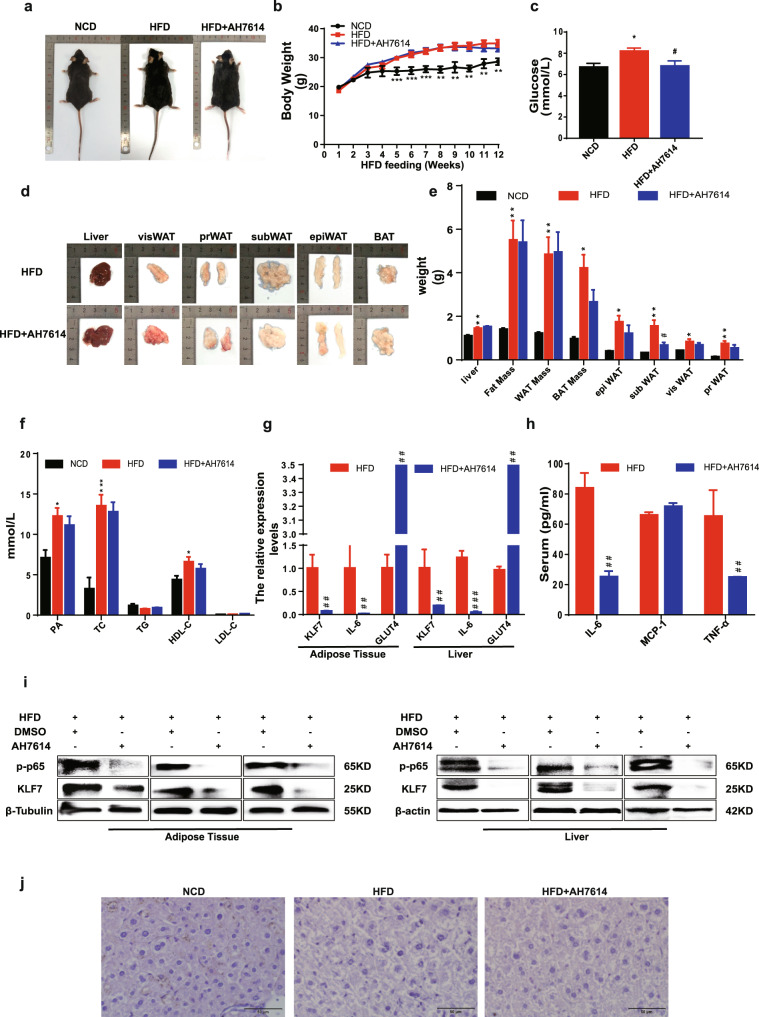
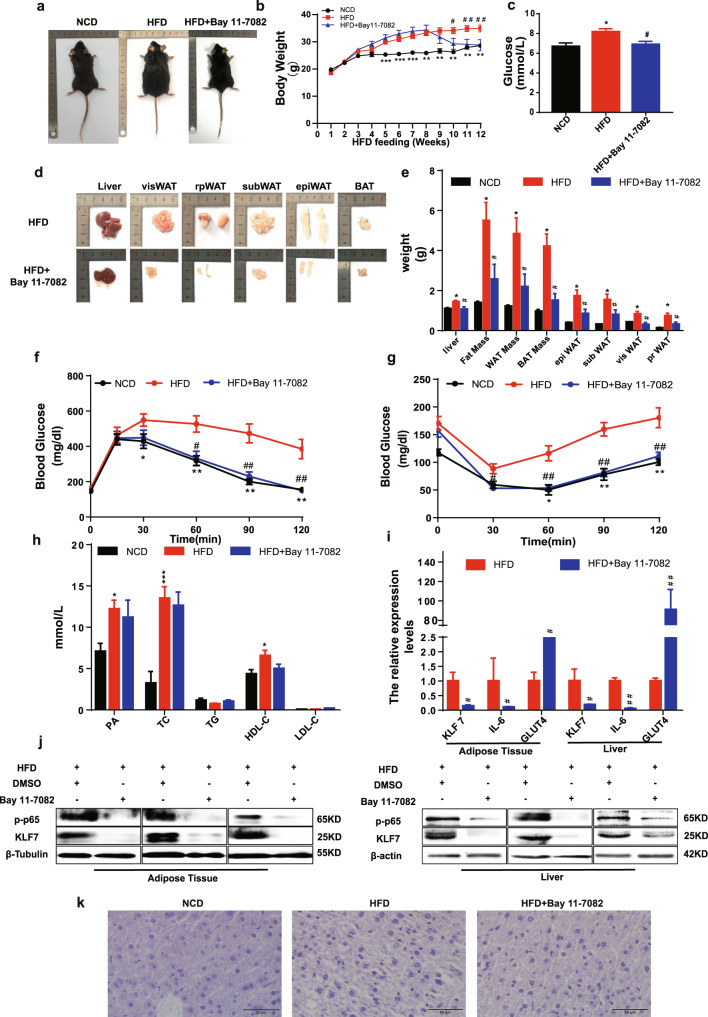
Results: In 3T3-L1 adipocytes and HepG2 cells, PA could up-regulate the expression of KLF7 by promoting the GPR40/120-NF-κB signaling pathway, leading to inflammation and reduced glucose consumption (p < 0.05 for both). Luciferase reporter gene assay and ChIP assay showed that p65 could transcriptionally up-regulates the expression of KLF7. In high-fat diet (HFD) mice, after intraperitoneal injection of GPR40 or GPR120 blocker, the levels of p-p65 and KLF7 in epididymal white adipose tissue and liver were significantly decreased (p < 0.05 for both). Pharmacological inhibition of p-p65 significantly attenuated KLF7 expression and improved glucose tolerant and insulin sensitive (p < 0.05 for both).

Conclusions: Our results indicate that obesity-induced elevated palmitic acid promotes inflammation and glucose metabolism disorders through GPRs/NF-κB/KLF7 signaling pathway.


Conflict of interest statement

The authors declare no competing interests.

Figures

Fig. 1
Fig. 1. PA regulates KLF7 through GPRs/p-p65 signaling pathway.
Add GW1100 (50, 100, 150 μM) to culture medium while stimulated by 200 μM PA, the protein expression levels of p-IKKβ/T-IKKβ, p-IκB/T-IκB, p-p65/T-p65, KLF7 and IL-6 in 3T3-L1 adipocytes (a) and HepG2 cells (d). The mRNA expression levels of KLF7, IL-6, GLUT4, MCP-1 and TNF-α in 3T3-L1 adipocytes (b) and HepG2 cells (f). The expression levels of KLF7, p-p65 in HepG2 nuclear extracts (e). The glucose consumption ability in 3T3-L1 adipocytes (c) and HepG2 cells (g). One-way ANOVA-LSD, *NC compared with PA group, #PA compared with GW1100 group. *p < 0.05, **p < 0.01, ***p < 0.001, #p < 0.05, ##p < 0.01, ###p < 0.001, the difference was statistically significant, data presented as means ± SEM.
Fig. 2
Fig. 2. PA regulates KLF7 through GPRs/p-p65 signaling pathway.
Add AH7614 (50, 100, 150 μM) to culture medium while stimulated by 200 μM PA, the protein expression levels of p-IKKβ/T-IKKβ, p-IκB/T-IκB, p-p65/T-p65, KLF7 and IL-6 in 3T3-L1 adipocytes (a) and HepG2 cells (d). The mRNA expression levels of KLF7, IL-6, GLUT4, MCP-1 and TNF-α in 3T3-L1 adipocytes (b) and HepG2 cells (f). The expression levels of KLF7, p-p65 in HepG2 nuclear extracts (e). The glucose consumption ability in 3T3-L1 adipocytes (c) and HepG2 cells (g). One-way ANOVA-LSD, *NC compared with PA group, #PA compared with AH7614 group. *p < 0.05, **p < 0.01, ***p < 0.001, #p < 0.05, ##p < 0.01, ###p < 0.001, the difference was statistically significant, data presented as means ± SEM.
Fig. 3
Fig. 3. NF-κB has a transcriptional activation effect on KLF7.
Add 5 μM Bay 11-7082 to culture medium while stimulated by 200 μM PA to Inhibit the phosphorylation of p65, the protein and mRNA expressions of KLF7 reduced in 3T3-L1 adipocytes (a, b) and HepG2 cells (d, f) as well as protein expressions of p-p65 and KLF7 in HepG2 nuclear extracts (e). Inhibition of p-p65 improve the glucose consumption ability in 3T3-L1 adipocytes (c) and HepG2 cells (g). One-way ANOVA-LSD, *NC compared with PA group, #PA compared with Bay 11-7082 group. *p < 0.05, **p < 0.01, ***p < 0.001, #p < 0.05, ##p < 0.01, ###p < 0.001, the difference was statistically significant, data presented as means ± SEM. p65 overexpression plasmid was transfected to HepG2 and 293T cells, the mRNA and protein expression of p65, KLF7 were increased in HepG2 (h, i) and 293T cells (k, l). Blocking the phosphorylation of p-p65 while overexpressed p65, the protein expression levels of p-p65 and KLF7 were detected (j). Co-transfecting the human KLF7 promoter region luciferase plasmid and p65 overexpression plasmid into HepG2 cells, detection the luciferase activity value. ChIP assay performed showing enhanced p65 proteins binding to KLF7 gene promoter region (m). t-test, *p < 0.05, **p < 0.01, ***p < 0.001, the difference was statistically significant, data presented as means ± SEM.
Fig. 4
Fig. 4. The pharmacological effects of inhibit GPR40.
Male C57B/L6 mice were fed with NCD or HFD for 7 weeks, then mice in HFD group were divided into two groups, HFD group and mice intraperitoneally injected with GW1100 (2.5 mg/kg/day) for 5 weeks. The body weight of mice in NCD (n = 5), HFD (n = 8), and GW1100 (n = 8) injection group (ac). Weight of liver, epiWAT, subWAT, visWAT, prWAT in NCD, HFD, and GW100 group (e, f). Blood glucose in NCD, HFD, and GW1100 group (d). Plasma levels of palmitic acid, TG, TC, LDL, HDL in NCD, HFD, and GW1100 group (g). Protein expression of p-p65 and KLF7 in epiWAT and liver (j). mRNA levels of KLF7, IL-6, GLUT4 in epiWAT and liver (h). IL-6, MCP-1, TNF-α levels in mice plasma were detected using ELISA assay (i), HE staining of liver from mice in NCD, HFD, and GW1100 group (k). One-way ANOVA-LSD, t-test, *NCD compared with HFD group, #HFD compared with HFD + GW1100 group. *p < 0.05, **p < 0.01, ***p < 0.001, #p < 0.05, ##p < 0.01, ###p < 0.001, the difference was statistically significant, data presented as means ± SEM.
Fig. 5
Fig. 5. The pharmacological effects of inhibit GPR120.
Male C57B/L6 mice were fed with NCD or HFD for 7 weeks, then mice in HFD group were divided into two groups, HFD group and mice intraperitoneally injected with AH7614 (2.5 mg/kg/day) for 5 weeks. The body weight of mice in NCD (n = 5), HFD (n = 8), and AH7614 group (n = 8) (a, b). Weight of liver, epiWAT, subWAT, visWAT, prWAT in NCD, HFD, and AH7614 group (d, e). Blood glucose of mice in NCD, HFD, and AH7614 group (c). Plasma levels of palmitic acid, TG, TC, LDL, HDL of mice in NCD, HFD, and AH7614 group (f) (n = 5–8). Protein expression of p-p65 and KLF7 in epiWAT and liver (i). mRNA levels of KLF7, IL-6, GLUT4 in epiWAT and liver (g). IL-6, MCP-1, TNF-α levels in mice plasma were detected using ELISA (h) HE staining of liver from mice in NCD, HFD, and AH7614 group (j). One-way ANOVA-LSD, t-test, *NCD compared with HFD group, #HFD compared with HFD + AH7614 group. *p < 0.05, **p < 0.01, ***p < 0.001, #p < 0.05, ##p < 0.01, ###p < 0.001, the difference was statistically significant, data presented as means ± SEM.
Fig. 6
Fig. 6. The pharmacological effects of inhibit NF-κB.
Male C57B/L6 mice were fed with NCD or HFD for 7 weeks, then mice in HFD group were divided into two groups, HFD group and mice intraperitoneally injected with Bay 11-7082 (2.5 mg/kg/day) for 5 weeks. Dynamic changes in body of NCD, HFD, and Bay 11-7082 group (a, b). Weight of liver, epiWAT, subWAT, visWAT, prWAT in NCD (n = 5), HFD (n = 8), and Bay 11-7082 group (n = 6) (d, e). Blood glucose, GTT and ITT in NCD, HFD, and Bay 11-7082 group (c, f, g). Plasma levels of palmitic acid, TG, TC, LDL, HDL (h). Western blot of p-p65 and KLF7 in the murine epiWAT and liver (j). mRNA levels of KLF7, IL-6, GLUT4 in epiWAT and liver (i). HE staining of liver from mice (k). One-way ANOVA-LSD, t-test, *NCD compared with HFD group, #HFD compared with HFD + Bay 11-7082 group. *p < 0.05, **p < 0.01, ***p < 0.001, #p < 0.05, ##p < 0.01, ###p < 0.001, the difference was statistically significant, data presented as means ± SEM.
Fig. 7
Fig. 7. Pattern diagram.
Obesity-induced elevated palmitic acid can activate GPRs/NF-κB signaling pathway in liver and adipose tissue, up-regulate the expression of KLF7, and ultimately lead to glucose metabolism disorders.

References

    1. Engin A. The definition and prevalence of obesity and metabolic syndrome. Adv Exp Med Biol. 2017;960:1–17. doi: 10.1007/978-3-319-48382-5_1. - DOI - PubMed
    1. Pan Y, Hui X, Hoo RLC, Ye D, Chan CYC, Feng T, et al. Adipocyte-secreted exosomal microRNA-34a inhibits M2 macrophage polarization to promote obesity-induced adipose inflammation. J Clin Invest. 2019;129:834–49. doi: 10.1172/JCI123069. - DOI - PMC - PubMed
    1. Biden TJ, Boslem E, Chu KY, Sue N. Lipotoxic endoplasmic reticulum stress, β cell failure, and type 2 diabetes mellitus. Trends Endocrinol Metab. 2014;25:389–98. doi: 10.1016/j.tem.2014.02.003. - DOI - PubMed
    1. Palomer X, Pizarro-Delgado J, Barroso E, Vázquez-Carrera M. Palmitic and oleic acid: the Yin and Yang of fatty acids in type 2 diabetes mellitus. Trends Endocrinol Metab. 2018;29:178–90. doi: 10.1016/j.tem.2017.11.009. - DOI - PubMed
    1. Alnahdi A, John A, Raza H. Augmentation of glucotoxicity, oxidative stress, apoptosis and mitochondrial dysfunction in HepG2 cells by palmitic acid. Nutrients. 2019;11:1979. doi: 10.3390/nu11091979. - DOI - PMC - PubMed

Publication types

MeSH terms